

Key Insights
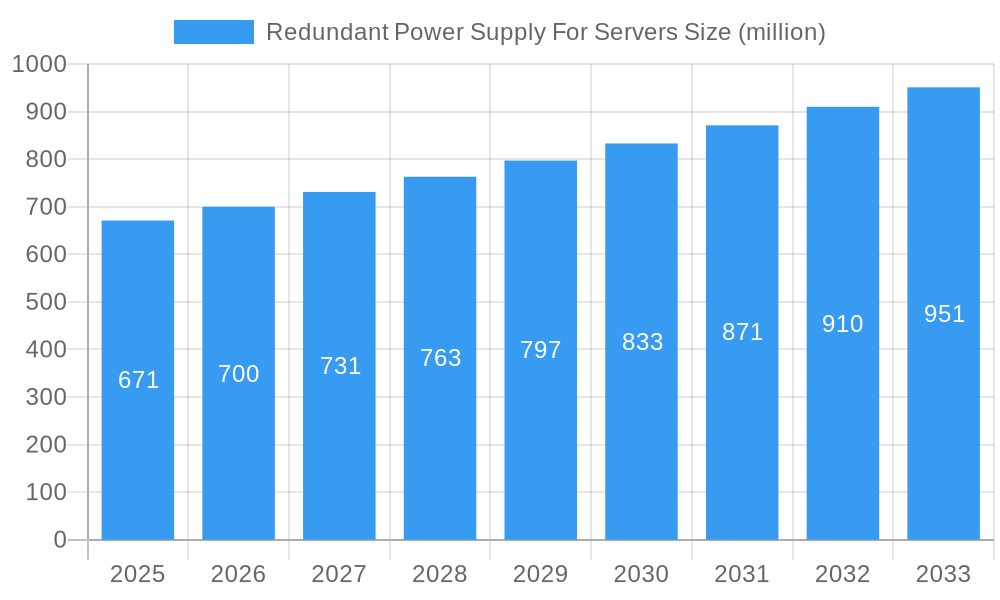
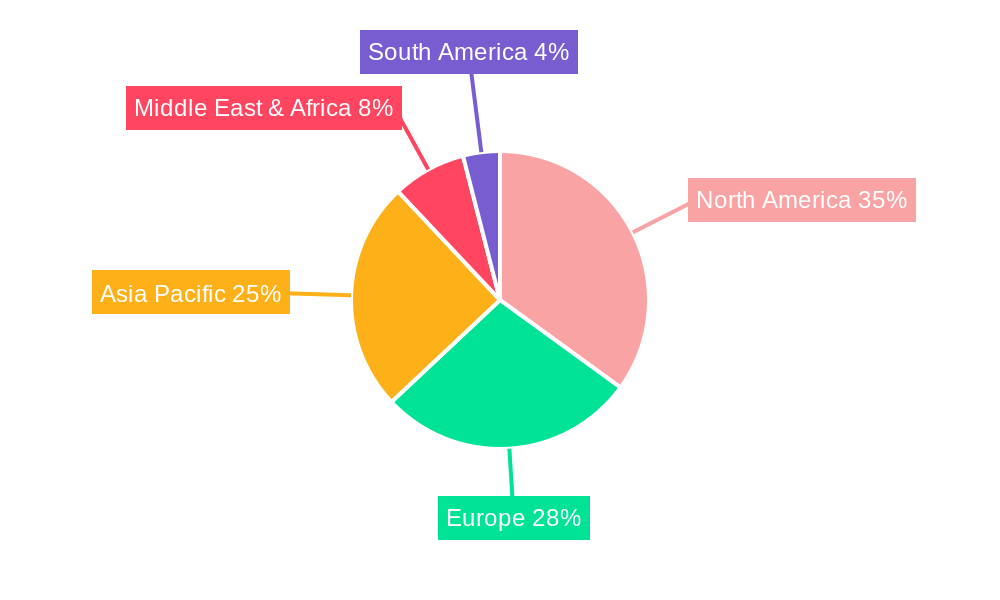
The Redundant Power Supply (RPS) for Servers market, valued at $671 million in 2025, is projected to experience robust growth, driven by the increasing demand for high availability and reliability in data centers and server infrastructure. The Compound Annual Growth Rate (CAGR) of 4.3% from 2025 to 2033 indicates a steady expansion, fueled by several key factors. The proliferation of cloud computing and edge computing necessitates robust power solutions to prevent costly downtime. Furthermore, stringent data security regulations are compelling businesses to invest in redundant power systems to ensure business continuity. The market segmentation reveals strong demand across various sectors, including the internet industry, government agencies, telecommunications companies, financial institutions, and manufacturing facilities. The preference for slim redundant power supplies is also increasing due to space constraints in modern data centers, influencing overall market dynamics. Growth is expected across all geographic regions, with North America and Asia-Pacific likely to remain the leading markets due to higher technological adoption and substantial investments in data center infrastructure. Competition is fierce amongst established players like Delta, Lite-On, and others, with new entrants constantly emerging. Technological advancements, focusing on improved efficiency and enhanced power management capabilities, will further drive market growth in the coming years.

Redundant Power Supply For Servers Market Size (In Million)
The forecast period (2025-2033) anticipates a continued expansion of the RPS for Servers market, influenced by the ongoing digital transformation across various industries. Increased adoption of virtualization and containerization technologies will further amplify the demand for reliable power solutions. While potential restraints like fluctuating raw material prices and economic downturns might exert some pressure, the overarching trend towards higher data center uptime and increased reliance on server infrastructure will likely sustain the market's growth trajectory. Product innovation, particularly in areas like energy efficiency and intelligent power management, will be key differentiators for vendors aiming to capture market share. The focus will be on delivering customized solutions tailored to the specific requirements of different applications and industry segments, ensuring sustained market expansion.
Redundant Power Supply For Servers Company Market Share
Redundant Power Supply For Servers Market Report: 2019-2033
This comprehensive report provides an in-depth analysis of the global Redundant Power Supply For Servers market, offering invaluable insights for stakeholders across the value chain. Covering the period from 2019 to 2033, with a focus on the 2025-2033 forecast period, this report meticulously examines market dynamics, competitive landscapes, and future growth prospects. The study analyzes market segments by application (Internet Industry, Government, Telecommunications, Financial, Manufacture, Traffic, Others) and type (Common Redundant Power Supply, Slim Redundant Power Supply), providing granular data and actionable intelligence for informed decision-making. Millions are used for all value estimations.
Redundant Power Supply For Servers Market Structure & Competitive Dynamics
The global redundant power supply for servers market exhibits a moderately concentrated structure, with key players vying for market share. The market concentration ratio (CR5) in 2025 is estimated at xx%. Innovation is driven by the need for higher efficiency, improved reliability, and smaller form factors to meet the demands of increasingly dense server deployments. Regulatory frameworks, particularly those concerning energy efficiency and safety standards, significantly influence market dynamics. Product substitutes, such as uninterruptible power supplies (UPS), present competitive challenges. End-user trends, such as the adoption of cloud computing and edge computing, are shaping demand. Mergers and acquisitions (M&A) activity has been moderate in recent years. For example, the total value of M&A deals in the sector from 2019-2024 is estimated to be $xx million, with an average deal value of $xx million.
- Key Market Players: Delta, Compuware, Lite-On, Chicony, Astesyn, China Greatwall Technology, Acbel, Murata Power Solutions, FSP, Enhance Electronics, ZIPPY TECHNOLOGY, Sure Star Computer, Shenzhen Honor Electronic, Gospower, SeaSonic, Silverstone.
- Market Share Distribution (2025): Delta (xx%), Compuware (xx%), Lite-On (xx%), Others (xx%).
- Innovation Ecosystems: Collaboration between power supply manufacturers and server OEMs is crucial for developing customized and optimized solutions.
Redundant Power Supply For Servers Industry Trends & Insights
The redundant power supply for servers market is experiencing robust growth, driven primarily by the increasing adoption of cloud computing and the expanding data center infrastructure globally. The market is expected to witness a compound annual growth rate (CAGR) of xx% during the forecast period (2025-2033). This growth is fueled by several factors, including the rising demand for high-availability data centers, enhanced energy efficiency requirements, and the growing adoption of virtualization technologies. Technological disruptions such as the integration of artificial intelligence (AI) and machine learning (ML) for predictive maintenance and improved power management are reshaping the industry landscape. Consumer preferences are shifting towards highly reliable and energy-efficient power supplies, leading manufacturers to focus on innovative designs and advanced technologies. The competitive dynamics are intense, with companies focusing on product differentiation, strategic partnerships, and technological advancements to maintain their market positions. Market penetration is expected to reach xx% by 2033.
Dominant Markets & Segments in Redundant Power Supply For Servers
The Internet Industry segment currently dominates the application segment, accounting for xx% of the total market revenue in 2025, driven by the massive data center expansion and stringent uptime requirements in this sector. Within the geographical landscape, North America and Asia-Pacific are leading markets.
Key Drivers of Internet Industry Dominance:
- Massive data center deployments
- High demand for high availability and reliability
- Stringent regulatory requirements for uptime
Key Drivers of North America & Asia-Pacific Dominance:
- High density of data centers
- Strong technological infrastructure
- Favorable government policies supporting technological advancement.
The Common Redundant Power Supply type holds a larger market share compared to Slim Redundant Power Supply, primarily due to its cost-effectiveness and suitability for various server applications.
Redundant Power Supply For Servers Product Innovations
Recent innovations focus on higher power density, improved efficiency (e.g., achieving xx% efficiency), and enhanced reliability features like redundant modules and advanced monitoring capabilities. These developments address the growing need for space optimization and reduced energy consumption in data centers. The integration of smart technologies, such as predictive maintenance algorithms, enhances operational efficiency and reduces downtime. The focus is on developing modular and scalable solutions to accommodate diverse server requirements and future-proof data center infrastructure.
Report Segmentation & Scope
Application: The report segments the market by application into Internet Industry, Government, Telecommunications, Financial, Manufacturing, Traffic, and Others. Each segment’s growth is projected based on its unique characteristics and market dynamics. For instance, the Internet Industry segment is expected to exhibit significant growth due to the surge in cloud computing adoption.
Type: The market is also segmented by type into Common Redundant Power Supply and Slim Redundant Power Supply. The Common Redundant Power Supply segment currently holds a larger market share due to its broader applicability and cost-effectiveness. However, the Slim Redundant Power Supply segment is expected to witness faster growth due to increased demand for space-saving solutions in high-density data centers.
The report provides detailed market size, growth projections, and competitive landscapes for each segment.
Key Drivers of Redundant Power Supply For Servers Growth
The growth of the redundant power supply for servers market is propelled by several key factors:
- Increased data center density: The rising demand for cloud computing and big data analytics is leading to the construction of larger and denser data centers, driving demand for reliable power supplies.
- Stringent uptime requirements: Businesses across various sectors rely heavily on uninterrupted IT operations, emphasizing the importance of redundant power solutions.
- Advancements in power supply technology: Innovations in power conversion efficiency and power density are making redundant power supplies more cost-effective and attractive.
- Government regulations on energy efficiency: Policies promoting energy-efficient technologies are driving demand for higher efficiency power supplies.
Challenges in the Redundant Power Supply For Servers Sector
The redundant power supply for server market faces several challenges:
- Supply chain disruptions: Global supply chain volatility can impact the availability and cost of raw materials and components.
- Intense competition: The market is characterized by intense competition among established players and emerging companies.
- Technological advancements: The rapid pace of technological change necessitates continuous innovation to remain competitive.
- Regulatory compliance: Adhering to stringent safety and environmental regulations can add cost and complexity. These factors can collectively affect profitability margins by approximately xx% in the next five years.
Leading Players in the Redundant Power Supply For Servers Market
- Delta
- Compuware
- Lite-On
- Chicony
- Astesyn
- China Greatwall Technology
- Acbel
- Murata Power Solutions
- FSP
- Enhance Electronics
- ZIPPY TECHNOLOGY
- Sure Star Computer
- Shenzhen Honor Electronic
- Gospower
- SeaSonic
- SilverStone
Key Developments in Redundant Power Supply For Servers Sector
- 2023 Q4: Delta launches a new series of high-efficiency redundant power supplies, increasing market share by xx%.
- 2022 Q3: A merger between two smaller power supply manufacturers results in a more consolidated market.
- 2021 Q1: Murata Power Solutions introduces a new power supply with advanced predictive maintenance capabilities, improving reliability scores for its clients by xx%. (Further developments will be added in the full report)
Strategic Redundant Power Supply For Servers Market Outlook
The redundant power supply for servers market is poised for continued growth, driven by the increasing adoption of cloud computing, edge computing, and the ongoing expansion of data centers worldwide. Strategic opportunities exist for companies focusing on developing energy-efficient, high-density, and intelligent power supply solutions. Strategic alliances and technological partnerships will become increasingly crucial for success in this competitive market. Focusing on emerging markets and leveraging AI-driven solutions for predictive maintenance and optimized power management will be key differentiators. The market is expected to reach $xx million by 2033.
Redundant Power Supply For Servers Segmentation
-
1. Application
- 1.1. Internet Industry
- 1.2. Government
- 1.3. Telecommunications
- 1.4. Financial
- 1.5. Manufacture
- 1.6. Traffic
- 1.7. Others
-
2. Type
- 2.1. Common Redundant Power Supply
- 2.2. Slim Redundant Power Supply
Redundant Power Supply For Servers Segmentation By Geography
-
1. North America
- 1.1. United States
- 1.2. Canada
- 1.3. Mexico
-
2. South America
- 2.1. Brazil
- 2.2. Argentina
- 2.3. Rest of South America
-
3. Europe
- 3.1. United Kingdom
- 3.2. Germany
- 3.3. France
- 3.4. Italy
- 3.5. Spain
- 3.6. Russia
- 3.7. Benelux
- 3.8. Nordics
- 3.9. Rest of Europe
-
4. Middle East & Africa
- 4.1. Turkey
- 4.2. Israel
- 4.3. GCC
- 4.4. North Africa
- 4.5. South Africa
- 4.6. Rest of Middle East & Africa
-
5. Asia Pacific
- 5.1. China
- 5.2. India
- 5.3. Japan
- 5.4. South Korea
- 5.5. ASEAN
- 5.6. Oceania
- 5.7. Rest of Asia Pacific
Redundant Power Supply For Servers Regional Market Share
Geographic Coverage of Redundant Power Supply For Servers
Redundant Power Supply For Servers REPORT HIGHLIGHTS
| Aspects | Details |
|---|---|
| Study Period | 2020-2034 |
| Base Year | 2025 |
| Estimated Year | 2026 |
| Forecast Period | 2026-2034 |
| Historical Period | 2020-2025 |
| Growth Rate | CAGR of 4.3% from 2020-2034 |
| Segmentation |
|
Table of Contents
- 1. Introduction
- 1.1. Research Scope
- 1.2. Market Segmentation
- 1.3. Research Objective
- 1.4. Definitions and Assumptions
- 2. Executive Summary
- 2.1. Market Snapshot
- 3. Market Dynamics
- 3.1. Market Drivers
- 3.2. Market Restrains
- 3.3. Market Trends
- 3.4. Market Opportunities
- 4. Market Factor Analysis
- 4.1. Porters Five Forces
- 4.1.1. Bargaining Power of Suppliers
- 4.1.2. Bargaining Power of Buyers
- 4.1.3. Threat of New Entrants
- 4.1.4. Threat of Substitutes
- 4.1.5. Competitive Rivalry
- 4.2. PESTEL analysis
- 4.3. BCG Analysis
- 4.3.1. Stars (High Growth, High Market Share)
- 4.3.2. Cash Cows (Low Growth, High Market Share)
- 4.3.3. Question Mark (High Growth, Low Market Share)
- 4.3.4. Dogs (Low Growth, Low Market Share)
- 4.4. Ansoff Matrix Analysis
- 4.5. Supply Chain Analysis
- 4.6. Regulatory Landscape
- 4.7. Current Market Potential and Opportunity Assessment (TAM–SAM–SOM Framework)
- 4.8. PMV Analyst Note
- 4.1. Porters Five Forces
- 5. Market Analysis, Insights and Forecast 2021-2033
- 5.1. Market Analysis, Insights and Forecast - by Application
- 5.1.1. Internet Industry
- 5.1.2. Government
- 5.1.3. Telecommunications
- 5.1.4. Financial
- 5.1.5. Manufacture
- 5.1.6. Traffic
- 5.1.7. Others
- 5.2. Market Analysis, Insights and Forecast - by Type
- 5.2.1. Common Redundant Power Supply
- 5.2.2. Slim Redundant Power Supply
- 5.3. Market Analysis, Insights and Forecast - by Region
- 5.3.1. North America
- 5.3.2. South America
- 5.3.3. Europe
- 5.3.4. Middle East & Africa
- 5.3.5. Asia Pacific
- 5.1. Market Analysis, Insights and Forecast - by Application
- 6. Global Redundant Power Supply For Servers Analysis, Insights and Forecast, 2021-2033
- 6.1. Market Analysis, Insights and Forecast - by Application
- 6.1.1. Internet Industry
- 6.1.2. Government
- 6.1.3. Telecommunications
- 6.1.4. Financial
- 6.1.5. Manufacture
- 6.1.6. Traffic
- 6.1.7. Others
- 6.2. Market Analysis, Insights and Forecast - by Type
- 6.2.1. Common Redundant Power Supply
- 6.2.2. Slim Redundant Power Supply
- 6.1. Market Analysis, Insights and Forecast - by Application
- 7. North America Redundant Power Supply For Servers Analysis, Insights and Forecast, 2020-2032
- 7.1. Market Analysis, Insights and Forecast - by Application
- 7.1.1. Internet Industry
- 7.1.2. Government
- 7.1.3. Telecommunications
- 7.1.4. Financial
- 7.1.5. Manufacture
- 7.1.6. Traffic
- 7.1.7. Others
- 7.2. Market Analysis, Insights and Forecast - by Type
- 7.2.1. Common Redundant Power Supply
- 7.2.2. Slim Redundant Power Supply
- 7.1. Market Analysis, Insights and Forecast - by Application
- 8. South America Redundant Power Supply For Servers Analysis, Insights and Forecast, 2020-2032
- 8.1. Market Analysis, Insights and Forecast - by Application
- 8.1.1. Internet Industry
- 8.1.2. Government
- 8.1.3. Telecommunications
- 8.1.4. Financial
- 8.1.5. Manufacture
- 8.1.6. Traffic
- 8.1.7. Others
- 8.2. Market Analysis, Insights and Forecast - by Type
- 8.2.1. Common Redundant Power Supply
- 8.2.2. Slim Redundant Power Supply
- 8.1. Market Analysis, Insights and Forecast - by Application
- 9. Europe Redundant Power Supply For Servers Analysis, Insights and Forecast, 2020-2032
- 9.1. Market Analysis, Insights and Forecast - by Application
- 9.1.1. Internet Industry
- 9.1.2. Government
- 9.1.3. Telecommunications
- 9.1.4. Financial
- 9.1.5. Manufacture
- 9.1.6. Traffic
- 9.1.7. Others
- 9.2. Market Analysis, Insights and Forecast - by Type
- 9.2.1. Common Redundant Power Supply
- 9.2.2. Slim Redundant Power Supply
- 9.1. Market Analysis, Insights and Forecast - by Application
- 10. Middle East & Africa Redundant Power Supply For Servers Analysis, Insights and Forecast, 2020-2032
- 10.1. Market Analysis, Insights and Forecast - by Application
- 10.1.1. Internet Industry
- 10.1.2. Government
- 10.1.3. Telecommunications
- 10.1.4. Financial
- 10.1.5. Manufacture
- 10.1.6. Traffic
- 10.1.7. Others
- 10.2. Market Analysis, Insights and Forecast - by Type
- 10.2.1. Common Redundant Power Supply
- 10.2.2. Slim Redundant Power Supply
- 10.1. Market Analysis, Insights and Forecast - by Application
- 11. Asia Pacific Redundant Power Supply For Servers Analysis, Insights and Forecast, 2020-2032
- 11.1. Market Analysis, Insights and Forecast - by Application
- 11.1.1. Internet Industry
- 11.1.2. Government
- 11.1.3. Telecommunications
- 11.1.4. Financial
- 11.1.5. Manufacture
- 11.1.6. Traffic
- 11.1.7. Others
- 11.2. Market Analysis, Insights and Forecast - by Type
- 11.2.1. Common Redundant Power Supply
- 11.2.2. Slim Redundant Power Supply
- 11.1. Market Analysis, Insights and Forecast - by Application
- 12. Competitive Analysis
- 12.1. Company Profiles
- 12.1.1 Delta
- 12.1.1.1. Company Overview
- 12.1.1.2. Products
- 12.1.1.3. Company Financials
- 12.1.1.4. SWOT Analysis
- 12.1.2 Compuware
- 12.1.2.1. Company Overview
- 12.1.2.2. Products
- 12.1.2.3. Company Financials
- 12.1.2.4. SWOT Analysis
- 12.1.3 Lite-On
- 12.1.3.1. Company Overview
- 12.1.3.2. Products
- 12.1.3.3. Company Financials
- 12.1.3.4. SWOT Analysis
- 12.1.4 Chicony
- 12.1.4.1. Company Overview
- 12.1.4.2. Products
- 12.1.4.3. Company Financials
- 12.1.4.4. SWOT Analysis
- 12.1.5 Astesyn
- 12.1.5.1. Company Overview
- 12.1.5.2. Products
- 12.1.5.3. Company Financials
- 12.1.5.4. SWOT Analysis
- 12.1.6 China Greatwall Technology
- 12.1.6.1. Company Overview
- 12.1.6.2. Products
- 12.1.6.3. Company Financials
- 12.1.6.4. SWOT Analysis
- 12.1.7 Acbel
- 12.1.7.1. Company Overview
- 12.1.7.2. Products
- 12.1.7.3. Company Financials
- 12.1.7.4. SWOT Analysis
- 12.1.8 Murata Power Solutions
- 12.1.8.1. Company Overview
- 12.1.8.2. Products
- 12.1.8.3. Company Financials
- 12.1.8.4. SWOT Analysis
- 12.1.9 FSP
- 12.1.9.1. Company Overview
- 12.1.9.2. Products
- 12.1.9.3. Company Financials
- 12.1.9.4. SWOT Analysis
- 12.1.10 Enhance Electronics
- 12.1.10.1. Company Overview
- 12.1.10.2. Products
- 12.1.10.3. Company Financials
- 12.1.10.4. SWOT Analysis
- 12.1.11 ZIPPY TECHNOLOGY
- 12.1.11.1. Company Overview
- 12.1.11.2. Products
- 12.1.11.3. Company Financials
- 12.1.11.4. SWOT Analysis
- 12.1.12 Sure Star Computer
- 12.1.12.1. Company Overview
- 12.1.12.2. Products
- 12.1.12.3. Company Financials
- 12.1.12.4. SWOT Analysis
- 12.1.13 Shenzhen Honor Electronic
- 12.1.13.1. Company Overview
- 12.1.13.2. Products
- 12.1.13.3. Company Financials
- 12.1.13.4. SWOT Analysis
- 12.1.14 Gospower
- 12.1.14.1. Company Overview
- 12.1.14.2. Products
- 12.1.14.3. Company Financials
- 12.1.14.4. SWOT Analysis
- 12.1.15 SeaSonic
- 12.1.15.1. Company Overview
- 12.1.15.2. Products
- 12.1.15.3. Company Financials
- 12.1.15.4. SWOT Analysis
- 12.1.16 SilverStone
- 12.1.16.1. Company Overview
- 12.1.16.2. Products
- 12.1.16.3. Company Financials
- 12.1.16.4. SWOT Analysis
- 12.1.1 Delta
- 12.2. Market Entropy
- 12.2.1 Company's Key Areas Served
- 12.2.2 Recent Developments
- 12.3. Company Market Share Analysis 2025
- 12.3.1 Top 5 Companies Market Share Analysis
- 12.3.2 Top 3 Companies Market Share Analysis
- 12.4. List of Potential Customers
- 13. Research Methodology
List of Figures
- Figure 1: Global Redundant Power Supply For Servers Revenue Breakdown (million, %) by Region 2025 & 2033
- Figure 2: North America Redundant Power Supply For Servers Revenue (million), by Application 2025 & 2033
- Figure 3: North America Redundant Power Supply For Servers Revenue Share (%), by Application 2025 & 2033
- Figure 4: North America Redundant Power Supply For Servers Revenue (million), by Type 2025 & 2033
- Figure 5: North America Redundant Power Supply For Servers Revenue Share (%), by Type 2025 & 2033
- Figure 6: North America Redundant Power Supply For Servers Revenue (million), by Country 2025 & 2033
- Figure 7: North America Redundant Power Supply For Servers Revenue Share (%), by Country 2025 & 2033
- Figure 8: South America Redundant Power Supply For Servers Revenue (million), by Application 2025 & 2033
- Figure 9: South America Redundant Power Supply For Servers Revenue Share (%), by Application 2025 & 2033
- Figure 10: South America Redundant Power Supply For Servers Revenue (million), by Type 2025 & 2033
- Figure 11: South America Redundant Power Supply For Servers Revenue Share (%), by Type 2025 & 2033
- Figure 12: South America Redundant Power Supply For Servers Revenue (million), by Country 2025 & 2033
- Figure 13: South America Redundant Power Supply For Servers Revenue Share (%), by Country 2025 & 2033
- Figure 14: Europe Redundant Power Supply For Servers Revenue (million), by Application 2025 & 2033
- Figure 15: Europe Redundant Power Supply For Servers Revenue Share (%), by Application 2025 & 2033
- Figure 16: Europe Redundant Power Supply For Servers Revenue (million), by Type 2025 & 2033
- Figure 17: Europe Redundant Power Supply For Servers Revenue Share (%), by Type 2025 & 2033
- Figure 18: Europe Redundant Power Supply For Servers Revenue (million), by Country 2025 & 2033
- Figure 19: Europe Redundant Power Supply For Servers Revenue Share (%), by Country 2025 & 2033
- Figure 20: Middle East & Africa Redundant Power Supply For Servers Revenue (million), by Application 2025 & 2033
- Figure 21: Middle East & Africa Redundant Power Supply For Servers Revenue Share (%), by Application 2025 & 2033
- Figure 22: Middle East & Africa Redundant Power Supply For Servers Revenue (million), by Type 2025 & 2033
- Figure 23: Middle East & Africa Redundant Power Supply For Servers Revenue Share (%), by Type 2025 & 2033
- Figure 24: Middle East & Africa Redundant Power Supply For Servers Revenue (million), by Country 2025 & 2033
- Figure 25: Middle East & Africa Redundant Power Supply For Servers Revenue Share (%), by Country 2025 & 2033
- Figure 26: Asia Pacific Redundant Power Supply For Servers Revenue (million), by Application 2025 & 2033
- Figure 27: Asia Pacific Redundant Power Supply For Servers Revenue Share (%), by Application 2025 & 2033
- Figure 28: Asia Pacific Redundant Power Supply For Servers Revenue (million), by Type 2025 & 2033
- Figure 29: Asia Pacific Redundant Power Supply For Servers Revenue Share (%), by Type 2025 & 2033
- Figure 30: Asia Pacific Redundant Power Supply For Servers Revenue (million), by Country 2025 & 2033
- Figure 31: Asia Pacific Redundant Power Supply For Servers Revenue Share (%), by Country 2025 & 2033
List of Tables
- Table 1: Global Redundant Power Supply For Servers Revenue million Forecast, by Application 2020 & 2033
- Table 2: Global Redundant Power Supply For Servers Revenue million Forecast, by Type 2020 & 2033
- Table 3: Global Redundant Power Supply For Servers Revenue million Forecast, by Region 2020 & 2033
- Table 4: Global Redundant Power Supply For Servers Revenue million Forecast, by Application 2020 & 2033
- Table 5: Global Redundant Power Supply For Servers Revenue million Forecast, by Type 2020 & 2033
- Table 6: Global Redundant Power Supply For Servers Revenue million Forecast, by Country 2020 & 2033
- Table 7: United States Redundant Power Supply For Servers Revenue (million) Forecast, by Application 2020 & 2033
- Table 8: Canada Redundant Power Supply For Servers Revenue (million) Forecast, by Application 2020 & 2033
- Table 9: Mexico Redundant Power Supply For Servers Revenue (million) Forecast, by Application 2020 & 2033
- Table 10: Global Redundant Power Supply For Servers Revenue million Forecast, by Application 2020 & 2033
- Table 11: Global Redundant Power Supply For Servers Revenue million Forecast, by Type 2020 & 2033
- Table 12: Global Redundant Power Supply For Servers Revenue million Forecast, by Country 2020 & 2033
- Table 13: Brazil Redundant Power Supply For Servers Revenue (million) Forecast, by Application 2020 & 2033
- Table 14: Argentina Redundant Power Supply For Servers Revenue (million) Forecast, by Application 2020 & 2033
- Table 15: Rest of South America Redundant Power Supply For Servers Revenue (million) Forecast, by Application 2020 & 2033
- Table 16: Global Redundant Power Supply For Servers Revenue million Forecast, by Application 2020 & 2033
- Table 17: Global Redundant Power Supply For Servers Revenue million Forecast, by Type 2020 & 2033
- Table 18: Global Redundant Power Supply For Servers Revenue million Forecast, by Country 2020 & 2033
- Table 19: United Kingdom Redundant Power Supply For Servers Revenue (million) Forecast, by Application 2020 & 2033
- Table 20: Germany Redundant Power Supply For Servers Revenue (million) Forecast, by Application 2020 & 2033
- Table 21: France Redundant Power Supply For Servers Revenue (million) Forecast, by Application 2020 & 2033
- Table 22: Italy Redundant Power Supply For Servers Revenue (million) Forecast, by Application 2020 & 2033
- Table 23: Spain Redundant Power Supply For Servers Revenue (million) Forecast, by Application 2020 & 2033
- Table 24: Russia Redundant Power Supply For Servers Revenue (million) Forecast, by Application 2020 & 2033
- Table 25: Benelux Redundant Power Supply For Servers Revenue (million) Forecast, by Application 2020 & 2033
- Table 26: Nordics Redundant Power Supply For Servers Revenue (million) Forecast, by Application 2020 & 2033
- Table 27: Rest of Europe Redundant Power Supply For Servers Revenue (million) Forecast, by Application 2020 & 2033
- Table 28: Global Redundant Power Supply For Servers Revenue million Forecast, by Application 2020 & 2033
- Table 29: Global Redundant Power Supply For Servers Revenue million Forecast, by Type 2020 & 2033
- Table 30: Global Redundant Power Supply For Servers Revenue million Forecast, by Country 2020 & 2033
- Table 31: Turkey Redundant Power Supply For Servers Revenue (million) Forecast, by Application 2020 & 2033
- Table 32: Israel Redundant Power Supply For Servers Revenue (million) Forecast, by Application 2020 & 2033
- Table 33: GCC Redundant Power Supply For Servers Revenue (million) Forecast, by Application 2020 & 2033
- Table 34: North Africa Redundant Power Supply For Servers Revenue (million) Forecast, by Application 2020 & 2033
- Table 35: South Africa Redundant Power Supply For Servers Revenue (million) Forecast, by Application 2020 & 2033
- Table 36: Rest of Middle East & Africa Redundant Power Supply For Servers Revenue (million) Forecast, by Application 2020 & 2033
- Table 37: Global Redundant Power Supply For Servers Revenue million Forecast, by Application 2020 & 2033
- Table 38: Global Redundant Power Supply For Servers Revenue million Forecast, by Type 2020 & 2033
- Table 39: Global Redundant Power Supply For Servers Revenue million Forecast, by Country 2020 & 2033
- Table 40: China Redundant Power Supply For Servers Revenue (million) Forecast, by Application 2020 & 2033
- Table 41: India Redundant Power Supply For Servers Revenue (million) Forecast, by Application 2020 & 2033
- Table 42: Japan Redundant Power Supply For Servers Revenue (million) Forecast, by Application 2020 & 2033
- Table 43: South Korea Redundant Power Supply For Servers Revenue (million) Forecast, by Application 2020 & 2033
- Table 44: ASEAN Redundant Power Supply For Servers Revenue (million) Forecast, by Application 2020 & 2033
- Table 45: Oceania Redundant Power Supply For Servers Revenue (million) Forecast, by Application 2020 & 2033
- Table 46: Rest of Asia Pacific Redundant Power Supply For Servers Revenue (million) Forecast, by Application 2020 & 2033
Frequently Asked Questions
1. What is the projected Compound Annual Growth Rate (CAGR) of the Redundant Power Supply For Servers?
The projected CAGR is approximately 4.3%.
2. Which companies are prominent players in the Redundant Power Supply For Servers?
Key companies in the market include Delta, Compuware, Lite-On, Chicony, Astesyn, China Greatwall Technology, Acbel, Murata Power Solutions, FSP, Enhance Electronics, ZIPPY TECHNOLOGY, Sure Star Computer, Shenzhen Honor Electronic, Gospower, SeaSonic, SilverStone.
3. What are the main segments of the Redundant Power Supply For Servers?
The market segments include Application, Type.
4. Can you provide details about the market size?
The market size is estimated to be USD 671 million as of 2022.
5. What are some drivers contributing to market growth?
N/A
6. What are the notable trends driving market growth?
N/A
7. Are there any restraints impacting market growth?
N/A
8. Can you provide examples of recent developments in the market?
N/A
9. What pricing options are available for accessing the report?
Pricing options include single-user, multi-user, and enterprise licenses priced at USD 4250.00, USD 6375.00, and USD 8500.00 respectively.
10. Is the market size provided in terms of value or volume?
The market size is provided in terms of value, measured in million.
11. Are there any specific market keywords associated with the report?
Yes, the market keyword associated with the report is "Redundant Power Supply For Servers," which aids in identifying and referencing the specific market segment covered.
12. How do I determine which pricing option suits my needs best?
The pricing options vary based on user requirements and access needs. Individual users may opt for single-user licenses, while businesses requiring broader access may choose multi-user or enterprise licenses for cost-effective access to the report.
13. Are there any additional resources or data provided in the Redundant Power Supply For Servers report?
While the report offers comprehensive insights, it's advisable to review the specific contents or supplementary materials provided to ascertain if additional resources or data are available.
14. How can I stay updated on further developments or reports in the Redundant Power Supply For Servers?
To stay informed about further developments, trends, and reports in the Redundant Power Supply For Servers, consider subscribing to industry newsletters, following relevant companies and organizations, or regularly checking reputable industry news sources and publications.
Methodology
Step 1 - Identification of Relevant Samples Size from Population Database


Step 2 - Approaches for Defining Global Market Size (Value, Volume* & Price*)

Note*: In applicable scenarios
Step 3 - Data Sources
Primary Research
- Web Analytics
- Survey Reports
- Research Institute
- Latest Research Reports
- Opinion Leaders
Secondary Research
- Annual Reports
- White Paper
- Latest Press Release
- Industry Association
- Paid Database
- Investor Presentations

Step 4 - Data Triangulation
Involves using different sources of information in order to increase the validity of a study
These sources are likely to be stakeholders in a program - participants, other researchers, program staff, other community members, and so on.
Then we put all data in single framework & apply various statistical tools to find out the dynamic on the market.
During the analysis stage, feedback from the stakeholder groups would be compared to determine areas of agreement as well as areas of divergence