

Key Insights
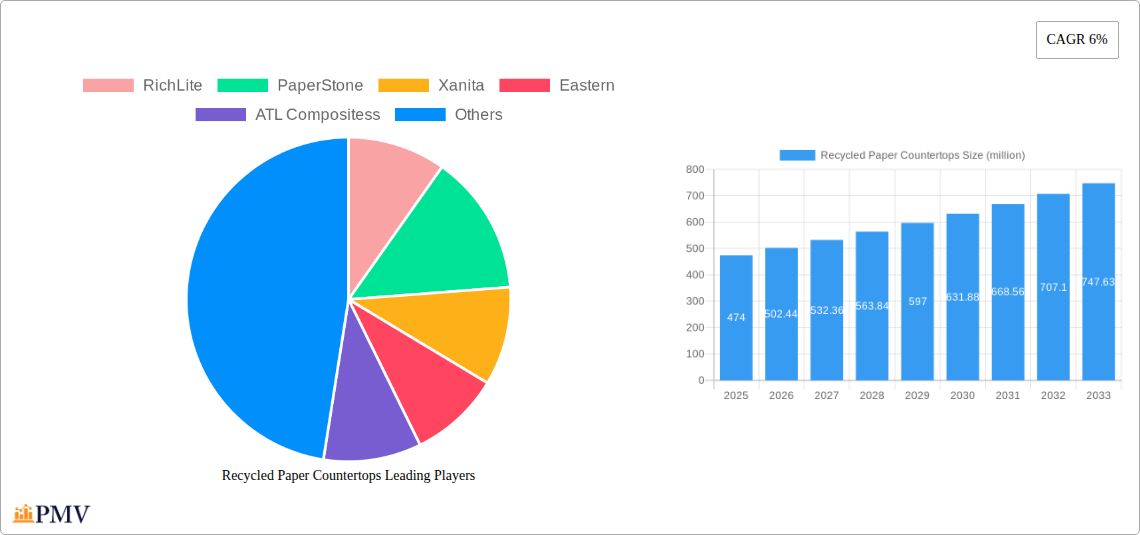
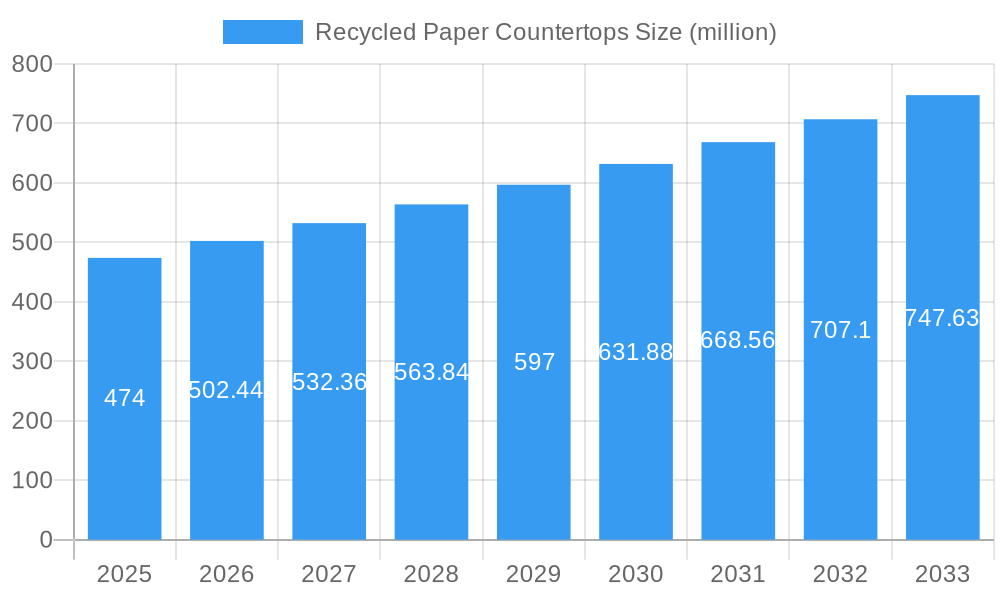
The recycled paper countertop market, currently valued at $474 million in 2025, is projected to experience robust growth, driven by increasing consumer demand for sustainable and eco-friendly building materials. A Compound Annual Growth Rate (CAGR) of 6% from 2025 to 2033 indicates a significant expansion of this market. Key drivers include growing environmental awareness among consumers and businesses, stricter regulations on landfill waste, and the increasing availability of recycled paper materials suitable for countertop manufacturing. Furthermore, the inherent aesthetic appeal of paper countertops, offering a unique and modern design element, is contributing to market expansion. This growth is further fueled by innovations in manufacturing techniques leading to improved durability, water resistance, and overall performance of these countertops, addressing past limitations. The market is segmented by various factors, including countertop type (e.g., edge profiles, thicknesses), application (residential, commercial), and geographic region. Major players like RichLite, PaperStone, Xanita, Eastern, and ATL Composites are actively shaping the market through product innovation and expansion strategies.
Recycled Paper Countertops Market Size (In Million)
Despite the positive outlook, certain challenges could hinder market growth. The relatively higher initial cost compared to traditional countertop materials might deter some consumers. However, the long-term cost-effectiveness, coupled with the environmental benefits, is gradually overcoming this barrier. Fluctuations in raw material prices, particularly recycled paper, could impact production costs and profitability. Furthermore, educating consumers about the benefits and versatility of recycled paper countertops remains crucial for sustained market growth. The future of the market hinges on continued innovation, expansion into new geographical regions, and strategic marketing efforts to highlight its sustainability and design advantages.
Recycled Paper Countertops Company Market Share
Recycled Paper Countertops Market Report: 2019-2033
This comprehensive report provides an in-depth analysis of the global recycled paper countertops market, offering invaluable insights for businesses, investors, and stakeholders seeking to understand this dynamic and growing sector. The study period covers 2019-2033, with 2025 serving as the base and estimated year. The forecast period spans 2025-2033, and the historical period encompasses 2019-2024. The report projects a market value exceeding $xx million by 2033, driven by increasing environmental consciousness and the demand for sustainable building materials. Key players like RichLite, PaperStone, Xanita, Eastern, and ATL Compositess are analyzed for their market share, strategies, and competitive positioning.
Recycled Paper Countertops Market Structure & Competitive Dynamics
The global recycled paper countertops market exhibits a moderately concentrated structure, with a handful of major players commanding significant market share. RichLite, PaperStone, and Xanita, hold the largest portions, estimated at xx%, xx%, and xx% respectively, in 2025. The remaining share is divided among smaller regional players and niche manufacturers like Eastern and ATL Compositess. Innovation within the sector centers around improving material properties – enhancing durability, water resistance, and aesthetic appeal – and expanding applications beyond kitchen countertops. Regulatory frameworks vary geographically, influencing material standards and environmental certifications. Product substitutes, primarily solid surface materials and natural stone, pose a competitive threat. However, growing environmental awareness drives the demand for sustainable alternatives. End-user trends favor eco-friendly and aesthetically pleasing options. M&A activity has been moderate, with a few notable deals valued at approximately $xx million in the past five years, primarily focused on expanding geographic reach and production capacity.
Recycled Paper Countertops Industry Trends & Insights
The recycled paper countertops market is experiencing robust growth, with a projected CAGR of xx% during the forecast period (2025-2033). Several factors contribute to this expansion. Firstly, rising consumer awareness of environmental issues fuels the demand for sustainable building products. Secondly, architectural and design trends increasingly favor natural and eco-conscious materials. Technological advancements are focusing on improving the material's performance characteristics, including stain resistance, durability and hygiene. The market penetration of recycled paper countertops is still relatively low, suggesting significant potential for future growth. Intense competition among manufacturers is driving innovation and price optimization, further accelerating market expansion. The market segment focusing on high-end residential applications shows the most potential and highest CAGR in the coming years.
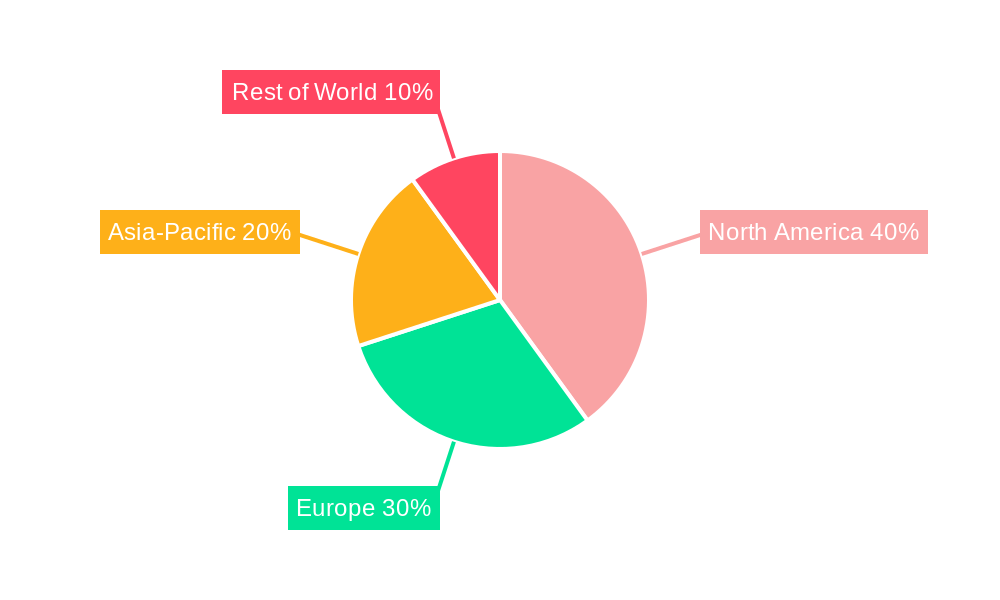
Dominant Markets & Segments in Recycled Paper Countertops
The North American market currently dominates the recycled paper countertops sector, accounting for approximately xx% of the global market share in 2025. This dominance stems from several factors:
- Strong environmental regulations: Stringent environmental regulations and policies promote the adoption of sustainable building materials.
- High disposable income: A substantial portion of the population has higher disposable income, enabling them to invest in premium, eco-friendly products.
- Established distribution networks: Mature building material distribution channels facilitate easy access to recycled paper countertops.
Europe follows as a significant market, with a growing adoption rate driven by similar environmental awareness and a shift towards sustainable construction practices. Asia Pacific is witnessing a surge in demand, propelled by rapid urbanization and increasing disposable incomes.
Recycled Paper Countertops Product Innovations
Recent innovations in recycled paper countertops have focused on enhancing both aesthetic appeal and performance. Manufacturers are developing new surface finishes and colors to meet diverse design preferences, while also improving durability and water resistance through advanced bonding techniques and surface treatments. These improvements are broadening the applications of recycled paper countertops, expanding their use beyond kitchens into bathrooms, offices, and other commercial settings.
Report Segmentation & Scope
The report segments the recycled paper countertops market based on material type, application, and region. Material type segmentation includes different types of recycled paper composition, analyzing the cost, benefits and limitations of each. Application segmentation categorizes countertops into residential and commercial sectors, with projections for each based on growth rate and market size. Regional segmentation offers insights into the performance of markets across North America, Europe, Asia Pacific, and other regions. Each segment is analyzed with growth projections, market sizes and competitive dynamics.
Key Drivers of Recycled Paper Countertops Growth
Several key factors are driving the expansion of the recycled paper countertops market. The growing global emphasis on sustainability is a major factor. Government regulations promoting the use of eco-friendly building materials are also contributing to market growth. Technological advancements in the production processes have significantly enhanced product quality, durability, and aesthetics. Further increasing affordability and broader availability, especially in developing economies, is another critical factor.
Challenges in the Recycled Paper Countertops Sector
The industry faces challenges such as fluctuations in raw material prices, which can directly affect manufacturing costs. The relatively high initial cost compared to traditional materials can also hinder wider adoption. Supply chain disruptions can impact production and delivery timelines. Competitive pressures from traditional countertop materials like granite and quartz require continuous product innovation. Maintaining consistent product quality and meeting stringent industry standards pose additional challenges.
Leading Players in the Recycled Paper Countertops Market
- RichLite
- PaperStone
- Xanita
- Eastern
- ATL Compositess
Key Developments in Recycled Paper Countertops Sector
- 2022 Q3: RichLite launched a new line of recycled paper countertops with enhanced stain resistance.
- 2023 Q1: PaperStone announced a partnership to expand its distribution network in Europe.
- 2024 Q2: Xanita introduced a new manufacturing process resulting in reduced production costs.
Strategic Recycled Paper Countertops Market Outlook
The recycled paper countertops market is poised for significant growth in the coming years. Continued technological advancements, coupled with rising environmental awareness and supportive government policies, will fuel market expansion. Strategic opportunities exist for manufacturers focusing on product differentiation, cost optimization, and expansion into new geographical markets. Companies that prioritize sustainable practices and build strong supply chains will be best positioned for long-term success in this increasingly important sector.
Recycled Paper Countertops Segmentation
-
1. Application
- 1.1. Residential
- 1.2. Commercial
- 1.3. Others
-
2. Types
- 2.1. 1.2 cm
- 2.2. 2 cm
- 2.3. 3 cm
- 2.4. Others
Recycled Paper Countertops Segmentation By Geography
-
1. North America
- 1.1. United States
- 1.2. Canada
- 1.3. Mexico
-
2. South America
- 2.1. Brazil
- 2.2. Argentina
- 2.3. Rest of South America
-
3. Europe
- 3.1. United Kingdom
- 3.2. Germany
- 3.3. France
- 3.4. Italy
- 3.5. Spain
- 3.6. Russia
- 3.7. Benelux
- 3.8. Nordics
- 3.9. Rest of Europe
-
4. Middle East & Africa
- 4.1. Turkey
- 4.2. Israel
- 4.3. GCC
- 4.4. North Africa
- 4.5. South Africa
- 4.6. Rest of Middle East & Africa
-
5. Asia Pacific
- 5.1. China
- 5.2. India
- 5.3. Japan
- 5.4. South Korea
- 5.5. ASEAN
- 5.6. Oceania
- 5.7. Rest of Asia Pacific
Recycled Paper Countertops Regional Market Share
Geographic Coverage of Recycled Paper Countertops
Recycled Paper Countertops REPORT HIGHLIGHTS
| Aspects | Details |
|---|---|
| Study Period | 2020-2034 |
| Base Year | 2025 |
| Estimated Year | 2026 |
| Forecast Period | 2026-2034 |
| Historical Period | 2020-2025 |
| Growth Rate | CAGR of 6% from 2020-2034 |
| Segmentation |
|
Table of Contents
- 1. Introduction
- 1.1. Research Scope
- 1.2. Market Segmentation
- 1.3. Research Objective
- 1.4. Definitions and Assumptions
- 2. Executive Summary
- 2.1. Market Snapshot
- 3. Market Dynamics
- 3.1. Market Drivers
- 3.2. Market Restrains
- 3.3. Market Trends
- 3.4. Market Opportunities
- 4. Market Factor Analysis
- 4.1. Porters Five Forces
- 4.1.1. Bargaining Power of Suppliers
- 4.1.2. Bargaining Power of Buyers
- 4.1.3. Threat of New Entrants
- 4.1.4. Threat of Substitutes
- 4.1.5. Competitive Rivalry
- 4.2. PESTEL analysis
- 4.3. BCG Analysis
- 4.3.1. Stars (High Growth, High Market Share)
- 4.3.2. Cash Cows (Low Growth, High Market Share)
- 4.3.3. Question Mark (High Growth, Low Market Share)
- 4.3.4. Dogs (Low Growth, Low Market Share)
- 4.4. Ansoff Matrix Analysis
- 4.5. Supply Chain Analysis
- 4.6. Regulatory Landscape
- 4.7. Current Market Potential and Opportunity Assessment (TAM–SAM–SOM Framework)
- 4.8. PMV Analyst Note
- 4.1. Porters Five Forces
- 5. Market Analysis, Insights and Forecast 2021-2033
- 5.1. Market Analysis, Insights and Forecast - by Application
- 5.1.1. Residential
- 5.1.2. Commercial
- 5.1.3. Others
- 5.2. Market Analysis, Insights and Forecast - by Types
- 5.2.1. 1.2 cm
- 5.2.2. 2 cm
- 5.2.3. 3 cm
- 5.2.4. Others
- 5.3. Market Analysis, Insights and Forecast - by Region
- 5.3.1. North America
- 5.3.2. South America
- 5.3.3. Europe
- 5.3.4. Middle East & Africa
- 5.3.5. Asia Pacific
- 5.1. Market Analysis, Insights and Forecast - by Application
- 6. Global Recycled Paper Countertops Analysis, Insights and Forecast, 2021-2033
- 6.1. Market Analysis, Insights and Forecast - by Application
- 6.1.1. Residential
- 6.1.2. Commercial
- 6.1.3. Others
- 6.2. Market Analysis, Insights and Forecast - by Types
- 6.2.1. 1.2 cm
- 6.2.2. 2 cm
- 6.2.3. 3 cm
- 6.2.4. Others
- 6.1. Market Analysis, Insights and Forecast - by Application
- 7. North America Recycled Paper Countertops Analysis, Insights and Forecast, 2020-2032
- 7.1. Market Analysis, Insights and Forecast - by Application
- 7.1.1. Residential
- 7.1.2. Commercial
- 7.1.3. Others
- 7.2. Market Analysis, Insights and Forecast - by Types
- 7.2.1. 1.2 cm
- 7.2.2. 2 cm
- 7.2.3. 3 cm
- 7.2.4. Others
- 7.1. Market Analysis, Insights and Forecast - by Application
- 8. South America Recycled Paper Countertops Analysis, Insights and Forecast, 2020-2032
- 8.1. Market Analysis, Insights and Forecast - by Application
- 8.1.1. Residential
- 8.1.2. Commercial
- 8.1.3. Others
- 8.2. Market Analysis, Insights and Forecast - by Types
- 8.2.1. 1.2 cm
- 8.2.2. 2 cm
- 8.2.3. 3 cm
- 8.2.4. Others
- 8.1. Market Analysis, Insights and Forecast - by Application
- 9. Europe Recycled Paper Countertops Analysis, Insights and Forecast, 2020-2032
- 9.1. Market Analysis, Insights and Forecast - by Application
- 9.1.1. Residential
- 9.1.2. Commercial
- 9.1.3. Others
- 9.2. Market Analysis, Insights and Forecast - by Types
- 9.2.1. 1.2 cm
- 9.2.2. 2 cm
- 9.2.3. 3 cm
- 9.2.4. Others
- 9.1. Market Analysis, Insights and Forecast - by Application
- 10. Middle East & Africa Recycled Paper Countertops Analysis, Insights and Forecast, 2020-2032
- 10.1. Market Analysis, Insights and Forecast - by Application
- 10.1.1. Residential
- 10.1.2. Commercial
- 10.1.3. Others
- 10.2. Market Analysis, Insights and Forecast - by Types
- 10.2.1. 1.2 cm
- 10.2.2. 2 cm
- 10.2.3. 3 cm
- 10.2.4. Others
- 10.1. Market Analysis, Insights and Forecast - by Application
- 11. Asia Pacific Recycled Paper Countertops Analysis, Insights and Forecast, 2020-2032
- 11.1. Market Analysis, Insights and Forecast - by Application
- 11.1.1. Residential
- 11.1.2. Commercial
- 11.1.3. Others
- 11.2. Market Analysis, Insights and Forecast - by Types
- 11.2.1. 1.2 cm
- 11.2.2. 2 cm
- 11.2.3. 3 cm
- 11.2.4. Others
- 11.1. Market Analysis, Insights and Forecast - by Application
- 12. Competitive Analysis
- 12.1. Company Profiles
- 12.1.1 RichLite
- 12.1.1.1. Company Overview
- 12.1.1.2. Products
- 12.1.1.3. Company Financials
- 12.1.1.4. SWOT Analysis
- 12.1.2 PaperStone
- 12.1.2.1. Company Overview
- 12.1.2.2. Products
- 12.1.2.3. Company Financials
- 12.1.2.4. SWOT Analysis
- 12.1.3 Xanita
- 12.1.3.1. Company Overview
- 12.1.3.2. Products
- 12.1.3.3. Company Financials
- 12.1.3.4. SWOT Analysis
- 12.1.4 Eastern
- 12.1.4.1. Company Overview
- 12.1.4.2. Products
- 12.1.4.3. Company Financials
- 12.1.4.4. SWOT Analysis
- 12.1.5 ATL Compositess
- 12.1.5.1. Company Overview
- 12.1.5.2. Products
- 12.1.5.3. Company Financials
- 12.1.5.4. SWOT Analysis
- 12.1.1 RichLite
- 12.2. Market Entropy
- 12.2.1 Company's Key Areas Served
- 12.2.2 Recent Developments
- 12.3. Company Market Share Analysis 2025
- 12.3.1 Top 5 Companies Market Share Analysis
- 12.3.2 Top 3 Companies Market Share Analysis
- 12.4. List of Potential Customers
- 13. Research Methodology
List of Figures
- Figure 1: Global Recycled Paper Countertops Revenue Breakdown (million, %) by Region 2025 & 2033
- Figure 2: Global Recycled Paper Countertops Volume Breakdown (K, %) by Region 2025 & 2033
- Figure 3: North America Recycled Paper Countertops Revenue (million), by Application 2025 & 2033
- Figure 4: North America Recycled Paper Countertops Volume (K), by Application 2025 & 2033
- Figure 5: North America Recycled Paper Countertops Revenue Share (%), by Application 2025 & 2033
- Figure 6: North America Recycled Paper Countertops Volume Share (%), by Application 2025 & 2033
- Figure 7: North America Recycled Paper Countertops Revenue (million), by Types 2025 & 2033
- Figure 8: North America Recycled Paper Countertops Volume (K), by Types 2025 & 2033
- Figure 9: North America Recycled Paper Countertops Revenue Share (%), by Types 2025 & 2033
- Figure 10: North America Recycled Paper Countertops Volume Share (%), by Types 2025 & 2033
- Figure 11: North America Recycled Paper Countertops Revenue (million), by Country 2025 & 2033
- Figure 12: North America Recycled Paper Countertops Volume (K), by Country 2025 & 2033
- Figure 13: North America Recycled Paper Countertops Revenue Share (%), by Country 2025 & 2033
- Figure 14: North America Recycled Paper Countertops Volume Share (%), by Country 2025 & 2033
- Figure 15: South America Recycled Paper Countertops Revenue (million), by Application 2025 & 2033
- Figure 16: South America Recycled Paper Countertops Volume (K), by Application 2025 & 2033
- Figure 17: South America Recycled Paper Countertops Revenue Share (%), by Application 2025 & 2033
- Figure 18: South America Recycled Paper Countertops Volume Share (%), by Application 2025 & 2033
- Figure 19: South America Recycled Paper Countertops Revenue (million), by Types 2025 & 2033
- Figure 20: South America Recycled Paper Countertops Volume (K), by Types 2025 & 2033
- Figure 21: South America Recycled Paper Countertops Revenue Share (%), by Types 2025 & 2033
- Figure 22: South America Recycled Paper Countertops Volume Share (%), by Types 2025 & 2033
- Figure 23: South America Recycled Paper Countertops Revenue (million), by Country 2025 & 2033
- Figure 24: South America Recycled Paper Countertops Volume (K), by Country 2025 & 2033
- Figure 25: South America Recycled Paper Countertops Revenue Share (%), by Country 2025 & 2033
- Figure 26: South America Recycled Paper Countertops Volume Share (%), by Country 2025 & 2033
- Figure 27: Europe Recycled Paper Countertops Revenue (million), by Application 2025 & 2033
- Figure 28: Europe Recycled Paper Countertops Volume (K), by Application 2025 & 2033
- Figure 29: Europe Recycled Paper Countertops Revenue Share (%), by Application 2025 & 2033
- Figure 30: Europe Recycled Paper Countertops Volume Share (%), by Application 2025 & 2033
- Figure 31: Europe Recycled Paper Countertops Revenue (million), by Types 2025 & 2033
- Figure 32: Europe Recycled Paper Countertops Volume (K), by Types 2025 & 2033
- Figure 33: Europe Recycled Paper Countertops Revenue Share (%), by Types 2025 & 2033
- Figure 34: Europe Recycled Paper Countertops Volume Share (%), by Types 2025 & 2033
- Figure 35: Europe Recycled Paper Countertops Revenue (million), by Country 2025 & 2033
- Figure 36: Europe Recycled Paper Countertops Volume (K), by Country 2025 & 2033
- Figure 37: Europe Recycled Paper Countertops Revenue Share (%), by Country 2025 & 2033
- Figure 38: Europe Recycled Paper Countertops Volume Share (%), by Country 2025 & 2033
- Figure 39: Middle East & Africa Recycled Paper Countertops Revenue (million), by Application 2025 & 2033
- Figure 40: Middle East & Africa Recycled Paper Countertops Volume (K), by Application 2025 & 2033
- Figure 41: Middle East & Africa Recycled Paper Countertops Revenue Share (%), by Application 2025 & 2033
- Figure 42: Middle East & Africa Recycled Paper Countertops Volume Share (%), by Application 2025 & 2033
- Figure 43: Middle East & Africa Recycled Paper Countertops Revenue (million), by Types 2025 & 2033
- Figure 44: Middle East & Africa Recycled Paper Countertops Volume (K), by Types 2025 & 2033
- Figure 45: Middle East & Africa Recycled Paper Countertops Revenue Share (%), by Types 2025 & 2033
- Figure 46: Middle East & Africa Recycled Paper Countertops Volume Share (%), by Types 2025 & 2033
- Figure 47: Middle East & Africa Recycled Paper Countertops Revenue (million), by Country 2025 & 2033
- Figure 48: Middle East & Africa Recycled Paper Countertops Volume (K), by Country 2025 & 2033
- Figure 49: Middle East & Africa Recycled Paper Countertops Revenue Share (%), by Country 2025 & 2033
- Figure 50: Middle East & Africa Recycled Paper Countertops Volume Share (%), by Country 2025 & 2033
- Figure 51: Asia Pacific Recycled Paper Countertops Revenue (million), by Application 2025 & 2033
- Figure 52: Asia Pacific Recycled Paper Countertops Volume (K), by Application 2025 & 2033
- Figure 53: Asia Pacific Recycled Paper Countertops Revenue Share (%), by Application 2025 & 2033
- Figure 54: Asia Pacific Recycled Paper Countertops Volume Share (%), by Application 2025 & 2033
- Figure 55: Asia Pacific Recycled Paper Countertops Revenue (million), by Types 2025 & 2033
- Figure 56: Asia Pacific Recycled Paper Countertops Volume (K), by Types 2025 & 2033
- Figure 57: Asia Pacific Recycled Paper Countertops Revenue Share (%), by Types 2025 & 2033
- Figure 58: Asia Pacific Recycled Paper Countertops Volume Share (%), by Types 2025 & 2033
- Figure 59: Asia Pacific Recycled Paper Countertops Revenue (million), by Country 2025 & 2033
- Figure 60: Asia Pacific Recycled Paper Countertops Volume (K), by Country 2025 & 2033
- Figure 61: Asia Pacific Recycled Paper Countertops Revenue Share (%), by Country 2025 & 2033
- Figure 62: Asia Pacific Recycled Paper Countertops Volume Share (%), by Country 2025 & 2033
List of Tables
- Table 1: Global Recycled Paper Countertops Revenue million Forecast, by Application 2020 & 2033
- Table 2: Global Recycled Paper Countertops Volume K Forecast, by Application 2020 & 2033
- Table 3: Global Recycled Paper Countertops Revenue million Forecast, by Types 2020 & 2033
- Table 4: Global Recycled Paper Countertops Volume K Forecast, by Types 2020 & 2033
- Table 5: Global Recycled Paper Countertops Revenue million Forecast, by Region 2020 & 2033
- Table 6: Global Recycled Paper Countertops Volume K Forecast, by Region 2020 & 2033
- Table 7: Global Recycled Paper Countertops Revenue million Forecast, by Application 2020 & 2033
- Table 8: Global Recycled Paper Countertops Volume K Forecast, by Application 2020 & 2033
- Table 9: Global Recycled Paper Countertops Revenue million Forecast, by Types 2020 & 2033
- Table 10: Global Recycled Paper Countertops Volume K Forecast, by Types 2020 & 2033
- Table 11: Global Recycled Paper Countertops Revenue million Forecast, by Country 2020 & 2033
- Table 12: Global Recycled Paper Countertops Volume K Forecast, by Country 2020 & 2033
- Table 13: United States Recycled Paper Countertops Revenue (million) Forecast, by Application 2020 & 2033
- Table 14: United States Recycled Paper Countertops Volume (K) Forecast, by Application 2020 & 2033
- Table 15: Canada Recycled Paper Countertops Revenue (million) Forecast, by Application 2020 & 2033
- Table 16: Canada Recycled Paper Countertops Volume (K) Forecast, by Application 2020 & 2033
- Table 17: Mexico Recycled Paper Countertops Revenue (million) Forecast, by Application 2020 & 2033
- Table 18: Mexico Recycled Paper Countertops Volume (K) Forecast, by Application 2020 & 2033
- Table 19: Global Recycled Paper Countertops Revenue million Forecast, by Application 2020 & 2033
- Table 20: Global Recycled Paper Countertops Volume K Forecast, by Application 2020 & 2033
- Table 21: Global Recycled Paper Countertops Revenue million Forecast, by Types 2020 & 2033
- Table 22: Global Recycled Paper Countertops Volume K Forecast, by Types 2020 & 2033
- Table 23: Global Recycled Paper Countertops Revenue million Forecast, by Country 2020 & 2033
- Table 24: Global Recycled Paper Countertops Volume K Forecast, by Country 2020 & 2033
- Table 25: Brazil Recycled Paper Countertops Revenue (million) Forecast, by Application 2020 & 2033
- Table 26: Brazil Recycled Paper Countertops Volume (K) Forecast, by Application 2020 & 2033
- Table 27: Argentina Recycled Paper Countertops Revenue (million) Forecast, by Application 2020 & 2033
- Table 28: Argentina Recycled Paper Countertops Volume (K) Forecast, by Application 2020 & 2033
- Table 29: Rest of South America Recycled Paper Countertops Revenue (million) Forecast, by Application 2020 & 2033
- Table 30: Rest of South America Recycled Paper Countertops Volume (K) Forecast, by Application 2020 & 2033
- Table 31: Global Recycled Paper Countertops Revenue million Forecast, by Application 2020 & 2033
- Table 32: Global Recycled Paper Countertops Volume K Forecast, by Application 2020 & 2033
- Table 33: Global Recycled Paper Countertops Revenue million Forecast, by Types 2020 & 2033
- Table 34: Global Recycled Paper Countertops Volume K Forecast, by Types 2020 & 2033
- Table 35: Global Recycled Paper Countertops Revenue million Forecast, by Country 2020 & 2033
- Table 36: Global Recycled Paper Countertops Volume K Forecast, by Country 2020 & 2033
- Table 37: United Kingdom Recycled Paper Countertops Revenue (million) Forecast, by Application 2020 & 2033
- Table 38: United Kingdom Recycled Paper Countertops Volume (K) Forecast, by Application 2020 & 2033
- Table 39: Germany Recycled Paper Countertops Revenue (million) Forecast, by Application 2020 & 2033
- Table 40: Germany Recycled Paper Countertops Volume (K) Forecast, by Application 2020 & 2033
- Table 41: France Recycled Paper Countertops Revenue (million) Forecast, by Application 2020 & 2033
- Table 42: France Recycled Paper Countertops Volume (K) Forecast, by Application 2020 & 2033
- Table 43: Italy Recycled Paper Countertops Revenue (million) Forecast, by Application 2020 & 2033
- Table 44: Italy Recycled Paper Countertops Volume (K) Forecast, by Application 2020 & 2033
- Table 45: Spain Recycled Paper Countertops Revenue (million) Forecast, by Application 2020 & 2033
- Table 46: Spain Recycled Paper Countertops Volume (K) Forecast, by Application 2020 & 2033
- Table 47: Russia Recycled Paper Countertops Revenue (million) Forecast, by Application 2020 & 2033
- Table 48: Russia Recycled Paper Countertops Volume (K) Forecast, by Application 2020 & 2033
- Table 49: Benelux Recycled Paper Countertops Revenue (million) Forecast, by Application 2020 & 2033
- Table 50: Benelux Recycled Paper Countertops Volume (K) Forecast, by Application 2020 & 2033
- Table 51: Nordics Recycled Paper Countertops Revenue (million) Forecast, by Application 2020 & 2033
- Table 52: Nordics Recycled Paper Countertops Volume (K) Forecast, by Application 2020 & 2033
- Table 53: Rest of Europe Recycled Paper Countertops Revenue (million) Forecast, by Application 2020 & 2033
- Table 54: Rest of Europe Recycled Paper Countertops Volume (K) Forecast, by Application 2020 & 2033
- Table 55: Global Recycled Paper Countertops Revenue million Forecast, by Application 2020 & 2033
- Table 56: Global Recycled Paper Countertops Volume K Forecast, by Application 2020 & 2033
- Table 57: Global Recycled Paper Countertops Revenue million Forecast, by Types 2020 & 2033
- Table 58: Global Recycled Paper Countertops Volume K Forecast, by Types 2020 & 2033
- Table 59: Global Recycled Paper Countertops Revenue million Forecast, by Country 2020 & 2033
- Table 60: Global Recycled Paper Countertops Volume K Forecast, by Country 2020 & 2033
- Table 61: Turkey Recycled Paper Countertops Revenue (million) Forecast, by Application 2020 & 2033
- Table 62: Turkey Recycled Paper Countertops Volume (K) Forecast, by Application 2020 & 2033
- Table 63: Israel Recycled Paper Countertops Revenue (million) Forecast, by Application 2020 & 2033
- Table 64: Israel Recycled Paper Countertops Volume (K) Forecast, by Application 2020 & 2033
- Table 65: GCC Recycled Paper Countertops Revenue (million) Forecast, by Application 2020 & 2033
- Table 66: GCC Recycled Paper Countertops Volume (K) Forecast, by Application 2020 & 2033
- Table 67: North Africa Recycled Paper Countertops Revenue (million) Forecast, by Application 2020 & 2033
- Table 68: North Africa Recycled Paper Countertops Volume (K) Forecast, by Application 2020 & 2033
- Table 69: South Africa Recycled Paper Countertops Revenue (million) Forecast, by Application 2020 & 2033
- Table 70: South Africa Recycled Paper Countertops Volume (K) Forecast, by Application 2020 & 2033
- Table 71: Rest of Middle East & Africa Recycled Paper Countertops Revenue (million) Forecast, by Application 2020 & 2033
- Table 72: Rest of Middle East & Africa Recycled Paper Countertops Volume (K) Forecast, by Application 2020 & 2033
- Table 73: Global Recycled Paper Countertops Revenue million Forecast, by Application 2020 & 2033
- Table 74: Global Recycled Paper Countertops Volume K Forecast, by Application 2020 & 2033
- Table 75: Global Recycled Paper Countertops Revenue million Forecast, by Types 2020 & 2033
- Table 76: Global Recycled Paper Countertops Volume K Forecast, by Types 2020 & 2033
- Table 77: Global Recycled Paper Countertops Revenue million Forecast, by Country 2020 & 2033
- Table 78: Global Recycled Paper Countertops Volume K Forecast, by Country 2020 & 2033
- Table 79: China Recycled Paper Countertops Revenue (million) Forecast, by Application 2020 & 2033
- Table 80: China Recycled Paper Countertops Volume (K) Forecast, by Application 2020 & 2033
- Table 81: India Recycled Paper Countertops Revenue (million) Forecast, by Application 2020 & 2033
- Table 82: India Recycled Paper Countertops Volume (K) Forecast, by Application 2020 & 2033
- Table 83: Japan Recycled Paper Countertops Revenue (million) Forecast, by Application 2020 & 2033
- Table 84: Japan Recycled Paper Countertops Volume (K) Forecast, by Application 2020 & 2033
- Table 85: South Korea Recycled Paper Countertops Revenue (million) Forecast, by Application 2020 & 2033
- Table 86: South Korea Recycled Paper Countertops Volume (K) Forecast, by Application 2020 & 2033
- Table 87: ASEAN Recycled Paper Countertops Revenue (million) Forecast, by Application 2020 & 2033
- Table 88: ASEAN Recycled Paper Countertops Volume (K) Forecast, by Application 2020 & 2033
- Table 89: Oceania Recycled Paper Countertops Revenue (million) Forecast, by Application 2020 & 2033
- Table 90: Oceania Recycled Paper Countertops Volume (K) Forecast, by Application 2020 & 2033
- Table 91: Rest of Asia Pacific Recycled Paper Countertops Revenue (million) Forecast, by Application 2020 & 2033
- Table 92: Rest of Asia Pacific Recycled Paper Countertops Volume (K) Forecast, by Application 2020 & 2033
Frequently Asked Questions
1. What is the projected Compound Annual Growth Rate (CAGR) of the Recycled Paper Countertops?
The projected CAGR is approximately 6%.
2. Which companies are prominent players in the Recycled Paper Countertops?
Key companies in the market include RichLite, PaperStone, Xanita, Eastern, ATL Compositess.
3. What are the main segments of the Recycled Paper Countertops?
The market segments include Application, Types.
4. Can you provide details about the market size?
The market size is estimated to be USD 474 million as of 2022.
5. What are some drivers contributing to market growth?
N/A
6. What are the notable trends driving market growth?
N/A
7. Are there any restraints impacting market growth?
N/A
8. Can you provide examples of recent developments in the market?
N/A
9. What pricing options are available for accessing the report?
Pricing options include single-user, multi-user, and enterprise licenses priced at USD 3950.00, USD 5925.00, and USD 7900.00 respectively.
10. Is the market size provided in terms of value or volume?
The market size is provided in terms of value, measured in million and volume, measured in K.
11. Are there any specific market keywords associated with the report?
Yes, the market keyword associated with the report is "Recycled Paper Countertops," which aids in identifying and referencing the specific market segment covered.
12. How do I determine which pricing option suits my needs best?
The pricing options vary based on user requirements and access needs. Individual users may opt for single-user licenses, while businesses requiring broader access may choose multi-user or enterprise licenses for cost-effective access to the report.
13. Are there any additional resources or data provided in the Recycled Paper Countertops report?
While the report offers comprehensive insights, it's advisable to review the specific contents or supplementary materials provided to ascertain if additional resources or data are available.
14. How can I stay updated on further developments or reports in the Recycled Paper Countertops?
To stay informed about further developments, trends, and reports in the Recycled Paper Countertops, consider subscribing to industry newsletters, following relevant companies and organizations, or regularly checking reputable industry news sources and publications.
Methodology
Step 1 - Identification of Relevant Samples Size from Population Database


Step 2 - Approaches for Defining Global Market Size (Value, Volume* & Price*)

Note*: In applicable scenarios
Step 3 - Data Sources
Primary Research
- Web Analytics
- Survey Reports
- Research Institute
- Latest Research Reports
- Opinion Leaders
Secondary Research
- Annual Reports
- White Paper
- Latest Press Release
- Industry Association
- Paid Database
- Investor Presentations

Step 4 - Data Triangulation
Involves using different sources of information in order to increase the validity of a study
These sources are likely to be stakeholders in a program - participants, other researchers, program staff, other community members, and so on.
Then we put all data in single framework & apply various statistical tools to find out the dynamic on the market.
During the analysis stage, feedback from the stakeholder groups would be compared to determine areas of agreement as well as areas of divergence