

Key Insights
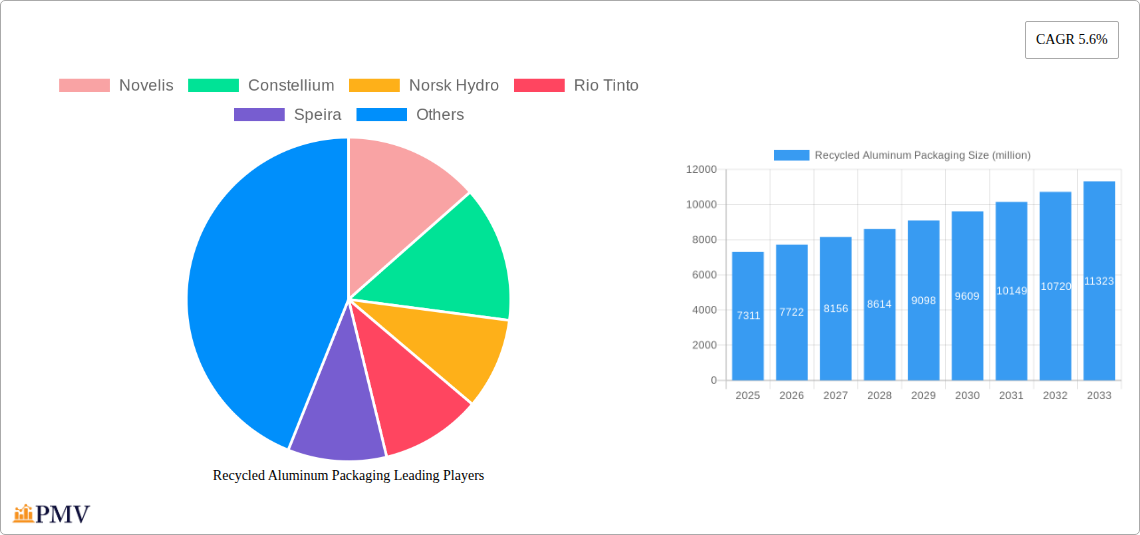
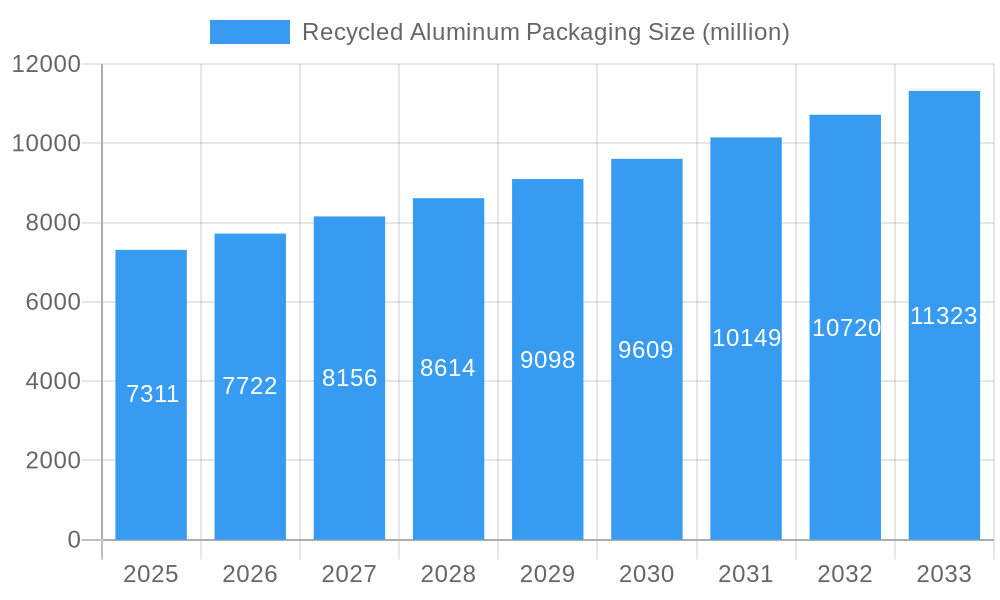
The global recycled aluminum packaging market is poised for significant expansion, projected to reach an estimated value of USD 7311 million by 2025, driven by a robust Compound Annual Growth Rate (CAGR) of 5.6% throughout the forecast period of 2025-2033. This substantial growth is primarily fueled by an increasing global emphasis on sustainability and the circular economy, leading to a higher demand for eco-friendly packaging solutions. Recycled aluminum's inherent recyclability and lower environmental footprint compared to virgin aluminum make it an attractive choice for manufacturers across various sectors. The Food & Beverages segment is expected to dominate the market due to the widespread use of aluminum cans and containers for preserving food quality and extending shelf life. Similarly, the Pharmaceuticals sector's reliance on sterile, durable, and tamper-evident packaging further bolsters demand for recycled aluminum. The Personal Care & Cosmetics industry also contributes significantly, driven by consumer preference for premium and sustainable product packaging.
Recycled Aluminum Packaging Market Size (In Billion)
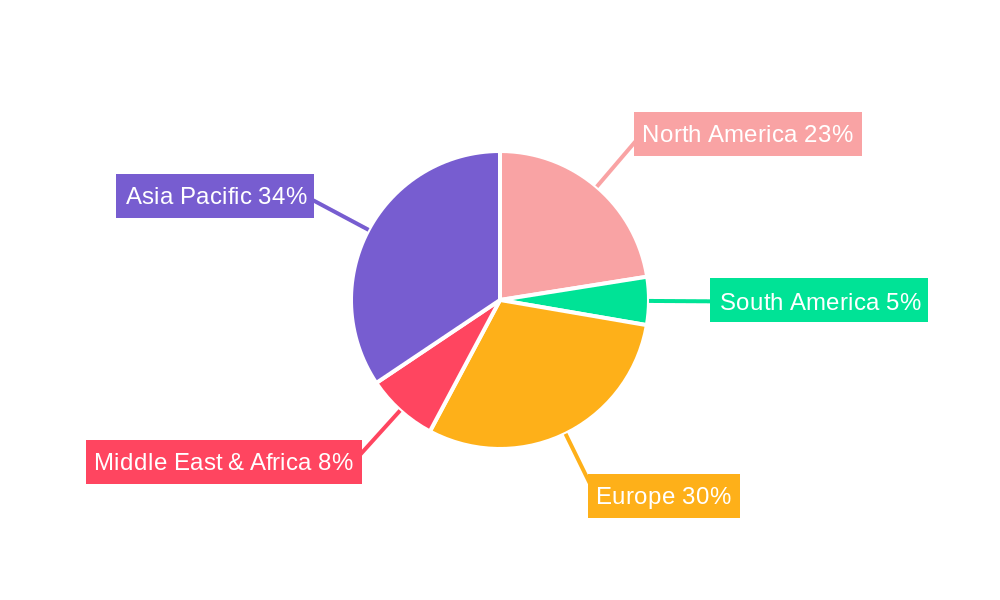
Key market drivers include stringent government regulations promoting recycling and waste reduction, coupled with growing consumer awareness and demand for sustainable products. Innovations in recycling technologies and improved collection infrastructure are enhancing the availability and cost-effectiveness of recycled aluminum. The market is segmented by application and type, with Bags & Pouches and Cans & Bottles being prominent types, while Laminated Tubes also present a growing niche. Geographically, the Asia Pacific region, led by China and India, is anticipated to emerge as a high-growth market due to rapid industrialization, increasing disposable incomes, and a burgeoning middle class adopting sustainable consumption patterns. Europe and North America, with their established recycling frameworks and strong consumer inclination towards eco-conscious choices, will continue to be significant markets. Restraints such as fluctuating raw material prices and the initial investment costs for advanced recycling facilities may pose challenges, but the overarching trend towards sustainability is expected to outweigh these limitations.
Recycled Aluminum Packaging Company Market Share
This in-depth report provides a thorough analysis of the global Recycled Aluminum Packaging market, encompassing market structure, competitive dynamics, industry trends, segment-specific insights, product innovations, key drivers, challenges, leading players, crucial developments, and a strategic outlook. With a study period spanning from 2019 to 2033, a base year of 2025, and a forecast period of 2025–2033, this report leverages historical data (2019–2024) to offer predictive insights. It is essential for industry stakeholders, investors, and manufacturers seeking to understand the evolving landscape of sustainable aluminum packaging solutions.
Recycled Aluminum Packaging Market Structure & Competitive Dynamics
The Recycled Aluminum Packaging market is characterized by a dynamic and evolving competitive landscape. Market concentration is moderate, with several key global players and a growing number of regional manufacturers. Innovation ecosystems are robust, driven by the increasing demand for sustainable packaging materials and advancements in recycling technologies. Regulatory frameworks globally are increasingly favoring recycled content, impacting market entry and operational strategies. Product substitutes, such as plastics and glass, pose a competitive challenge, but the superior recyclability and sustainability profile of aluminum are gaining traction. End-user trends are shifting towards eco-conscious consumption, directly fueling the demand for recycled aluminum packaging. Mergers & Acquisitions (M&A) activities play a significant role in market consolidation and expansion. For instance, M&A deal values in the sector are projected to reach approximately $5,000 million within the forecast period, indicating strategic consolidation and investment. Key companies like Novelis and Ball Corporation hold substantial market share, estimated at over 15% and 12% respectively, demonstrating their leadership in this segment.
- Market Concentration: Moderate, with a mix of global giants and emerging regional players.
- Innovation Ecosystems: Driven by sustainability goals and technological advancements in recycling.
- Regulatory Frameworks: Favorable policies promoting recycled content are a significant influence.
- Product Substitutes: Plastics and glass remain competitive, but aluminum's recyclability is a key differentiator.
- End-User Trends: Growing consumer preference for sustainable and environmentally friendly packaging.
- M&A Activities: Strategic consolidations and expansions are shaping the market structure, with projected deal values around $5,000 million.
Recycled Aluminum Packaging Industry Trends & Insights
The Recycled Aluminum Packaging industry is experiencing significant growth, propelled by a confluence of factors. A primary growth driver is the escalating global focus on environmental sustainability and the circular economy. Governments worldwide are implementing stringent regulations and offering incentives to boost the use of recycled materials, thereby creating a more favorable market environment for recycled aluminum packaging. For example, Extended Producer Responsibility (EPR) schemes are becoming more prevalent, pushing manufacturers to incorporate higher percentages of recycled content. Technological disruptions are also playing a crucial role, with ongoing advancements in aluminum recycling processes leading to improved efficiency, reduced energy consumption, and enhanced material quality. These innovations are making recycled aluminum a more cost-effective and high-performance alternative to virgin aluminum and other packaging materials.
Consumer preferences are rapidly evolving, with a marked increase in demand for products packaged in sustainable materials. Shoppers are increasingly making purchasing decisions based on a brand's environmental footprint, compelling companies to adopt eco-friendly packaging solutions. This consumer-led demand is a powerful catalyst for the adoption of recycled aluminum packaging across various sectors. Competitive dynamics are intensifying, with companies investing heavily in R&D to develop innovative and sustainable packaging solutions. Strategic partnerships and collaborations are becoming more common as companies aim to strengthen their supply chains and expand their market reach. The market penetration of recycled aluminum packaging is projected to reach 45% by 2033, up from 28% in the historical period, showcasing substantial growth. The Compound Annual Growth Rate (CAGR) for the Recycled Aluminum Packaging market is estimated at 7.2% during the forecast period. This growth is further bolstered by initiatives like the development of lightweight yet robust aluminum packaging solutions that reduce transportation emissions and enhance product shelf life. The increasing adoption of advanced sorting and recycling technologies is also contributing to a higher recovery rate of aluminum, making it a more sustainable and economically viable choice.
Dominant Markets & Segments in Recycled Aluminum Packaging
The Recycled Aluminum Packaging market demonstrates significant regional and segment-specific dominance, driven by a combination of economic policies, infrastructure development, and consumer behavior.
Regionally: North America and Europe currently hold dominant positions in the recycled aluminum packaging market. This dominance is attributed to:
- Strong Regulatory Push: Aggressive environmental policies, carbon footprint reduction targets, and incentives for using recycled materials in these regions. For example, the EU's Circular Economy Action Plan heavily influences packaging directives.
- Developed Recycling Infrastructure: Mature and efficient collection, sorting, and recycling facilities ensure a consistent supply of high-quality recycled aluminum.
- High Consumer Awareness: A well-informed consumer base actively seeks out sustainable products, driving demand for recycled packaging.
- Established Industry Presence: Key players like Novelis and Ball Corporation have a significant manufacturing and distribution footprint in these regions.
Application Segments:
- Food & Beverages: This is the largest and most dominant application segment for recycled aluminum packaging.
- Key Drivers:
- Consumer Preference: Strong consumer trust in aluminum for food safety and freshness.
- Brand Image: Companies leverage sustainable packaging to enhance their brand's eco-friendly image.
- Recyclability: High recyclability rates of aluminum cans and containers align with sustainability goals.
- Barrier Properties: Excellent barrier properties against light, oxygen, and moisture, crucial for preserving food and beverage quality.
- Market Size: Projected to account for approximately 60% of the total market revenue by 2033.
- Key Drivers:
- Pharmaceuticals: This segment is experiencing rapid growth, driven by stringent regulatory requirements and the need for secure, high-barrier packaging.
- Key Drivers:
- Product Integrity: Aluminum's inert nature and excellent barrier properties are critical for drug stability and safety.
- Tamper-Evident Features: Aluminum packaging readily incorporates tamper-evident seals.
- Sustainability Mandates: Increasing pressure to adopt greener packaging solutions within the pharmaceutical industry.
- Market Size: Expected to grow at a CAGR of 8.5% during the forecast period.
- Key Drivers:
- Personal Care & Cosmetics: This segment is influenced by aesthetic appeal and consumer demand for sustainable luxury.
- Key Drivers:
- Premium Appeal: Aluminum offers a premium and modern aesthetic for cosmetic products.
- Lightweighting: Reduced product weight contributes to lower shipping costs and environmental impact.
- Brand Differentiation: Sustainable packaging serves as a key differentiator in a crowded market.
- Key Drivers:
- Other Applications: This segment includes various industrial and niche applications where recycled aluminum packaging offers specific advantages.
Type Segments:
- Cans & Bottles: This is the dominant type, particularly for the Food & Beverages segment.
- Key Drivers:
- High Recyclability: Aluminum cans have an exceptionally high recycling rate globally.
- Consumer Familiarity: Widespread consumer acceptance and preference for aluminum cans.
- Cost-Effectiveness: Efficient production processes and high scrap value contribute to cost competitiveness.
- Market Dominance: Expected to hold over 55% of the market share by volume.
- Key Drivers:
- Bags & Pouches: Growing in popularity for flexible packaging solutions, driven by convenience and lightweighting.
- Laminated Tubes: Increasingly adopted for personal care and pharmaceutical products due to their protective qualities and design flexibility.
Recycled Aluminum Packaging Product Innovations
Recent product innovations in Recycled Aluminum Packaging focus on enhancing sustainability, functionality, and consumer appeal. Advancements in lightweighting technologies have led to thinner yet stronger aluminum packaging, reducing material consumption and transportation emissions. Development of advanced barrier coatings for aluminum cans and containers improves product shelf-life and prevents spoilage, particularly for food and beverages. Furthermore, innovations in decorative printing and finishing techniques allow for aesthetically pleasing designs, aligning with the premium appeal sought in personal care and cosmetics. The incorporation of smart features, such as QR codes for traceability and consumer engagement, is also emerging. These innovations aim to maximize recyclability while minimizing the environmental footprint throughout the product lifecycle, offering a competitive advantage to manufacturers.
Report Segmentation & Scope
This report segments the Recycled Aluminum Packaging market by Application and Type.
Application Segments:
- Food & Beverages: This segment, projected to be worth $40,000 million by 2033, encompasses a wide range of food and drink products utilizing aluminum cans, trays, and flexible packaging. Its dominance is driven by high demand for preservation and consumer preference.
- Pharmaceuticals: Valued at $15,000 million by 2033, this segment includes aluminum packaging for medicines, medical devices, and healthcare products, emphasizing product integrity and safety.
- Personal Care & Cosmetics: Expected to reach $12,000 million by 2033, this segment covers aluminum packaging for beauty products, fragrances, and toiletries, driven by aesthetics and sustainability trends.
- Other: This segment, estimated at $8,000 million by 2033, includes various industrial and specialty applications.
Type Segments:
- Cans & Bottles: This segment is projected to be the largest, valued at $55,000 million by 2033, due to its widespread use in beverages and its high recyclability.
- Bags & Pouches: Expected to grow significantly, reaching $12,000 million by 2033, driven by the demand for flexible and lightweight packaging solutions.
- Laminated Tubes: Valued at $10,000 million by 2033, this segment is popular for personal care and pharmaceutical products.
- Other: This segment, estimated at $5,000 million by 2033, includes various other forms of recycled aluminum packaging.
Key Drivers of Recycled Aluminum Packaging Growth
The growth of the Recycled Aluminum Packaging market is propelled by several critical factors. The most significant driver is the increasing global emphasis on sustainability and the circular economy, pushing industries to adopt environmentally friendly materials and reduce waste. Favorable government regulations and policies, such as mandates for recycled content and carbon emission reduction targets, actively encourage the use of recycled aluminum. Technological advancements in recycling efficiency and material science are making recycled aluminum more cost-effective, versatile, and high-performing. Furthermore, rising consumer awareness and preference for eco-conscious products are compelling brands to invest in sustainable packaging solutions, creating a strong market pull. The inherent superior recyclability and infinite recyclability of aluminum, coupled with its excellent barrier properties, also contribute significantly to its adoption.
Challenges in the Recycled Aluminum Packaging Sector
Despite its growth, the Recycled Aluminum Packaging sector faces several challenges. Fluctuations in the price of recycled aluminum can impact production costs and market competitiveness. Supply chain disruptions, including inconsistencies in the availability of high-quality recycled feedstock, can pose a restraint. Competition from alternative packaging materials, particularly plastics, remains a significant challenge, especially in price-sensitive markets. Energy-intensive recycling processes, although improving, still present an environmental consideration. Additionally, evolving regulatory landscapes and varying recycling infrastructure across different regions can create operational complexities for global manufacturers. The initial investment required for advanced recycling technologies can also be a barrier for smaller players.
Leading Players in the Recycled Aluminum Packaging Market
- Novelis
- Constellium
- Norsk Hydro
- Rio Tinto
- Speira
- AMAG Austria Metall AG
- Ball Corporation
- TRIMET Aluminium
- Rusal
- Arconic
Key Developments in Recycled Aluminum Packaging Sector
- 2023: Ball Corporation launched a new initiative to increase the recycled content in its beverage cans to 75% by 2030.
- 2023: Novelis announced a significant investment in its recycling facilities to enhance capacity for post-consumer recycled aluminum.
- 2022: Constellium expanded its portfolio of high-recycled-content aluminum alloys for packaging applications.
- 2022: Speira inaugurated a new aluminum rolling mill with a focus on sustainable production and recycled materials.
- 2021: Norsk Hydro increased its target for recycled aluminum content across its product lines.
- 2021: Arconic introduced innovative aluminum solutions for the pharmaceutical packaging sector, emphasizing recyclability.
- 2020: Rio Tinto invested in advanced sorting technologies to improve the recovery of aluminum from waste streams.
- 2020: TRIMET Aluminium expanded its recycling operations to meet growing demand for sustainable aluminum.
Strategic Recycled Aluminum Packaging Market Outlook
The strategic outlook for the Recycled Aluminum Packaging market is overwhelmingly positive, driven by robust growth accelerators. The increasing global commitment to net-zero emissions and circular economy principles will continue to propel demand for sustainable packaging solutions. Innovations in lightweighting and advanced barrier technologies will further enhance the competitiveness of aluminum against other materials, particularly in the food & beverage and pharmaceutical sectors. Strategic partnerships and vertical integration along the recycling value chain are expected to become more prevalent, ensuring stable supply and efficient processing. The market is poised for significant expansion as more companies align their sustainability goals with their packaging strategies, creating substantial opportunities for innovation and investment. The market's future is intrinsically linked to its ability to offer high-performance, cost-effective, and demonstrably sustainable packaging solutions.
Recycled Aluminum Packaging Segmentation
-
1. Application
- 1.1. Food & Beverages
- 1.2. Pharmaceuticals
- 1.3. Personal Care & Cosmetics
- 1.4. Other
-
2. Types
- 2.1. Bags & Pouches
- 2.2. Cans & Bottles
- 2.3. Laminated Tubes
- 2.4. Other
Recycled Aluminum Packaging Segmentation By Geography
-
1. North America
- 1.1. United States
- 1.2. Canada
- 1.3. Mexico
-
2. South America
- 2.1. Brazil
- 2.2. Argentina
- 2.3. Rest of South America
-
3. Europe
- 3.1. United Kingdom
- 3.2. Germany
- 3.3. France
- 3.4. Italy
- 3.5. Spain
- 3.6. Russia
- 3.7. Benelux
- 3.8. Nordics
- 3.9. Rest of Europe
-
4. Middle East & Africa
- 4.1. Turkey
- 4.2. Israel
- 4.3. GCC
- 4.4. North Africa
- 4.5. South Africa
- 4.6. Rest of Middle East & Africa
-
5. Asia Pacific
- 5.1. China
- 5.2. India
- 5.3. Japan
- 5.4. South Korea
- 5.5. ASEAN
- 5.6. Oceania
- 5.7. Rest of Asia Pacific
Recycled Aluminum Packaging Regional Market Share
Geographic Coverage of Recycled Aluminum Packaging
Recycled Aluminum Packaging REPORT HIGHLIGHTS
| Aspects | Details |
|---|---|
| Study Period | 2020-2034 |
| Base Year | 2025 |
| Estimated Year | 2026 |
| Forecast Period | 2026-2034 |
| Historical Period | 2020-2025 |
| Growth Rate | CAGR of 5.6% from 2020-2034 |
| Segmentation |
|
Table of Contents
- 1. Introduction
- 1.1. Research Scope
- 1.2. Market Segmentation
- 1.3. Research Methodology
- 1.4. Definitions and Assumptions
- 2. Executive Summary
- 2.1. Introduction
- 3. Market Dynamics
- 3.1. Introduction
- 3.2. Market Drivers
- 3.3. Market Restrains
- 3.4. Market Trends
- 4. Market Factor Analysis
- 4.1. Porters Five Forces
- 4.2. Supply/Value Chain
- 4.3. PESTEL analysis
- 4.4. Market Entropy
- 4.5. Patent/Trademark Analysis
- 5. Global Recycled Aluminum Packaging Analysis, Insights and Forecast, 2020-2032
- 5.1. Market Analysis, Insights and Forecast - by Application
- 5.1.1. Food & Beverages
- 5.1.2. Pharmaceuticals
- 5.1.3. Personal Care & Cosmetics
- 5.1.4. Other
- 5.2. Market Analysis, Insights and Forecast - by Types
- 5.2.1. Bags & Pouches
- 5.2.2. Cans & Bottles
- 5.2.3. Laminated Tubes
- 5.2.4. Other
- 5.3. Market Analysis, Insights and Forecast - by Region
- 5.3.1. North America
- 5.3.2. South America
- 5.3.3. Europe
- 5.3.4. Middle East & Africa
- 5.3.5. Asia Pacific
- 5.1. Market Analysis, Insights and Forecast - by Application
- 6. North America Recycled Aluminum Packaging Analysis, Insights and Forecast, 2020-2032
- 6.1. Market Analysis, Insights and Forecast - by Application
- 6.1.1. Food & Beverages
- 6.1.2. Pharmaceuticals
- 6.1.3. Personal Care & Cosmetics
- 6.1.4. Other
- 6.2. Market Analysis, Insights and Forecast - by Types
- 6.2.1. Bags & Pouches
- 6.2.2. Cans & Bottles
- 6.2.3. Laminated Tubes
- 6.2.4. Other
- 6.1. Market Analysis, Insights and Forecast - by Application
- 7. South America Recycled Aluminum Packaging Analysis, Insights and Forecast, 2020-2032
- 7.1. Market Analysis, Insights and Forecast - by Application
- 7.1.1. Food & Beverages
- 7.1.2. Pharmaceuticals
- 7.1.3. Personal Care & Cosmetics
- 7.1.4. Other
- 7.2. Market Analysis, Insights and Forecast - by Types
- 7.2.1. Bags & Pouches
- 7.2.2. Cans & Bottles
- 7.2.3. Laminated Tubes
- 7.2.4. Other
- 7.1. Market Analysis, Insights and Forecast - by Application
- 8. Europe Recycled Aluminum Packaging Analysis, Insights and Forecast, 2020-2032
- 8.1. Market Analysis, Insights and Forecast - by Application
- 8.1.1. Food & Beverages
- 8.1.2. Pharmaceuticals
- 8.1.3. Personal Care & Cosmetics
- 8.1.4. Other
- 8.2. Market Analysis, Insights and Forecast - by Types
- 8.2.1. Bags & Pouches
- 8.2.2. Cans & Bottles
- 8.2.3. Laminated Tubes
- 8.2.4. Other
- 8.1. Market Analysis, Insights and Forecast - by Application
- 9. Middle East & Africa Recycled Aluminum Packaging Analysis, Insights and Forecast, 2020-2032
- 9.1. Market Analysis, Insights and Forecast - by Application
- 9.1.1. Food & Beverages
- 9.1.2. Pharmaceuticals
- 9.1.3. Personal Care & Cosmetics
- 9.1.4. Other
- 9.2. Market Analysis, Insights and Forecast - by Types
- 9.2.1. Bags & Pouches
- 9.2.2. Cans & Bottles
- 9.2.3. Laminated Tubes
- 9.2.4. Other
- 9.1. Market Analysis, Insights and Forecast - by Application
- 10. Asia Pacific Recycled Aluminum Packaging Analysis, Insights and Forecast, 2020-2032
- 10.1. Market Analysis, Insights and Forecast - by Application
- 10.1.1. Food & Beverages
- 10.1.2. Pharmaceuticals
- 10.1.3. Personal Care & Cosmetics
- 10.1.4. Other
- 10.2. Market Analysis, Insights and Forecast - by Types
- 10.2.1. Bags & Pouches
- 10.2.2. Cans & Bottles
- 10.2.3. Laminated Tubes
- 10.2.4. Other
- 10.1. Market Analysis, Insights and Forecast - by Application
- 11. Competitive Analysis
- 11.1. Global Market Share Analysis 2025
- 11.2. Company Profiles
- 11.2.1 Novelis
- 11.2.1.1. Overview
- 11.2.1.2. Products
- 11.2.1.3. SWOT Analysis
- 11.2.1.4. Recent Developments
- 11.2.1.5. Financials (Based on Availability)
- 11.2.2 Constellium
- 11.2.2.1. Overview
- 11.2.2.2. Products
- 11.2.2.3. SWOT Analysis
- 11.2.2.4. Recent Developments
- 11.2.2.5. Financials (Based on Availability)
- 11.2.3 Norsk Hydro
- 11.2.3.1. Overview
- 11.2.3.2. Products
- 11.2.3.3. SWOT Analysis
- 11.2.3.4. Recent Developments
- 11.2.3.5. Financials (Based on Availability)
- 11.2.4 Rio Tinto
- 11.2.4.1. Overview
- 11.2.4.2. Products
- 11.2.4.3. SWOT Analysis
- 11.2.4.4. Recent Developments
- 11.2.4.5. Financials (Based on Availability)
- 11.2.5 Speira
- 11.2.5.1. Overview
- 11.2.5.2. Products
- 11.2.5.3. SWOT Analysis
- 11.2.5.4. Recent Developments
- 11.2.5.5. Financials (Based on Availability)
- 11.2.6 AMAG Austria Metall AG
- 11.2.6.1. Overview
- 11.2.6.2. Products
- 11.2.6.3. SWOT Analysis
- 11.2.6.4. Recent Developments
- 11.2.6.5. Financials (Based on Availability)
- 11.2.7 Ball Corporation
- 11.2.7.1. Overview
- 11.2.7.2. Products
- 11.2.7.3. SWOT Analysis
- 11.2.7.4. Recent Developments
- 11.2.7.5. Financials (Based on Availability)
- 11.2.8 TRIMET Aluminium
- 11.2.8.1. Overview
- 11.2.8.2. Products
- 11.2.8.3. SWOT Analysis
- 11.2.8.4. Recent Developments
- 11.2.8.5. Financials (Based on Availability)
- 11.2.9 Rusal
- 11.2.9.1. Overview
- 11.2.9.2. Products
- 11.2.9.3. SWOT Analysis
- 11.2.9.4. Recent Developments
- 11.2.9.5. Financials (Based on Availability)
- 11.2.10 Arconic
- 11.2.10.1. Overview
- 11.2.10.2. Products
- 11.2.10.3. SWOT Analysis
- 11.2.10.4. Recent Developments
- 11.2.10.5. Financials (Based on Availability)
- 11.2.1 Novelis
List of Figures
- Figure 1: Global Recycled Aluminum Packaging Revenue Breakdown (million, %) by Region 2025 & 2033
- Figure 2: North America Recycled Aluminum Packaging Revenue (million), by Application 2025 & 2033
- Figure 3: North America Recycled Aluminum Packaging Revenue Share (%), by Application 2025 & 2033
- Figure 4: North America Recycled Aluminum Packaging Revenue (million), by Types 2025 & 2033
- Figure 5: North America Recycled Aluminum Packaging Revenue Share (%), by Types 2025 & 2033
- Figure 6: North America Recycled Aluminum Packaging Revenue (million), by Country 2025 & 2033
- Figure 7: North America Recycled Aluminum Packaging Revenue Share (%), by Country 2025 & 2033
- Figure 8: South America Recycled Aluminum Packaging Revenue (million), by Application 2025 & 2033
- Figure 9: South America Recycled Aluminum Packaging Revenue Share (%), by Application 2025 & 2033
- Figure 10: South America Recycled Aluminum Packaging Revenue (million), by Types 2025 & 2033
- Figure 11: South America Recycled Aluminum Packaging Revenue Share (%), by Types 2025 & 2033
- Figure 12: South America Recycled Aluminum Packaging Revenue (million), by Country 2025 & 2033
- Figure 13: South America Recycled Aluminum Packaging Revenue Share (%), by Country 2025 & 2033
- Figure 14: Europe Recycled Aluminum Packaging Revenue (million), by Application 2025 & 2033
- Figure 15: Europe Recycled Aluminum Packaging Revenue Share (%), by Application 2025 & 2033
- Figure 16: Europe Recycled Aluminum Packaging Revenue (million), by Types 2025 & 2033
- Figure 17: Europe Recycled Aluminum Packaging Revenue Share (%), by Types 2025 & 2033
- Figure 18: Europe Recycled Aluminum Packaging Revenue (million), by Country 2025 & 2033
- Figure 19: Europe Recycled Aluminum Packaging Revenue Share (%), by Country 2025 & 2033
- Figure 20: Middle East & Africa Recycled Aluminum Packaging Revenue (million), by Application 2025 & 2033
- Figure 21: Middle East & Africa Recycled Aluminum Packaging Revenue Share (%), by Application 2025 & 2033
- Figure 22: Middle East & Africa Recycled Aluminum Packaging Revenue (million), by Types 2025 & 2033
- Figure 23: Middle East & Africa Recycled Aluminum Packaging Revenue Share (%), by Types 2025 & 2033
- Figure 24: Middle East & Africa Recycled Aluminum Packaging Revenue (million), by Country 2025 & 2033
- Figure 25: Middle East & Africa Recycled Aluminum Packaging Revenue Share (%), by Country 2025 & 2033
- Figure 26: Asia Pacific Recycled Aluminum Packaging Revenue (million), by Application 2025 & 2033
- Figure 27: Asia Pacific Recycled Aluminum Packaging Revenue Share (%), by Application 2025 & 2033
- Figure 28: Asia Pacific Recycled Aluminum Packaging Revenue (million), by Types 2025 & 2033
- Figure 29: Asia Pacific Recycled Aluminum Packaging Revenue Share (%), by Types 2025 & 2033
- Figure 30: Asia Pacific Recycled Aluminum Packaging Revenue (million), by Country 2025 & 2033
- Figure 31: Asia Pacific Recycled Aluminum Packaging Revenue Share (%), by Country 2025 & 2033
List of Tables
- Table 1: Global Recycled Aluminum Packaging Revenue million Forecast, by Application 2020 & 2033
- Table 2: Global Recycled Aluminum Packaging Revenue million Forecast, by Types 2020 & 2033
- Table 3: Global Recycled Aluminum Packaging Revenue million Forecast, by Region 2020 & 2033
- Table 4: Global Recycled Aluminum Packaging Revenue million Forecast, by Application 2020 & 2033
- Table 5: Global Recycled Aluminum Packaging Revenue million Forecast, by Types 2020 & 2033
- Table 6: Global Recycled Aluminum Packaging Revenue million Forecast, by Country 2020 & 2033
- Table 7: United States Recycled Aluminum Packaging Revenue (million) Forecast, by Application 2020 & 2033
- Table 8: Canada Recycled Aluminum Packaging Revenue (million) Forecast, by Application 2020 & 2033
- Table 9: Mexico Recycled Aluminum Packaging Revenue (million) Forecast, by Application 2020 & 2033
- Table 10: Global Recycled Aluminum Packaging Revenue million Forecast, by Application 2020 & 2033
- Table 11: Global Recycled Aluminum Packaging Revenue million Forecast, by Types 2020 & 2033
- Table 12: Global Recycled Aluminum Packaging Revenue million Forecast, by Country 2020 & 2033
- Table 13: Brazil Recycled Aluminum Packaging Revenue (million) Forecast, by Application 2020 & 2033
- Table 14: Argentina Recycled Aluminum Packaging Revenue (million) Forecast, by Application 2020 & 2033
- Table 15: Rest of South America Recycled Aluminum Packaging Revenue (million) Forecast, by Application 2020 & 2033
- Table 16: Global Recycled Aluminum Packaging Revenue million Forecast, by Application 2020 & 2033
- Table 17: Global Recycled Aluminum Packaging Revenue million Forecast, by Types 2020 & 2033
- Table 18: Global Recycled Aluminum Packaging Revenue million Forecast, by Country 2020 & 2033
- Table 19: United Kingdom Recycled Aluminum Packaging Revenue (million) Forecast, by Application 2020 & 2033
- Table 20: Germany Recycled Aluminum Packaging Revenue (million) Forecast, by Application 2020 & 2033
- Table 21: France Recycled Aluminum Packaging Revenue (million) Forecast, by Application 2020 & 2033
- Table 22: Italy Recycled Aluminum Packaging Revenue (million) Forecast, by Application 2020 & 2033
- Table 23: Spain Recycled Aluminum Packaging Revenue (million) Forecast, by Application 2020 & 2033
- Table 24: Russia Recycled Aluminum Packaging Revenue (million) Forecast, by Application 2020 & 2033
- Table 25: Benelux Recycled Aluminum Packaging Revenue (million) Forecast, by Application 2020 & 2033
- Table 26: Nordics Recycled Aluminum Packaging Revenue (million) Forecast, by Application 2020 & 2033
- Table 27: Rest of Europe Recycled Aluminum Packaging Revenue (million) Forecast, by Application 2020 & 2033
- Table 28: Global Recycled Aluminum Packaging Revenue million Forecast, by Application 2020 & 2033
- Table 29: Global Recycled Aluminum Packaging Revenue million Forecast, by Types 2020 & 2033
- Table 30: Global Recycled Aluminum Packaging Revenue million Forecast, by Country 2020 & 2033
- Table 31: Turkey Recycled Aluminum Packaging Revenue (million) Forecast, by Application 2020 & 2033
- Table 32: Israel Recycled Aluminum Packaging Revenue (million) Forecast, by Application 2020 & 2033
- Table 33: GCC Recycled Aluminum Packaging Revenue (million) Forecast, by Application 2020 & 2033
- Table 34: North Africa Recycled Aluminum Packaging Revenue (million) Forecast, by Application 2020 & 2033
- Table 35: South Africa Recycled Aluminum Packaging Revenue (million) Forecast, by Application 2020 & 2033
- Table 36: Rest of Middle East & Africa Recycled Aluminum Packaging Revenue (million) Forecast, by Application 2020 & 2033
- Table 37: Global Recycled Aluminum Packaging Revenue million Forecast, by Application 2020 & 2033
- Table 38: Global Recycled Aluminum Packaging Revenue million Forecast, by Types 2020 & 2033
- Table 39: Global Recycled Aluminum Packaging Revenue million Forecast, by Country 2020 & 2033
- Table 40: China Recycled Aluminum Packaging Revenue (million) Forecast, by Application 2020 & 2033
- Table 41: India Recycled Aluminum Packaging Revenue (million) Forecast, by Application 2020 & 2033
- Table 42: Japan Recycled Aluminum Packaging Revenue (million) Forecast, by Application 2020 & 2033
- Table 43: South Korea Recycled Aluminum Packaging Revenue (million) Forecast, by Application 2020 & 2033
- Table 44: ASEAN Recycled Aluminum Packaging Revenue (million) Forecast, by Application 2020 & 2033
- Table 45: Oceania Recycled Aluminum Packaging Revenue (million) Forecast, by Application 2020 & 2033
- Table 46: Rest of Asia Pacific Recycled Aluminum Packaging Revenue (million) Forecast, by Application 2020 & 2033
Frequently Asked Questions
1. What is the projected Compound Annual Growth Rate (CAGR) of the Recycled Aluminum Packaging?
The projected CAGR is approximately 5.6%.
2. Which companies are prominent players in the Recycled Aluminum Packaging?
Key companies in the market include Novelis, Constellium, Norsk Hydro, Rio Tinto, Speira, AMAG Austria Metall AG, Ball Corporation, TRIMET Aluminium, Rusal, Arconic.
3. What are the main segments of the Recycled Aluminum Packaging?
The market segments include Application, Types.
4. Can you provide details about the market size?
The market size is estimated to be USD 7311 million as of 2022.
5. What are some drivers contributing to market growth?
N/A
6. What are the notable trends driving market growth?
N/A
7. Are there any restraints impacting market growth?
N/A
8. Can you provide examples of recent developments in the market?
N/A
9. What pricing options are available for accessing the report?
Pricing options include single-user, multi-user, and enterprise licenses priced at USD 2900.00, USD 4350.00, and USD 5800.00 respectively.
10. Is the market size provided in terms of value or volume?
The market size is provided in terms of value, measured in million.
11. Are there any specific market keywords associated with the report?
Yes, the market keyword associated with the report is "Recycled Aluminum Packaging," which aids in identifying and referencing the specific market segment covered.
12. How do I determine which pricing option suits my needs best?
The pricing options vary based on user requirements and access needs. Individual users may opt for single-user licenses, while businesses requiring broader access may choose multi-user or enterprise licenses for cost-effective access to the report.
13. Are there any additional resources or data provided in the Recycled Aluminum Packaging report?
While the report offers comprehensive insights, it's advisable to review the specific contents or supplementary materials provided to ascertain if additional resources or data are available.
14. How can I stay updated on further developments or reports in the Recycled Aluminum Packaging?
To stay informed about further developments, trends, and reports in the Recycled Aluminum Packaging, consider subscribing to industry newsletters, following relevant companies and organizations, or regularly checking reputable industry news sources and publications.
Methodology
Step 1 - Identification of Relevant Samples Size from Population Database


Step 2 - Approaches for Defining Global Market Size (Value, Volume* & Price*)

Note*: In applicable scenarios
Step 3 - Data Sources
Primary Research
- Web Analytics
- Survey Reports
- Research Institute
- Latest Research Reports
- Opinion Leaders
Secondary Research
- Annual Reports
- White Paper
- Latest Press Release
- Industry Association
- Paid Database
- Investor Presentations

Step 4 - Data Triangulation
Involves using different sources of information in order to increase the validity of a study
These sources are likely to be stakeholders in a program - participants, other researchers, program staff, other community members, and so on.
Then we put all data in single framework & apply various statistical tools to find out the dynamic on the market.
During the analysis stage, feedback from the stakeholder groups would be compared to determine areas of agreement as well as areas of divergence