

Key Insights
The global market for Recyclable and Compostable Packaging Products is poised for significant expansion, projected to reach an estimated $112.49 billion in 2025. This robust growth is fueled by a strong compound annual growth rate (CAGR) of 8.4%, indicating a dynamic and evolving industry landscape. The increasing consumer demand for sustainable solutions, coupled with stringent governmental regulations promoting eco-friendly packaging alternatives, are the primary drivers behind this upward trajectory. Industries such as Food and Beverages are at the forefront of adopting these materials, driven by brand differentiation and consumer preference for brands demonstrating environmental responsibility. Similarly, the Daily Necessities and Medical/Pharmaceutical sectors are increasingly recognizing the benefits of recyclable and compostable options for both product integrity and public perception. This shift represents a fundamental change in packaging strategy, moving away from traditional, environmentally taxing materials towards innovative, sustainable solutions that align with global environmental goals.
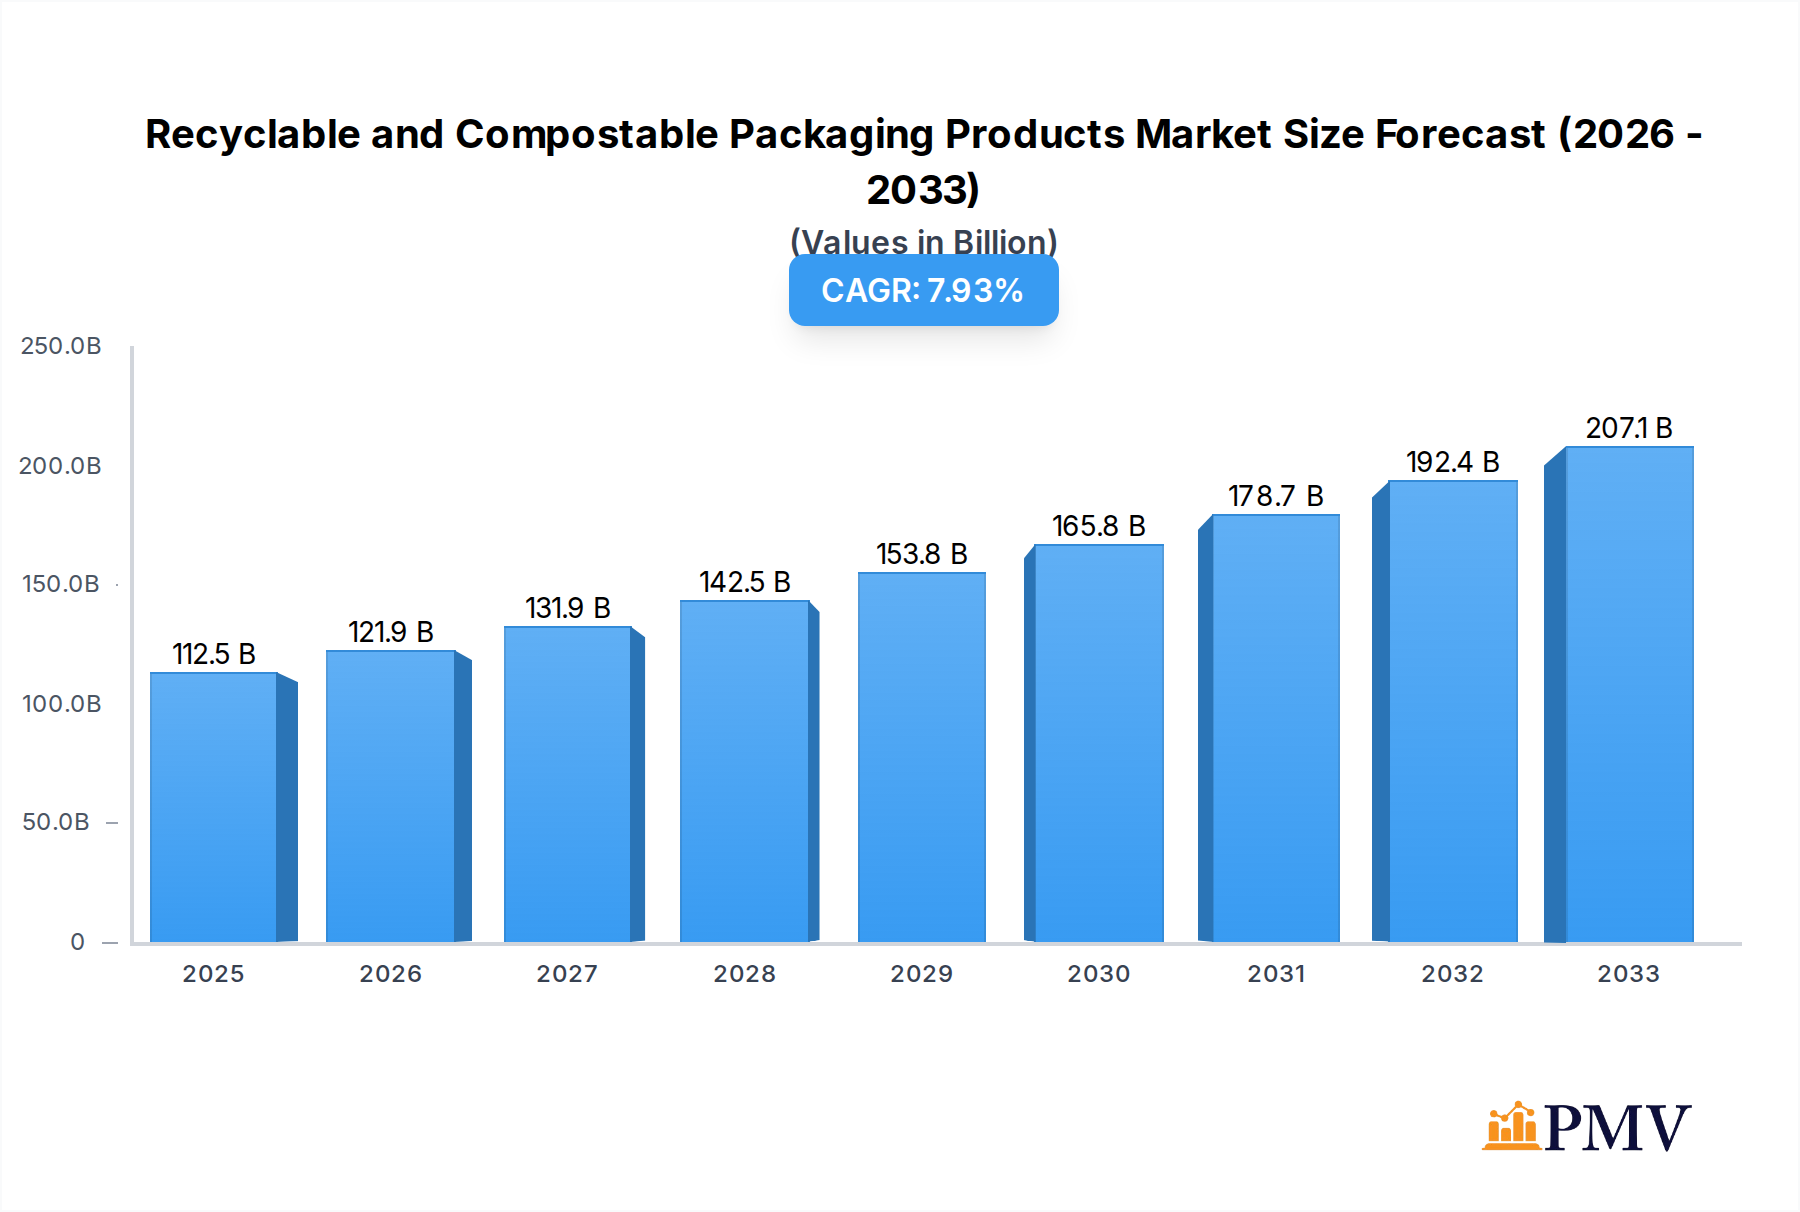
Recyclable and Compostable Packaging Products Market Size (In Billion)
The market's growth is further propelled by emerging trends in material innovation, including the development of advanced bioplastics and high-performance paper-based packaging. These advancements address limitations of early sustainable packaging, offering improved barrier properties, shelf-life, and compatibility with existing recycling and composting infrastructure. The prevalence of key players like BASF, Dow, and Amcor highlights the intense competition and ongoing investment in research and development within this sector. While the market is experiencing strong tailwinds, challenges such as the cost competitiveness of sustainable materials compared to conventional plastics and the need for enhanced consumer education regarding proper disposal methods remain significant. However, the overarching commitment to a circular economy and the continuous innovation in packaging technology are expected to overcome these restraints, solidifying the position of recyclable and compostable packaging as a cornerstone of future packaging solutions across diverse applications and regions.

Recyclable and Compostable Packaging Products Company Market Share
This comprehensive report offers an in-depth analysis of the global recyclable and compostable packaging products market, projecting a market size of over $XXX billion by 2033. Covering the historical period from 2019 to 2024, the base year of 2025, and a forecast period extending to 2033, this study provides critical insights into market dynamics, growth drivers, key players, and emerging trends. Our research encompasses a detailed examination of applications within the Food and Beverages, Daily Necessities, Medical and Pharmaceutical, and Others segments, alongside an analysis of packaging types including Packaging Bags, Packaging Films, and Packaging Containers. This report is essential for stakeholders seeking to navigate the evolving landscape of sustainable packaging solutions and capitalize on future growth opportunities.
Recyclable and Compostable Packaging Products Market Structure & Competitive Dynamics
The global recyclable and compostable packaging products market exhibits a dynamic competitive landscape characterized by a blend of established giants and innovative emerging players. Market concentration is moderate, with key companies like Amcor, Mondi Group, and Smurfit Kappa holding significant market shares, estimated to be over XX% collectively. However, a growing number of specialized firms are fostering an innovation ecosystem, driving rapid advancements in material science and manufacturing processes. Regulatory frameworks worldwide are increasingly prioritizing sustainable packaging, acting as a significant catalyst for market growth and influencing competitive strategies. Product substitutes, such as conventional plastics, are facing mounting pressure, while advancements in bio-based and mechanically recycled materials offer viable alternatives. End-user trends show a strong preference for eco-friendly packaging across all segments, particularly in Food and Beverages and Daily Necessities, where consumer awareness is highest. Mergers and acquisitions (M&A) activities are prevalent, with deal values ranging from tens of millions to several billion dollars, as larger players seek to expand their sustainable product portfolios and gain access to new technologies. For instance, the acquisition of BioBag by Novamont, valued at over $XX million, highlights the consolidation trend.
Recyclable and Compostable Packaging Products Industry Trends & Insights
The recyclable and compostable packaging products industry is experiencing robust growth, driven by a confluence of environmental consciousness, stringent regulations, and technological innovation. The market is projected to witness a Compound Annual Growth Rate (CAGR) of over XX% from 2025 to 2033, surpassing a market value of $XXX billion. This surge is fueled by an escalating demand for sustainable alternatives to traditional petroleum-based plastics, influenced by growing consumer awareness regarding plastic pollution and its detrimental environmental impact. Governments globally are implementing policies and incentives, such as extended producer responsibility (EPR) schemes and bans on single-use plastics, further accelerating the adoption of recyclable and compostable solutions. Technological disruptions are at the forefront of this transformation. Innovations in bio-based polymers derived from sources like corn starch (e.g., NatureWorks' Ingeo), sugarcane, and agricultural waste are gaining traction, offering comparable performance to conventional plastics with a significantly reduced carbon footprint. Furthermore, advancements in chemical and mechanical recycling technologies are enhancing the circularity of existing plastic waste, thereby increasing the supply and affordability of recycled content. The integration of these materials into various packaging formats, from flexible films to rigid containers, is expanding the applicability of sustainable packaging across diverse industries.
Consumer preferences have irrevocably shifted towards brands that demonstrate a commitment to environmental responsibility. This is evident in the increasing willingness of consumers to pay a premium for products packaged in sustainable materials. Food and beverage companies, in particular, are leading the charge in adopting recyclable and compostable packaging to meet consumer expectations and enhance brand image. The medical and pharmaceutical sectors, while historically more cautious due to stringent safety and sterility requirements, are also exploring sustainable options for non-critical packaging components. The competitive dynamics within the industry are intensifying, with companies investing heavily in research and development to create novel, cost-effective, and high-performance sustainable packaging solutions. Partnerships and collaborations are becoming crucial, enabling players to share expertise, scale production, and navigate complex supply chains. The market penetration of recyclable and compostable packaging is steadily increasing, moving beyond niche applications to become a mainstream component of global packaging strategies.
Dominant Markets & Segments in Recyclable and Compostable Packaging Products
The global recyclable and compostable packaging products market is significantly influenced by regional economic policies, robust infrastructure for waste management and recycling, and the pervasive influence of consumer preferences.
Leading Region: Asia Pacific is emerging as a dominant region, driven by rapidly industrializing economies, a large and growing consumer base, and increasing government initiatives to curb plastic pollution. Countries like China and India, with their vast manufacturing capabilities and growing environmental awareness, are key contributors. The region's economic policies are increasingly aligning with global sustainability agendas, promoting the adoption of eco-friendly packaging.
Dominant Application Segment: The Food and Beverages segment is the largest and fastest-growing application for recyclable and compostable packaging.
- Key Drivers:
- Consumer Demand: High consumer awareness and preference for sustainable food and beverage packaging.
- Regulatory Pressure: Stringent regulations on single-use plastics impacting food and beverage packaging.
- Brand Image: Companies leveraging sustainable packaging to enhance brand perception and attract environmentally conscious consumers.
- Material Innovation: Development of food-grade, compostable, and recyclable films and containers that meet safety and barrier property requirements.
- Detailed Dominance Analysis: This segment's dominance is further amplified by the sheer volume of packaging used for daily consumption. The need for extended shelf life, product protection, and visual appeal, combined with the growing demand for convenience, necessitates innovative packaging solutions. Brands are actively seeking recyclable and compostable alternatives for everything from snack bags and beverage bottles to ready-to-eat meal containers. The investment in these materials by major food and beverage players, such as Tetra Pak and Pactiv Evergreen, underscores their commitment and the segment's significant market share, estimated to be over XX% of the total market value.
- Key Drivers:
Dominant Packaging Type: Packaging Films represent the most dominant type within the recyclable and compostable packaging market.
- Key Drivers:
- Versatility: Ability to be used in a wide range of flexible packaging applications.
- Cost-Effectiveness: Advancements in manufacturing processes have made recyclable and compostable films increasingly competitive.
- Barrier Properties: Ongoing research is improving the barrier properties of these films for extended shelf life.
- Lightweight Nature: Reduces transportation costs and environmental impact.
- Detailed Dominance Analysis: Packaging films, encompassing a broad spectrum of flexible packaging solutions, are ubiquitous across numerous industries, particularly in Food and Beverages, Daily Necessities, and even Medical and Pharmaceutical applications. Their adaptability for applications like stand-up pouches, flow wraps, and shrink films makes them indispensable. The ability of companies like Amcor, Mondi Group, and Berry Global to produce a wide array of recyclable and compostable film solutions positions them as leaders in this segment. The market penetration of these films is high due to their cost-effectiveness and ability to meet diverse packaging needs.
- Key Drivers:
Recyclable and Compostable Packaging Products Product Innovations
Product innovations in recyclable and compostable packaging are rapidly advancing, focusing on enhanced biodegradability, improved barrier properties, and cost-competitiveness. Key developments include novel bio-based polymers derived from renewable resources, such as PHA (polyhydroxyalkanoates) and PLA (polylactic acid), offering superior compostability and reduced environmental impact. Companies are also innovating in the realm of chemical recycling to create truly circular packaging materials. The competitive advantage lies in offering solutions that meet stringent performance requirements for diverse applications, from high-barrier food packaging to durable industrial containers, while also fulfilling environmental mandates and consumer expectations.
Report Segmentation & Scope
This report segments the recyclable and compostable packaging products market across key application areas and packaging types.
Application Segmentation:
- Food and Beverages: This segment, projected to hold over XX% market share, encompasses packaging for fresh produce, dairy, bakery items, snacks, beverages, and ready-to-eat meals. Growth is driven by consumer demand for sustainable options and stringent food safety regulations.
- Daily Necessities: This includes packaging for personal care products, household cleaners, and other consumer goods, with an estimated market share of XX%. Increasing consumer awareness and brand initiatives are key growth drivers.
- Medical and Pharmaceutical: While a smaller segment at approximately XX% market share, this area is seeing growing interest in sustainable solutions for non-critical packaging, driven by regulatory pressures and corporate social responsibility.
- Others: This segment, comprising XX% of the market, includes applications in e-commerce, industrial packaging, and more, benefiting from the overall trend towards sustainable logistics.
Type Segmentation:
- Packaging Bags: This segment, estimated at XX% market share, covers stand-up pouches, pillow bags, and other flexible bag formats used across all applications.
- Packaging Films: With a projected XX% market share, this dominant segment includes flexible films for wrapping, laminating, and forming various packaging structures.
- Packaging Containers: This segment, accounting for XX% of the market, includes rigid containers such as trays, bottles, and tubs, with a growing adoption of compostable and recyclable materials.
Key Drivers of Recyclable and Compostable Packaging Products Growth
The growth of the recyclable and compostable packaging products market is propelled by several interconnected factors. Stringent environmental regulations, including bans on single-use plastics and mandates for recycled content, are a primary driver. Growing consumer awareness and demand for eco-friendly products are forcing brands to adopt sustainable packaging. Technological advancements in material science, leading to the development of high-performance bio-based and chemically recycled materials, are making these solutions more viable and cost-effective. The expanding global commitment to a circular economy and carbon footprint reduction further fuels this growth. For example, government subsidies and tax incentives for companies investing in sustainable packaging infrastructure are significant economic enablers.
Challenges in the Recyclable and Compostable Packaging Products Sector
Despite the promising growth, the recyclable and compostable packaging sector faces several challenges. Cost competitiveness remains a barrier, with some sustainable materials still being more expensive than conventional plastics. Scalability of production for certain bio-based materials can be a bottleneck, impacting availability and consistent supply. Infrastructure limitations for industrial composting and advanced recycling facilities in many regions hinder the effective end-of-life management of these products. Consumer confusion regarding proper disposal methods (recycling vs. composting) can lead to contamination and reduced effectiveness of waste streams. Furthermore, regulatory fragmentation across different geographies can create complexities for global manufacturers. The performance limitations of some compostable materials in terms of barrier properties and durability for specific applications also present a challenge.
Leading Players in the Recyclable and Compostable Packaging Products Market
- BASF
- Dow
- Amcor
- Novamont
- NatureWorks
- Avery Dennison
- Mondi Group
- Smurfit Kappa
- RKW Group
- Taghleef Industries
- TC Transcontinental
- Walki Plasbel
- Berry Global
- Sealed Air
- SML Group
- UPM Raflatac
- Elevate Packaging
- TIPA Compostable Packaging
- Biome Bioplastics
- BI-AX International
- BioBag
- Cortec Packaging
- Frankston Packaging
- Futamura
- Plascon Group
- BioLogiQ
- Emsur
- WestRock
- Vegware
- Arka Packaging
- beyondGREEN biotech
- Labelcraft
- AMS Compostable
- Tetra Pak
- Pactiv Evergreen
- BioPak
- Fedrigoni Self-Adhesives
- Plan It Green Printing
- Kingfa
Key Developments in Recyclable and Compostable Packaging Products Sector
- 2023/11: Amcor launches a new range of fully recyclable flexible packaging films for food and beverage applications, enhancing barrier properties.
- 2023/10: NatureWorks announces significant expansion of its PLA (Polylactic Acid) production capacity to meet surging global demand for bioplastics.
- 2023/09: Mondi Group introduces innovative compostable paper-based packaging solutions for the e-commerce sector.
- 2023/08: BASF invests heavily in research and development for advanced biodegradable polymers, focusing on PHA.
- 2023/07: Dow partners with a major food producer to develop recyclable packaging films with improved sustainability profiles.
- 2023/06: Smurfit Kappa acquires a leading sustainable packaging solutions provider, expanding its portfolio of recyclable materials.
- 2023/05: UPM Raflatac launches a new range of compostable and recyclable label materials for various product categories.
- 2023/04: Tetra Pak develops advanced recyclable carton solutions with enhanced environmental credentials.
- 2023/03: Vegware introduces new compostable food packaging made from plant-based materials for the foodservice industry.
- 2023/02: Novamont expands its portfolio of compostable films and bags with a focus on agricultural applications.
- 2023/01: TIPA Compostable Packaging showcases its certified home compostable packaging solutions for the snack industry.
Strategic Recyclable and Compostable Packaging Products Market Outlook
The strategic outlook for the recyclable and compostable packaging products market is exceptionally strong, driven by an irreversible global shift towards sustainability. Future growth will be accelerated by continued innovation in material science, focusing on closed-loop systems and advanced recycling technologies that create truly circular packaging. Investments in scalable production facilities and the development of robust waste management infrastructure will be crucial for widespread adoption. Strategic opportunities lie in addressing niche market demands with specialized bio-based and compostable materials, while also collaborating across the value chain to overcome current challenges. The increasing emphasis on corporate ESG (Environmental, Social, and Governance) goals will further incentivize companies to prioritize and invest in sustainable packaging, ensuring sustained market expansion and environmental benefit.
Recyclable and Compostable Packaging Products Segmentation
-
1. Application
- 1.1. Food and Beverages
- 1.2. Daily Necessities
- 1.3. Medical and Pharmaceutical
- 1.4. Others
-
2. Types
- 2.1. Packaging Bags
- 2.2. Packaging Films
- 2.3. Packaging Containers
Recyclable and Compostable Packaging Products Segmentation By Geography
-
1. North America
- 1.1. United States
- 1.2. Canada
- 1.3. Mexico
-
2. South America
- 2.1. Brazil
- 2.2. Argentina
- 2.3. Rest of South America
-
3. Europe
- 3.1. United Kingdom
- 3.2. Germany
- 3.3. France
- 3.4. Italy
- 3.5. Spain
- 3.6. Russia
- 3.7. Benelux
- 3.8. Nordics
- 3.9. Rest of Europe
-
4. Middle East & Africa
- 4.1. Turkey
- 4.2. Israel
- 4.3. GCC
- 4.4. North Africa
- 4.5. South Africa
- 4.6. Rest of Middle East & Africa
-
5. Asia Pacific
- 5.1. China
- 5.2. India
- 5.3. Japan
- 5.4. South Korea
- 5.5. ASEAN
- 5.6. Oceania
- 5.7. Rest of Asia Pacific
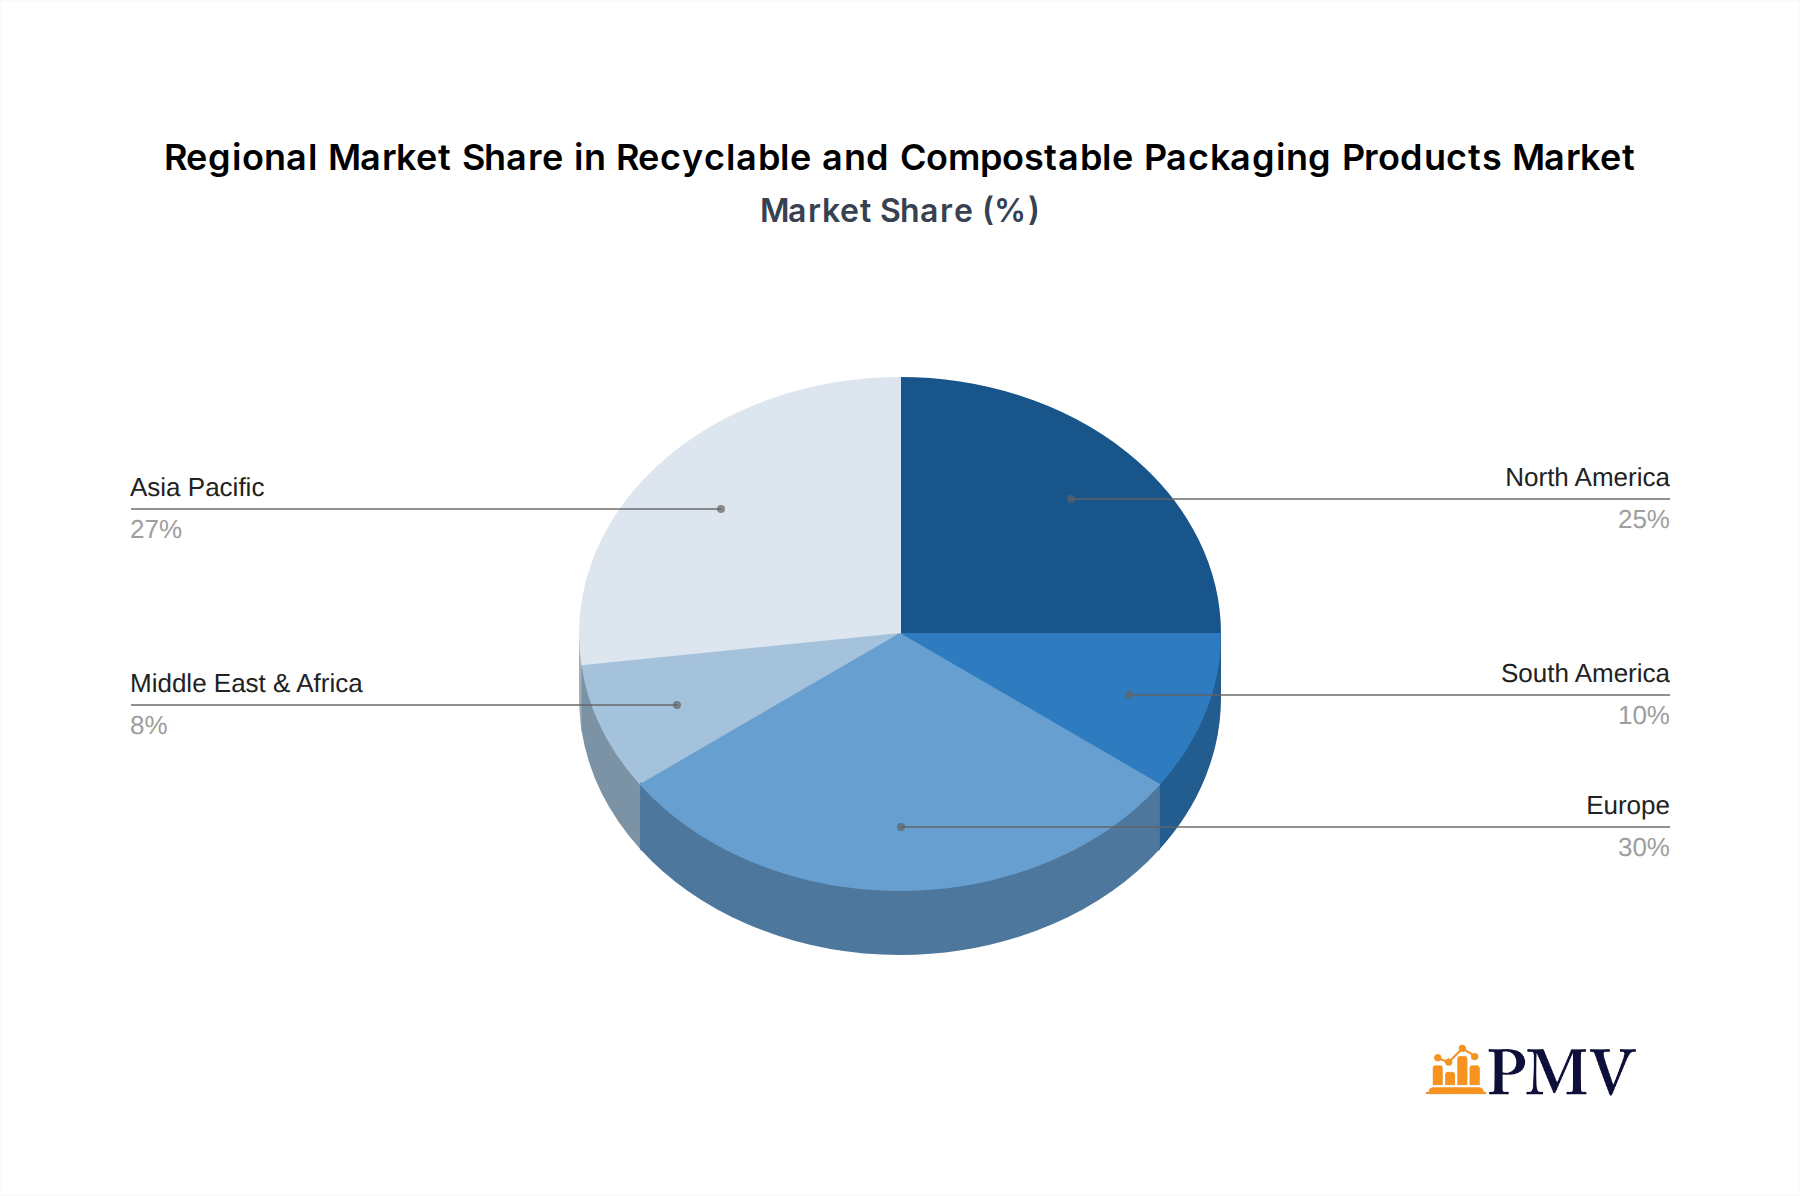
Recyclable and Compostable Packaging Products Regional Market Share
Geographic Coverage of Recyclable and Compostable Packaging Products
Recyclable and Compostable Packaging Products REPORT HIGHLIGHTS
| Aspects | Details |
|---|---|
| Study Period | 2020-2034 |
| Base Year | 2025 |
| Estimated Year | 2026 |
| Forecast Period | 2026-2034 |
| Historical Period | 2020-2025 |
| Growth Rate | CAGR of 8.4% from 2020-2034 |
| Segmentation |
|
Table of Contents
- 1. Introduction
- 1.1. Research Scope
- 1.2. Market Segmentation
- 1.3. Research Methodology
- 1.4. Definitions and Assumptions
- 2. Executive Summary
- 2.1. Introduction
- 3. Market Dynamics
- 3.1. Introduction
- 3.2. Market Drivers
- 3.3. Market Restrains
- 3.4. Market Trends
- 4. Market Factor Analysis
- 4.1. Porters Five Forces
- 4.2. Supply/Value Chain
- 4.3. PESTEL analysis
- 4.4. Market Entropy
- 4.5. Patent/Trademark Analysis
- 5. Global Recyclable and Compostable Packaging Products Analysis, Insights and Forecast, 2020-2032
- 5.1. Market Analysis, Insights and Forecast - by Application
- 5.1.1. Food and Beverages
- 5.1.2. Daily Necessities
- 5.1.3. Medical and Pharmaceutical
- 5.1.4. Others
- 5.2. Market Analysis, Insights and Forecast - by Types
- 5.2.1. Packaging Bags
- 5.2.2. Packaging Films
- 5.2.3. Packaging Containers
- 5.3. Market Analysis, Insights and Forecast - by Region
- 5.3.1. North America
- 5.3.2. South America
- 5.3.3. Europe
- 5.3.4. Middle East & Africa
- 5.3.5. Asia Pacific
- 5.1. Market Analysis, Insights and Forecast - by Application
- 6. North America Recyclable and Compostable Packaging Products Analysis, Insights and Forecast, 2020-2032
- 6.1. Market Analysis, Insights and Forecast - by Application
- 6.1.1. Food and Beverages
- 6.1.2. Daily Necessities
- 6.1.3. Medical and Pharmaceutical
- 6.1.4. Others
- 6.2. Market Analysis, Insights and Forecast - by Types
- 6.2.1. Packaging Bags
- 6.2.2. Packaging Films
- 6.2.3. Packaging Containers
- 6.1. Market Analysis, Insights and Forecast - by Application
- 7. South America Recyclable and Compostable Packaging Products Analysis, Insights and Forecast, 2020-2032
- 7.1. Market Analysis, Insights and Forecast - by Application
- 7.1.1. Food and Beverages
- 7.1.2. Daily Necessities
- 7.1.3. Medical and Pharmaceutical
- 7.1.4. Others
- 7.2. Market Analysis, Insights and Forecast - by Types
- 7.2.1. Packaging Bags
- 7.2.2. Packaging Films
- 7.2.3. Packaging Containers
- 7.1. Market Analysis, Insights and Forecast - by Application
- 8. Europe Recyclable and Compostable Packaging Products Analysis, Insights and Forecast, 2020-2032
- 8.1. Market Analysis, Insights and Forecast - by Application
- 8.1.1. Food and Beverages
- 8.1.2. Daily Necessities
- 8.1.3. Medical and Pharmaceutical
- 8.1.4. Others
- 8.2. Market Analysis, Insights and Forecast - by Types
- 8.2.1. Packaging Bags
- 8.2.2. Packaging Films
- 8.2.3. Packaging Containers
- 8.1. Market Analysis, Insights and Forecast - by Application
- 9. Middle East & Africa Recyclable and Compostable Packaging Products Analysis, Insights and Forecast, 2020-2032
- 9.1. Market Analysis, Insights and Forecast - by Application
- 9.1.1. Food and Beverages
- 9.1.2. Daily Necessities
- 9.1.3. Medical and Pharmaceutical
- 9.1.4. Others
- 9.2. Market Analysis, Insights and Forecast - by Types
- 9.2.1. Packaging Bags
- 9.2.2. Packaging Films
- 9.2.3. Packaging Containers
- 9.1. Market Analysis, Insights and Forecast - by Application
- 10. Asia Pacific Recyclable and Compostable Packaging Products Analysis, Insights and Forecast, 2020-2032
- 10.1. Market Analysis, Insights and Forecast - by Application
- 10.1.1. Food and Beverages
- 10.1.2. Daily Necessities
- 10.1.3. Medical and Pharmaceutical
- 10.1.4. Others
- 10.2. Market Analysis, Insights and Forecast - by Types
- 10.2.1. Packaging Bags
- 10.2.2. Packaging Films
- 10.2.3. Packaging Containers
- 10.1. Market Analysis, Insights and Forecast - by Application
- 11. Competitive Analysis
- 11.1. Global Market Share Analysis 2025
- 11.2. Company Profiles
- 11.2.1 BASF
- 11.2.1.1. Overview
- 11.2.1.2. Products
- 11.2.1.3. SWOT Analysis
- 11.2.1.4. Recent Developments
- 11.2.1.5. Financials (Based on Availability)
- 11.2.2 Dow
- 11.2.2.1. Overview
- 11.2.2.2. Products
- 11.2.2.3. SWOT Analysis
- 11.2.2.4. Recent Developments
- 11.2.2.5. Financials (Based on Availability)
- 11.2.3 Amcor
- 11.2.3.1. Overview
- 11.2.3.2. Products
- 11.2.3.3. SWOT Analysis
- 11.2.3.4. Recent Developments
- 11.2.3.5. Financials (Based on Availability)
- 11.2.4 Novamont
- 11.2.4.1. Overview
- 11.2.4.2. Products
- 11.2.4.3. SWOT Analysis
- 11.2.4.4. Recent Developments
- 11.2.4.5. Financials (Based on Availability)
- 11.2.5 NatureWorks
- 11.2.5.1. Overview
- 11.2.5.2. Products
- 11.2.5.3. SWOT Analysis
- 11.2.5.4. Recent Developments
- 11.2.5.5. Financials (Based on Availability)
- 11.2.6 Avery Dennison
- 11.2.6.1. Overview
- 11.2.6.2. Products
- 11.2.6.3. SWOT Analysis
- 11.2.6.4. Recent Developments
- 11.2.6.5. Financials (Based on Availability)
- 11.2.7 Mondi Group
- 11.2.7.1. Overview
- 11.2.7.2. Products
- 11.2.7.3. SWOT Analysis
- 11.2.7.4. Recent Developments
- 11.2.7.5. Financials (Based on Availability)
- 11.2.8 Smurfit Kappa
- 11.2.8.1. Overview
- 11.2.8.2. Products
- 11.2.8.3. SWOT Analysis
- 11.2.8.4. Recent Developments
- 11.2.8.5. Financials (Based on Availability)
- 11.2.9 RKW Group
- 11.2.9.1. Overview
- 11.2.9.2. Products
- 11.2.9.3. SWOT Analysis
- 11.2.9.4. Recent Developments
- 11.2.9.5. Financials (Based on Availability)
- 11.2.10 Taghleef Industries
- 11.2.10.1. Overview
- 11.2.10.2. Products
- 11.2.10.3. SWOT Analysis
- 11.2.10.4. Recent Developments
- 11.2.10.5. Financials (Based on Availability)
- 11.2.11 TC Transcontinental
- 11.2.11.1. Overview
- 11.2.11.2. Products
- 11.2.11.3. SWOT Analysis
- 11.2.11.4. Recent Developments
- 11.2.11.5. Financials (Based on Availability)
- 11.2.12 Walki Plasbel
- 11.2.12.1. Overview
- 11.2.12.2. Products
- 11.2.12.3. SWOT Analysis
- 11.2.12.4. Recent Developments
- 11.2.12.5. Financials (Based on Availability)
- 11.2.13 Berry Global
- 11.2.13.1. Overview
- 11.2.13.2. Products
- 11.2.13.3. SWOT Analysis
- 11.2.13.4. Recent Developments
- 11.2.13.5. Financials (Based on Availability)
- 11.2.14 Sealed Air
- 11.2.14.1. Overview
- 11.2.14.2. Products
- 11.2.14.3. SWOT Analysis
- 11.2.14.4. Recent Developments
- 11.2.14.5. Financials (Based on Availability)
- 11.2.15 SML Group
- 11.2.15.1. Overview
- 11.2.15.2. Products
- 11.2.15.3. SWOT Analysis
- 11.2.15.4. Recent Developments
- 11.2.15.5. Financials (Based on Availability)
- 11.2.16 UPM Raflatac
- 11.2.16.1. Overview
- 11.2.16.2. Products
- 11.2.16.3. SWOT Analysis
- 11.2.16.4. Recent Developments
- 11.2.16.5. Financials (Based on Availability)
- 11.2.17 Elevate Packaging
- 11.2.17.1. Overview
- 11.2.17.2. Products
- 11.2.17.3. SWOT Analysis
- 11.2.17.4. Recent Developments
- 11.2.17.5. Financials (Based on Availability)
- 11.2.18 TIPA Compostable Packaging
- 11.2.18.1. Overview
- 11.2.18.2. Products
- 11.2.18.3. SWOT Analysis
- 11.2.18.4. Recent Developments
- 11.2.18.5. Financials (Based on Availability)
- 11.2.19 Biome Bioplastics
- 11.2.19.1. Overview
- 11.2.19.2. Products
- 11.2.19.3. SWOT Analysis
- 11.2.19.4. Recent Developments
- 11.2.19.5. Financials (Based on Availability)
- 11.2.20 BI-AX International
- 11.2.20.1. Overview
- 11.2.20.2. Products
- 11.2.20.3. SWOT Analysis
- 11.2.20.4. Recent Developments
- 11.2.20.5. Financials (Based on Availability)
- 11.2.21 BioBag
- 11.2.21.1. Overview
- 11.2.21.2. Products
- 11.2.21.3. SWOT Analysis
- 11.2.21.4. Recent Developments
- 11.2.21.5. Financials (Based on Availability)
- 11.2.22 Cortec Packaging
- 11.2.22.1. Overview
- 11.2.22.2. Products
- 11.2.22.3. SWOT Analysis
- 11.2.22.4. Recent Developments
- 11.2.22.5. Financials (Based on Availability)
- 11.2.23 Frankston Packaging
- 11.2.23.1. Overview
- 11.2.23.2. Products
- 11.2.23.3. SWOT Analysis
- 11.2.23.4. Recent Developments
- 11.2.23.5. Financials (Based on Availability)
- 11.2.24 Futamura
- 11.2.24.1. Overview
- 11.2.24.2. Products
- 11.2.24.3. SWOT Analysis
- 11.2.24.4. Recent Developments
- 11.2.24.5. Financials (Based on Availability)
- 11.2.25 Plascon Group
- 11.2.25.1. Overview
- 11.2.25.2. Products
- 11.2.25.3. SWOT Analysis
- 11.2.25.4. Recent Developments
- 11.2.25.5. Financials (Based on Availability)
- 11.2.26 BioLogiQ
- 11.2.26.1. Overview
- 11.2.26.2. Products
- 11.2.26.3. SWOT Analysis
- 11.2.26.4. Recent Developments
- 11.2.26.5. Financials (Based on Availability)
- 11.2.27 Emsur
- 11.2.27.1. Overview
- 11.2.27.2. Products
- 11.2.27.3. SWOT Analysis
- 11.2.27.4. Recent Developments
- 11.2.27.5. Financials (Based on Availability)
- 11.2.28 WestRock
- 11.2.28.1. Overview
- 11.2.28.2. Products
- 11.2.28.3. SWOT Analysis
- 11.2.28.4. Recent Developments
- 11.2.28.5. Financials (Based on Availability)
- 11.2.29 Vegware
- 11.2.29.1. Overview
- 11.2.29.2. Products
- 11.2.29.3. SWOT Analysis
- 11.2.29.4. Recent Developments
- 11.2.29.5. Financials (Based on Availability)
- 11.2.30 Arka Packaging
- 11.2.30.1. Overview
- 11.2.30.2. Products
- 11.2.30.3. SWOT Analysis
- 11.2.30.4. Recent Developments
- 11.2.30.5. Financials (Based on Availability)
- 11.2.31 beyondGREEN biotech
- 11.2.31.1. Overview
- 11.2.31.2. Products
- 11.2.31.3. SWOT Analysis
- 11.2.31.4. Recent Developments
- 11.2.31.5. Financials (Based on Availability)
- 11.2.32 Labelcraft
- 11.2.32.1. Overview
- 11.2.32.2. Products
- 11.2.32.3. SWOT Analysis
- 11.2.32.4. Recent Developments
- 11.2.32.5. Financials (Based on Availability)
- 11.2.33 AMS Compostable
- 11.2.33.1. Overview
- 11.2.33.2. Products
- 11.2.33.3. SWOT Analysis
- 11.2.33.4. Recent Developments
- 11.2.33.5. Financials (Based on Availability)
- 11.2.34 Tetra Pak
- 11.2.34.1. Overview
- 11.2.34.2. Products
- 11.2.34.3. SWOT Analysis
- 11.2.34.4. Recent Developments
- 11.2.34.5. Financials (Based on Availability)
- 11.2.35 Pactiv Evergreen
- 11.2.35.1. Overview
- 11.2.35.2. Products
- 11.2.35.3. SWOT Analysis
- 11.2.35.4. Recent Developments
- 11.2.35.5. Financials (Based on Availability)
- 11.2.36 BioPak
- 11.2.36.1. Overview
- 11.2.36.2. Products
- 11.2.36.3. SWOT Analysis
- 11.2.36.4. Recent Developments
- 11.2.36.5. Financials (Based on Availability)
- 11.2.37 Fedrigoni Self-Adhesives
- 11.2.37.1. Overview
- 11.2.37.2. Products
- 11.2.37.3. SWOT Analysis
- 11.2.37.4. Recent Developments
- 11.2.37.5. Financials (Based on Availability)
- 11.2.38 Plan It Green Printing
- 11.2.38.1. Overview
- 11.2.38.2. Products
- 11.2.38.3. SWOT Analysis
- 11.2.38.4. Recent Developments
- 11.2.38.5. Financials (Based on Availability)
- 11.2.39 Kingfa
- 11.2.39.1. Overview
- 11.2.39.2. Products
- 11.2.39.3. SWOT Analysis
- 11.2.39.4. Recent Developments
- 11.2.39.5. Financials (Based on Availability)
- 11.2.1 BASF
List of Figures
- Figure 1: Global Recyclable and Compostable Packaging Products Revenue Breakdown (billion, %) by Region 2025 & 2033
- Figure 2: North America Recyclable and Compostable Packaging Products Revenue (billion), by Application 2025 & 2033
- Figure 3: North America Recyclable and Compostable Packaging Products Revenue Share (%), by Application 2025 & 2033
- Figure 4: North America Recyclable and Compostable Packaging Products Revenue (billion), by Types 2025 & 2033
- Figure 5: North America Recyclable and Compostable Packaging Products Revenue Share (%), by Types 2025 & 2033
- Figure 6: North America Recyclable and Compostable Packaging Products Revenue (billion), by Country 2025 & 2033
- Figure 7: North America Recyclable and Compostable Packaging Products Revenue Share (%), by Country 2025 & 2033
- Figure 8: South America Recyclable and Compostable Packaging Products Revenue (billion), by Application 2025 & 2033
- Figure 9: South America Recyclable and Compostable Packaging Products Revenue Share (%), by Application 2025 & 2033
- Figure 10: South America Recyclable and Compostable Packaging Products Revenue (billion), by Types 2025 & 2033
- Figure 11: South America Recyclable and Compostable Packaging Products Revenue Share (%), by Types 2025 & 2033
- Figure 12: South America Recyclable and Compostable Packaging Products Revenue (billion), by Country 2025 & 2033
- Figure 13: South America Recyclable and Compostable Packaging Products Revenue Share (%), by Country 2025 & 2033
- Figure 14: Europe Recyclable and Compostable Packaging Products Revenue (billion), by Application 2025 & 2033
- Figure 15: Europe Recyclable and Compostable Packaging Products Revenue Share (%), by Application 2025 & 2033
- Figure 16: Europe Recyclable and Compostable Packaging Products Revenue (billion), by Types 2025 & 2033
- Figure 17: Europe Recyclable and Compostable Packaging Products Revenue Share (%), by Types 2025 & 2033
- Figure 18: Europe Recyclable and Compostable Packaging Products Revenue (billion), by Country 2025 & 2033
- Figure 19: Europe Recyclable and Compostable Packaging Products Revenue Share (%), by Country 2025 & 2033
- Figure 20: Middle East & Africa Recyclable and Compostable Packaging Products Revenue (billion), by Application 2025 & 2033
- Figure 21: Middle East & Africa Recyclable and Compostable Packaging Products Revenue Share (%), by Application 2025 & 2033
- Figure 22: Middle East & Africa Recyclable and Compostable Packaging Products Revenue (billion), by Types 2025 & 2033
- Figure 23: Middle East & Africa Recyclable and Compostable Packaging Products Revenue Share (%), by Types 2025 & 2033
- Figure 24: Middle East & Africa Recyclable and Compostable Packaging Products Revenue (billion), by Country 2025 & 2033
- Figure 25: Middle East & Africa Recyclable and Compostable Packaging Products Revenue Share (%), by Country 2025 & 2033
- Figure 26: Asia Pacific Recyclable and Compostable Packaging Products Revenue (billion), by Application 2025 & 2033
- Figure 27: Asia Pacific Recyclable and Compostable Packaging Products Revenue Share (%), by Application 2025 & 2033
- Figure 28: Asia Pacific Recyclable and Compostable Packaging Products Revenue (billion), by Types 2025 & 2033
- Figure 29: Asia Pacific Recyclable and Compostable Packaging Products Revenue Share (%), by Types 2025 & 2033
- Figure 30: Asia Pacific Recyclable and Compostable Packaging Products Revenue (billion), by Country 2025 & 2033
- Figure 31: Asia Pacific Recyclable and Compostable Packaging Products Revenue Share (%), by Country 2025 & 2033
List of Tables
- Table 1: Global Recyclable and Compostable Packaging Products Revenue billion Forecast, by Application 2020 & 2033
- Table 2: Global Recyclable and Compostable Packaging Products Revenue billion Forecast, by Types 2020 & 2033
- Table 3: Global Recyclable and Compostable Packaging Products Revenue billion Forecast, by Region 2020 & 2033
- Table 4: Global Recyclable and Compostable Packaging Products Revenue billion Forecast, by Application 2020 & 2033
- Table 5: Global Recyclable and Compostable Packaging Products Revenue billion Forecast, by Types 2020 & 2033
- Table 6: Global Recyclable and Compostable Packaging Products Revenue billion Forecast, by Country 2020 & 2033
- Table 7: United States Recyclable and Compostable Packaging Products Revenue (billion) Forecast, by Application 2020 & 2033
- Table 8: Canada Recyclable and Compostable Packaging Products Revenue (billion) Forecast, by Application 2020 & 2033
- Table 9: Mexico Recyclable and Compostable Packaging Products Revenue (billion) Forecast, by Application 2020 & 2033
- Table 10: Global Recyclable and Compostable Packaging Products Revenue billion Forecast, by Application 2020 & 2033
- Table 11: Global Recyclable and Compostable Packaging Products Revenue billion Forecast, by Types 2020 & 2033
- Table 12: Global Recyclable and Compostable Packaging Products Revenue billion Forecast, by Country 2020 & 2033
- Table 13: Brazil Recyclable and Compostable Packaging Products Revenue (billion) Forecast, by Application 2020 & 2033
- Table 14: Argentina Recyclable and Compostable Packaging Products Revenue (billion) Forecast, by Application 2020 & 2033
- Table 15: Rest of South America Recyclable and Compostable Packaging Products Revenue (billion) Forecast, by Application 2020 & 2033
- Table 16: Global Recyclable and Compostable Packaging Products Revenue billion Forecast, by Application 2020 & 2033
- Table 17: Global Recyclable and Compostable Packaging Products Revenue billion Forecast, by Types 2020 & 2033
- Table 18: Global Recyclable and Compostable Packaging Products Revenue billion Forecast, by Country 2020 & 2033
- Table 19: United Kingdom Recyclable and Compostable Packaging Products Revenue (billion) Forecast, by Application 2020 & 2033
- Table 20: Germany Recyclable and Compostable Packaging Products Revenue (billion) Forecast, by Application 2020 & 2033
- Table 21: France Recyclable and Compostable Packaging Products Revenue (billion) Forecast, by Application 2020 & 2033
- Table 22: Italy Recyclable and Compostable Packaging Products Revenue (billion) Forecast, by Application 2020 & 2033
- Table 23: Spain Recyclable and Compostable Packaging Products Revenue (billion) Forecast, by Application 2020 & 2033
- Table 24: Russia Recyclable and Compostable Packaging Products Revenue (billion) Forecast, by Application 2020 & 2033
- Table 25: Benelux Recyclable and Compostable Packaging Products Revenue (billion) Forecast, by Application 2020 & 2033
- Table 26: Nordics Recyclable and Compostable Packaging Products Revenue (billion) Forecast, by Application 2020 & 2033
- Table 27: Rest of Europe Recyclable and Compostable Packaging Products Revenue (billion) Forecast, by Application 2020 & 2033
- Table 28: Global Recyclable and Compostable Packaging Products Revenue billion Forecast, by Application 2020 & 2033
- Table 29: Global Recyclable and Compostable Packaging Products Revenue billion Forecast, by Types 2020 & 2033
- Table 30: Global Recyclable and Compostable Packaging Products Revenue billion Forecast, by Country 2020 & 2033
- Table 31: Turkey Recyclable and Compostable Packaging Products Revenue (billion) Forecast, by Application 2020 & 2033
- Table 32: Israel Recyclable and Compostable Packaging Products Revenue (billion) Forecast, by Application 2020 & 2033
- Table 33: GCC Recyclable and Compostable Packaging Products Revenue (billion) Forecast, by Application 2020 & 2033
- Table 34: North Africa Recyclable and Compostable Packaging Products Revenue (billion) Forecast, by Application 2020 & 2033
- Table 35: South Africa Recyclable and Compostable Packaging Products Revenue (billion) Forecast, by Application 2020 & 2033
- Table 36: Rest of Middle East & Africa Recyclable and Compostable Packaging Products Revenue (billion) Forecast, by Application 2020 & 2033
- Table 37: Global Recyclable and Compostable Packaging Products Revenue billion Forecast, by Application 2020 & 2033
- Table 38: Global Recyclable and Compostable Packaging Products Revenue billion Forecast, by Types 2020 & 2033
- Table 39: Global Recyclable and Compostable Packaging Products Revenue billion Forecast, by Country 2020 & 2033
- Table 40: China Recyclable and Compostable Packaging Products Revenue (billion) Forecast, by Application 2020 & 2033
- Table 41: India Recyclable and Compostable Packaging Products Revenue (billion) Forecast, by Application 2020 & 2033
- Table 42: Japan Recyclable and Compostable Packaging Products Revenue (billion) Forecast, by Application 2020 & 2033
- Table 43: South Korea Recyclable and Compostable Packaging Products Revenue (billion) Forecast, by Application 2020 & 2033
- Table 44: ASEAN Recyclable and Compostable Packaging Products Revenue (billion) Forecast, by Application 2020 & 2033
- Table 45: Oceania Recyclable and Compostable Packaging Products Revenue (billion) Forecast, by Application 2020 & 2033
- Table 46: Rest of Asia Pacific Recyclable and Compostable Packaging Products Revenue (billion) Forecast, by Application 2020 & 2033
Frequently Asked Questions
1. What is the projected Compound Annual Growth Rate (CAGR) of the Recyclable and Compostable Packaging Products?
The projected CAGR is approximately 8.4%.
2. Which companies are prominent players in the Recyclable and Compostable Packaging Products?
Key companies in the market include BASF, Dow, Amcor, Novamont, NatureWorks, Avery Dennison, Mondi Group, Smurfit Kappa, RKW Group, Taghleef Industries, TC Transcontinental, Walki Plasbel, Berry Global, Sealed Air, SML Group, UPM Raflatac, Elevate Packaging, TIPA Compostable Packaging, Biome Bioplastics, BI-AX International, BioBag, Cortec Packaging, Frankston Packaging, Futamura, Plascon Group, BioLogiQ, Emsur, WestRock, Vegware, Arka Packaging, beyondGREEN biotech, Labelcraft, AMS Compostable, Tetra Pak, Pactiv Evergreen, BioPak, Fedrigoni Self-Adhesives, Plan It Green Printing, Kingfa.
3. What are the main segments of the Recyclable and Compostable Packaging Products?
The market segments include Application, Types.
4. Can you provide details about the market size?
The market size is estimated to be USD 112.49 billion as of 2022.
5. What are some drivers contributing to market growth?
N/A
6. What are the notable trends driving market growth?
N/A
7. Are there any restraints impacting market growth?
N/A
8. Can you provide examples of recent developments in the market?
N/A
9. What pricing options are available for accessing the report?
Pricing options include single-user, multi-user, and enterprise licenses priced at USD 4900.00, USD 7350.00, and USD 9800.00 respectively.
10. Is the market size provided in terms of value or volume?
The market size is provided in terms of value, measured in billion.
11. Are there any specific market keywords associated with the report?
Yes, the market keyword associated with the report is "Recyclable and Compostable Packaging Products," which aids in identifying and referencing the specific market segment covered.
12. How do I determine which pricing option suits my needs best?
The pricing options vary based on user requirements and access needs. Individual users may opt for single-user licenses, while businesses requiring broader access may choose multi-user or enterprise licenses for cost-effective access to the report.
13. Are there any additional resources or data provided in the Recyclable and Compostable Packaging Products report?
While the report offers comprehensive insights, it's advisable to review the specific contents or supplementary materials provided to ascertain if additional resources or data are available.
14. How can I stay updated on further developments or reports in the Recyclable and Compostable Packaging Products?
To stay informed about further developments, trends, and reports in the Recyclable and Compostable Packaging Products, consider subscribing to industry newsletters, following relevant companies and organizations, or regularly checking reputable industry news sources and publications.
Methodology
Step 1 - Identification of Relevant Samples Size from Population Database


Step 2 - Approaches for Defining Global Market Size (Value, Volume* & Price*)

Note*: In applicable scenarios
Step 3 - Data Sources
Primary Research
- Web Analytics
- Survey Reports
- Research Institute
- Latest Research Reports
- Opinion Leaders
Secondary Research
- Annual Reports
- White Paper
- Latest Press Release
- Industry Association
- Paid Database
- Investor Presentations

Step 4 - Data Triangulation
Involves using different sources of information in order to increase the validity of a study
These sources are likely to be stakeholders in a program - participants, other researchers, program staff, other community members, and so on.
Then we put all data in single framework & apply various statistical tools to find out the dynamic on the market.
During the analysis stage, feedback from the stakeholder groups would be compared to determine areas of agreement as well as areas of divergence