
Key Insights
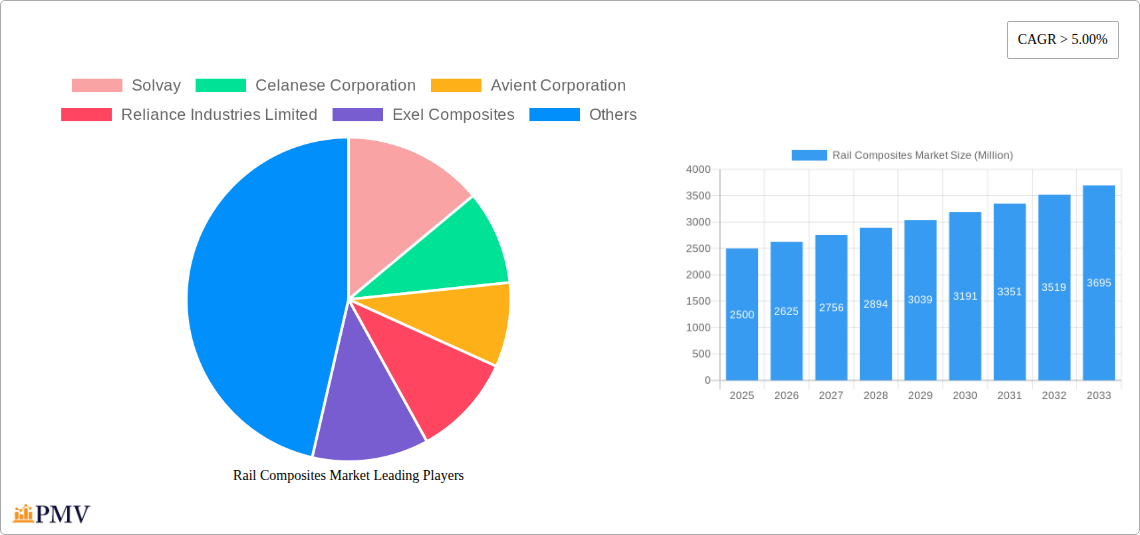
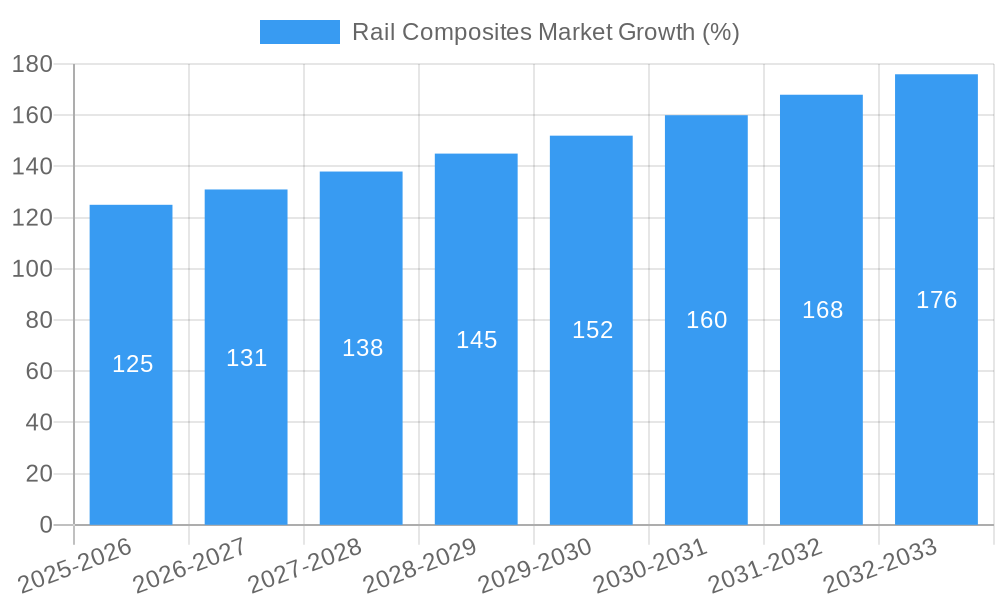
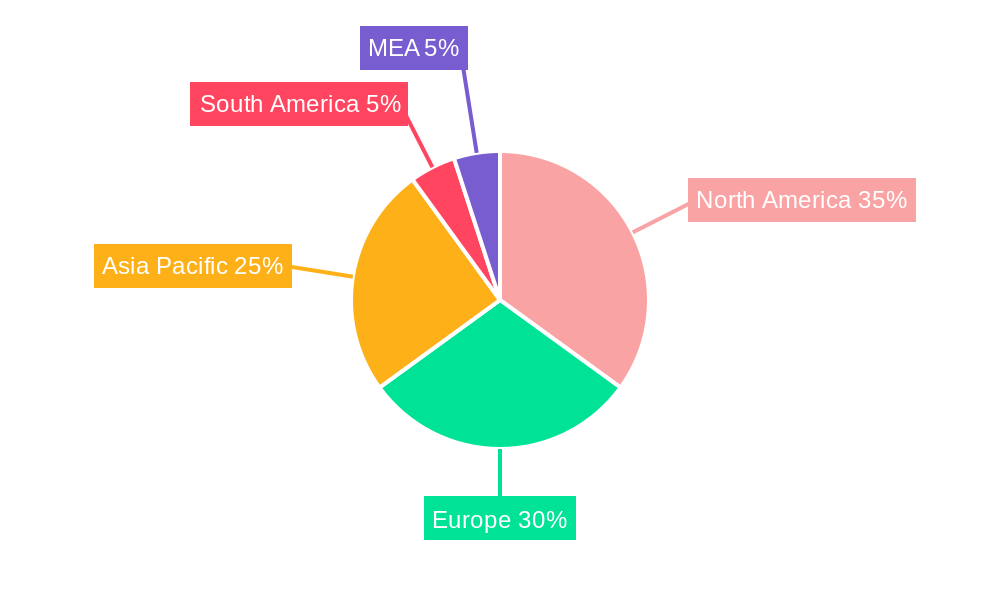
The global rail composites market is experiencing robust growth, driven by increasing demand for lightweight, high-strength materials in the railway industry. A CAGR exceeding 5% indicates a significant expansion from 2019 to 2033, propelled by several key factors. The rising adoption of composite materials in rolling stock construction—for applications like carriages, bogies, and interiors—is a primary driver. This trend is fueled by the need to enhance fuel efficiency, reduce maintenance costs, and improve overall passenger comfort. Furthermore, advancements in resin and fiber technologies, leading to improved material properties and cost-effectiveness, are contributing to market growth. Specific resin types like epoxy and polyester dominate the market due to their favorable balance of strength, durability, and cost. Similarly, glass fiber remains the most prevalent fiber type owing to its relatively low cost and good mechanical properties. The market segmentation reveals a strong demand for composite materials in both exterior and interior rail applications, reflecting their versatility and suitability for a wide range of components. Geographical analysis suggests that North America and Europe currently hold significant market shares, but the Asia-Pacific region is projected to witness the fastest growth in the coming years, driven by extensive rail infrastructure development projects in countries like China and India. Leading players like Solvay, Celanese, and BASF are strategically investing in R&D and expansion to capitalize on this expanding market opportunity.
Despite the positive outlook, certain restraints could potentially impede growth. These include the relatively higher initial cost of composite materials compared to traditional alternatives like steel, as well as concerns related to recyclability and potential environmental impacts. However, ongoing innovations focusing on cost reduction and sustainable manufacturing processes are expected to mitigate these concerns. The market is also expected to witness increased competition, leading to price pressures and the need for continuous innovation to maintain a competitive edge. The long-term outlook for the rail composites market remains optimistic, driven by the increasing emphasis on sustainability and performance enhancement within the railway sector. We anticipate a continuous shift towards greater adoption of composite materials in new and existing rail infrastructure globally.
Rail Composites Market: A Comprehensive Analysis (2019-2033)
This in-depth report provides a comprehensive analysis of the global Rail Composites Market, offering invaluable insights for stakeholders across the value chain. From market structure and competitive dynamics to key trends, dominant segments, and future outlooks, this report equips you with the data-driven intelligence needed to navigate this dynamic industry. The report covers the period 2019-2033, with 2025 as the base year and forecast period spanning 2025-2033. The market size is projected to reach xx Million by 2033.
Rail Composites Market Market Structure & Competitive Dynamics
The Rail Composites Market exhibits a moderately consolidated structure, with key players such as Solvay, Celanese Corporation, Avient Corporation, Reliance Industries Limited, Exel Composites, LANXESS, BASF SE, Kineco Limited, Toray Industries Inc, Hexcel Corporation, Gurit, TEIJIN LIMITED, and Mitsubishi Chemical Advanced Materials holding significant market share. Market concentration is influenced by factors such as technological advancements, economies of scale, and access to raw materials. The competitive landscape is characterized by intense rivalry, with companies focusing on innovation, product differentiation, and strategic partnerships to gain a competitive edge. Innovation ecosystems play a crucial role, fostering the development of advanced composite materials and manufacturing processes. Stringent regulatory frameworks related to safety and environmental standards also impact market dynamics. Product substitutes, such as traditional metal components, pose a significant challenge, although the superior performance and lightweight properties of composites are driving substitution. End-user preferences, particularly a growing demand for lightweight, durable, and cost-effective rail solutions, are shaping market growth. M&A activities within the industry are relatively frequent, with deal values ranging from xx Million to xx Million, primarily focused on expanding product portfolios and market reach. Market share analysis reveals that the top five players collectively account for approximately xx% of the market.
Rail Composites Market Industry Trends & Insights
The Rail Composites Market is experiencing robust growth, driven by several key factors. The increasing demand for high-speed rail infrastructure globally is a major catalyst, fueling the need for lightweight, high-strength materials like composites. Technological advancements in resin and fiber technologies are continuously improving the performance characteristics of rail composites, driving market penetration. Consumer preferences are shifting towards eco-friendly and sustainable transportation options, with composites offering advantages in terms of reduced weight and energy efficiency. The CAGR for the Rail Composites Market during the forecast period (2025-2033) is estimated to be xx%. Furthermore, favorable government policies and investments in infrastructure projects in key regions are contributing significantly to market expansion. Competitive dynamics continue to intensify, with companies investing heavily in research and development to innovate new composite materials and manufacturing processes. The market penetration of rail composites in various applications, including both exterior and interior components, is steadily increasing, indicating strong potential for future growth.
Dominant Markets & Segments in Rail Composites Market
- Leading Region: Asia-Pacific is expected to dominate the Rail Composites Market due to significant investments in high-speed rail infrastructure and rapid economic growth in countries such as China and India.
- Leading Country: China is a leading market due to its massive high-speed rail network expansion plans and significant manufacturing capabilities.
- Dominant Resin Type: Epoxy resins hold a dominant position owing to their superior mechanical properties, excellent adhesion, and resistance to chemicals. The large market share of epoxy resins stems from their versatility and suitability for various rail applications.
- Dominant Fiber Type: Glass fiber composites represent a substantial market share, driven by their cost-effectiveness and adequate mechanical properties for many rail applications. However, the adoption of carbon fiber composites is increasing due to their superior strength-to-weight ratio, leading to higher fuel efficiency.
- Dominant Application: The exterior application segment holds a dominant position, driven by the high demand for lightweight and durable exterior components such as car bodies and underframes.
Key drivers for the dominant segments include:
- Economic policies: Government incentives and infrastructure development programs in various regions are significantly boosting market growth.
- Infrastructure development: The global expansion of high-speed rail networks is creating massive demand for advanced composite materials.
Rail Composites Market Product Innovations
Recent innovations in rail composites have focused on developing lighter, stronger, and more cost-effective materials. This includes the advancement of hybrid composites combining different fiber types and resins to optimize material properties for specific applications. Manufacturers are also exploring new manufacturing processes such as automated fiber placement and resin transfer molding to enhance production efficiency and reduce costs. These innovations are enhancing the overall performance, durability, and market fit of rail composites, resulting in increased adoption rates across various applications.
Report Segmentation & Scope
Resin Type: The market is segmented by resin type into Epoxy, Polyester, Phenolic, Vinyl Ester, and Other Resin Types. Each segment displays varying growth projections based on performance characteristics, cost, and specific application suitability. Epoxy resins are expected to maintain the largest market share.
Fiber Type: The market is segmented by fiber type into Glass Fiber, Carbon Fiber, and Other Fiber Types. Carbon fiber composites are projected to exhibit faster growth, driven by increasing demand for lightweight, high-performance components.
Application: The market is segmented into Exterior and Interior applications. The exterior application segment dominates, driven by the need for durable and lightweight components for car bodies and underframes.
Key Drivers of Rail Composites Market Growth
The growth of the Rail Composites Market is propelled by several factors. The increasing demand for lightweight and high-performance rail vehicles significantly drives the adoption of composites. Stringent regulatory frameworks promoting fuel efficiency and environmental sustainability are creating a favorable environment for composite materials. Technological advancements in resin and fiber technologies continually improve the performance and cost-effectiveness of composites, further stimulating market growth. Government investments in infrastructure projects, especially high-speed rail networks globally, are a major factor driving market expansion.
Challenges in the Rail Composites Market Sector
Despite significant growth potential, the Rail Composites Market faces certain challenges. High raw material costs and fluctuating prices for resins and fibers can negatively impact profitability. Supply chain disruptions and the dependence on a limited number of key suppliers pose risks. The high initial investment required for composite manufacturing facilities can be a barrier to entry for new players. Furthermore, stringent safety and regulatory requirements and potential recycling issues need to be addressed for sustainable market growth.
Leading Players in the Rail Composites Market Market
- Solvay
- Celanese Corporation
- Avient Corporation
- Reliance Industries Limited
- Exel Composites
- LANXESS
- BASF SE
- Kineco Limited
- Toray Industries Inc
- Hexcel Corporation
- Gurit
- TEIJIN LIMITED
- Mitsubishi Chemical Advanced Materials
Key Developments in Rail Composites Market Sector
- May 2021: Celanese announced a three-year plan to expand its LFT (long-fiber thermoplastics) capacity in Nanjing, China, expected to be completed by the second half of 2023. This expansion significantly impacts the supply of key raw materials for rail composite manufacturing, potentially influencing market prices and availability.
Strategic Rail Composites Market Market Outlook
The Rail Composites Market is poised for substantial growth in the coming years, driven by continued investment in rail infrastructure globally, technological advancements, and increasing demand for lightweight and sustainable transportation solutions. Strategic opportunities exist for companies that can innovate new composite materials with enhanced performance characteristics, develop efficient manufacturing processes, and establish strong supply chain relationships. Focus on sustainability and lifecycle management of composite materials will also play a crucial role in shaping the future of the market.
Rail Composites Market Segmentation
-
1. Resin Type
- 1.1. Epoxy
- 1.2. Polyester
- 1.3. Phenolic
- 1.4. Vinyl Ester
- 1.5. Other Resin Types
-
2. Fiber Type
- 2.1. Glass Fiber
- 2.2. Carbon Fiber
- 2.3. Other Fiber Types
-
3. Application
- 3.1. Exterior
- 3.2. Interior
Rail Composites Market Segmentation By Geography
-
1. Asia Pacific
- 1.1. China
- 1.2. India
- 1.3. Japan
- 1.4. South Korea
- 1.5. Rest of Asia Pacific
-
2. North America
- 2.1. United States
- 2.2. Canada
- 2.3. Mexico
-
3. Europe
- 3.1. Germany
- 3.2. United Kingdom
- 3.3. Italy
- 3.4. France
- 3.5. Rest of Europe
- 4. Rest of the World
Rail Composites Market REPORT HIGHLIGHTS
| Aspects | Details |
|---|---|
| Study Period | 2019-2033 |
| Base Year | 2024 |
| Estimated Year | 2025 |
| Forecast Period | 2025-2033 |
| Historical Period | 2019-2024 |
| Growth Rate | CAGR of > 5.00% from 2019-2033 |
| Segmentation |
|
Table of Contents
- 1. Introduction
- 1.1. Research Scope
- 1.2. Market Segmentation
- 1.3. Research Methodology
- 1.4. Definitions and Assumptions
- 2. Executive Summary
- 2.1. Introduction
- 3. Market Dynamics
- 3.1. Introduction
- 3.2. Market Drivers
- 3.2.1. Increasing Railway Projects in the Asia-Pacific Region; Rapidly Increasing Demand for High-speed Rail
- 3.3. Market Restrains
- 3.3.1 Lack of Railway Infrastructure in Vietnam
- 3.3.2 Indonesia
- 3.3.3 and Thailand; Restrictions on Composite Materials for Railway Application
- 3.4. Market Trends
- 3.4.1. Exterior Application to Dominate the Market
- 4. Market Factor Analysis
- 4.1. Porters Five Forces
- 4.2. Supply/Value Chain
- 4.3. PESTEL analysis
- 4.4. Market Entropy
- 4.5. Patent/Trademark Analysis
- 5. Global Rail Composites Market Analysis, Insights and Forecast, 2019-2031
- 5.1. Market Analysis, Insights and Forecast - by Resin Type
- 5.1.1. Epoxy
- 5.1.2. Polyester
- 5.1.3. Phenolic
- 5.1.4. Vinyl Ester
- 5.1.5. Other Resin Types
- 5.2. Market Analysis, Insights and Forecast - by Fiber Type
- 5.2.1. Glass Fiber
- 5.2.2. Carbon Fiber
- 5.2.3. Other Fiber Types
- 5.3. Market Analysis, Insights and Forecast - by Application
- 5.3.1. Exterior
- 5.3.2. Interior
- 5.4. Market Analysis, Insights and Forecast - by Region
- 5.4.1. Asia Pacific
- 5.4.2. North America
- 5.4.3. Europe
- 5.4.4. Rest of the World
- 5.1. Market Analysis, Insights and Forecast - by Resin Type
- 6. Asia Pacific Rail Composites Market Analysis, Insights and Forecast, 2019-2031
- 6.1. Market Analysis, Insights and Forecast - by Resin Type
- 6.1.1. Epoxy
- 6.1.2. Polyester
- 6.1.3. Phenolic
- 6.1.4. Vinyl Ester
- 6.1.5. Other Resin Types
- 6.2. Market Analysis, Insights and Forecast - by Fiber Type
- 6.2.1. Glass Fiber
- 6.2.2. Carbon Fiber
- 6.2.3. Other Fiber Types
- 6.3. Market Analysis, Insights and Forecast - by Application
- 6.3.1. Exterior
- 6.3.2. Interior
- 6.1. Market Analysis, Insights and Forecast - by Resin Type
- 7. North America Rail Composites Market Analysis, Insights and Forecast, 2019-2031
- 7.1. Market Analysis, Insights and Forecast - by Resin Type
- 7.1.1. Epoxy
- 7.1.2. Polyester
- 7.1.3. Phenolic
- 7.1.4. Vinyl Ester
- 7.1.5. Other Resin Types
- 7.2. Market Analysis, Insights and Forecast - by Fiber Type
- 7.2.1. Glass Fiber
- 7.2.2. Carbon Fiber
- 7.2.3. Other Fiber Types
- 7.3. Market Analysis, Insights and Forecast - by Application
- 7.3.1. Exterior
- 7.3.2. Interior
- 7.1. Market Analysis, Insights and Forecast - by Resin Type
- 8. Europe Rail Composites Market Analysis, Insights and Forecast, 2019-2031
- 8.1. Market Analysis, Insights and Forecast - by Resin Type
- 8.1.1. Epoxy
- 8.1.2. Polyester
- 8.1.3. Phenolic
- 8.1.4. Vinyl Ester
- 8.1.5. Other Resin Types
- 8.2. Market Analysis, Insights and Forecast - by Fiber Type
- 8.2.1. Glass Fiber
- 8.2.2. Carbon Fiber
- 8.2.3. Other Fiber Types
- 8.3. Market Analysis, Insights and Forecast - by Application
- 8.3.1. Exterior
- 8.3.2. Interior
- 8.1. Market Analysis, Insights and Forecast - by Resin Type
- 9. Rest of the World Rail Composites Market Analysis, Insights and Forecast, 2019-2031
- 9.1. Market Analysis, Insights and Forecast - by Resin Type
- 9.1.1. Epoxy
- 9.1.2. Polyester
- 9.1.3. Phenolic
- 9.1.4. Vinyl Ester
- 9.1.5. Other Resin Types
- 9.2. Market Analysis, Insights and Forecast - by Fiber Type
- 9.2.1. Glass Fiber
- 9.2.2. Carbon Fiber
- 9.2.3. Other Fiber Types
- 9.3. Market Analysis, Insights and Forecast - by Application
- 9.3.1. Exterior
- 9.3.2. Interior
- 9.1. Market Analysis, Insights and Forecast - by Resin Type
- 10. North America Rail Composites Market Analysis, Insights and Forecast, 2019-2031
- 10.1. Market Analysis, Insights and Forecast - By Country/Sub-region
- 10.1.1 United States
- 10.1.2 Canada
- 10.1.3 Mexico
- 11. Europe Rail Composites Market Analysis, Insights and Forecast, 2019-2031
- 11.1. Market Analysis, Insights and Forecast - By Country/Sub-region
- 11.1.1 Germany
- 11.1.2 United Kingdom
- 11.1.3 France
- 11.1.4 Spain
- 11.1.5 Italy
- 11.1.6 Spain
- 11.1.7 Belgium
- 11.1.8 Netherland
- 11.1.9 Nordics
- 11.1.10 Rest of Europe
- 12. Asia Pacific Rail Composites Market Analysis, Insights and Forecast, 2019-2031
- 12.1. Market Analysis, Insights and Forecast - By Country/Sub-region
- 12.1.1 China
- 12.1.2 Japan
- 12.1.3 India
- 12.1.4 South Korea
- 12.1.5 Southeast Asia
- 12.1.6 Australia
- 12.1.7 Indonesia
- 12.1.8 Phillipes
- 12.1.9 Singapore
- 12.1.10 Thailandc
- 12.1.11 Rest of Asia Pacific
- 13. South America Rail Composites Market Analysis, Insights and Forecast, 2019-2031
- 13.1. Market Analysis, Insights and Forecast - By Country/Sub-region
- 13.1.1 Brazil
- 13.1.2 Argentina
- 13.1.3 Peru
- 13.1.4 Chile
- 13.1.5 Colombia
- 13.1.6 Ecuador
- 13.1.7 Venezuela
- 13.1.8 Rest of South America
- 14. North America Rail Composites Market Analysis, Insights and Forecast, 2019-2031
- 14.1. Market Analysis, Insights and Forecast - By Country/Sub-region
- 14.1.1 United States
- 14.1.2 Canada
- 14.1.3 Mexico
- 15. MEA Rail Composites Market Analysis, Insights and Forecast, 2019-2031
- 15.1. Market Analysis, Insights and Forecast - By Country/Sub-region
- 15.1.1 United Arab Emirates
- 15.1.2 Saudi Arabia
- 15.1.3 South Africa
- 15.1.4 Rest of Middle East and Africa
- 16. Competitive Analysis
- 16.1. Global Market Share Analysis 2024
- 16.2. Company Profiles
- 16.2.1 Solvay
- 16.2.1.1. Overview
- 16.2.1.2. Products
- 16.2.1.3. SWOT Analysis
- 16.2.1.4. Recent Developments
- 16.2.1.5. Financials (Based on Availability)
- 16.2.2 Celanese Corporation
- 16.2.2.1. Overview
- 16.2.2.2. Products
- 16.2.2.3. SWOT Analysis
- 16.2.2.4. Recent Developments
- 16.2.2.5. Financials (Based on Availability)
- 16.2.3 Avient Corporation
- 16.2.3.1. Overview
- 16.2.3.2. Products
- 16.2.3.3. SWOT Analysis
- 16.2.3.4. Recent Developments
- 16.2.3.5. Financials (Based on Availability)
- 16.2.4 Reliance Industries Limited
- 16.2.4.1. Overview
- 16.2.4.2. Products
- 16.2.4.3. SWOT Analysis
- 16.2.4.4. Recent Developments
- 16.2.4.5. Financials (Based on Availability)
- 16.2.5 Exel Composites
- 16.2.5.1. Overview
- 16.2.5.2. Products
- 16.2.5.3. SWOT Analysis
- 16.2.5.4. Recent Developments
- 16.2.5.5. Financials (Based on Availability)
- 16.2.6 LANXESS
- 16.2.6.1. Overview
- 16.2.6.2. Products
- 16.2.6.3. SWOT Analysis
- 16.2.6.4. Recent Developments
- 16.2.6.5. Financials (Based on Availability)
- 16.2.7 BASF SE
- 16.2.7.1. Overview
- 16.2.7.2. Products
- 16.2.7.3. SWOT Analysis
- 16.2.7.4. Recent Developments
- 16.2.7.5. Financials (Based on Availability)
- 16.2.8 Kineco Limited
- 16.2.8.1. Overview
- 16.2.8.2. Products
- 16.2.8.3. SWOT Analysis
- 16.2.8.4. Recent Developments
- 16.2.8.5. Financials (Based on Availability)
- 16.2.9 Toray Industries Inc
- 16.2.9.1. Overview
- 16.2.9.2. Products
- 16.2.9.3. SWOT Analysis
- 16.2.9.4. Recent Developments
- 16.2.9.5. Financials (Based on Availability)
- 16.2.10 Hexcel Corporation
- 16.2.10.1. Overview
- 16.2.10.2. Products
- 16.2.10.3. SWOT Analysis
- 16.2.10.4. Recent Developments
- 16.2.10.5. Financials (Based on Availability)
- 16.2.11 Gurit
- 16.2.11.1. Overview
- 16.2.11.2. Products
- 16.2.11.3. SWOT Analysis
- 16.2.11.4. Recent Developments
- 16.2.11.5. Financials (Based on Availability)
- 16.2.12 TEIJIN LIMITED
- 16.2.12.1. Overview
- 16.2.12.2. Products
- 16.2.12.3. SWOT Analysis
- 16.2.12.4. Recent Developments
- 16.2.12.5. Financials (Based on Availability)
- 16.2.13 Mitsubishi Chemical Advanced Materials
- 16.2.13.1. Overview
- 16.2.13.2. Products
- 16.2.13.3. SWOT Analysis
- 16.2.13.4. Recent Developments
- 16.2.13.5. Financials (Based on Availability)
- 16.2.1 Solvay
List of Figures
- Figure 1: Global Rail Composites Market Revenue Breakdown (Million, %) by Region 2024 & 2032
- Figure 2: Global Rail Composites Market Volume Breakdown (K Tons, %) by Region 2024 & 2032
- Figure 3: North America Rail Composites Market Revenue (Million), by Country 2024 & 2032
- Figure 4: North America Rail Composites Market Volume (K Tons), by Country 2024 & 2032
- Figure 5: North America Rail Composites Market Revenue Share (%), by Country 2024 & 2032
- Figure 6: North America Rail Composites Market Volume Share (%), by Country 2024 & 2032
- Figure 7: Europe Rail Composites Market Revenue (Million), by Country 2024 & 2032
- Figure 8: Europe Rail Composites Market Volume (K Tons), by Country 2024 & 2032
- Figure 9: Europe Rail Composites Market Revenue Share (%), by Country 2024 & 2032
- Figure 10: Europe Rail Composites Market Volume Share (%), by Country 2024 & 2032
- Figure 11: Asia Pacific Rail Composites Market Revenue (Million), by Country 2024 & 2032
- Figure 12: Asia Pacific Rail Composites Market Volume (K Tons), by Country 2024 & 2032
- Figure 13: Asia Pacific Rail Composites Market Revenue Share (%), by Country 2024 & 2032
- Figure 14: Asia Pacific Rail Composites Market Volume Share (%), by Country 2024 & 2032
- Figure 15: South America Rail Composites Market Revenue (Million), by Country 2024 & 2032
- Figure 16: South America Rail Composites Market Volume (K Tons), by Country 2024 & 2032
- Figure 17: South America Rail Composites Market Revenue Share (%), by Country 2024 & 2032
- Figure 18: South America Rail Composites Market Volume Share (%), by Country 2024 & 2032
- Figure 19: North America Rail Composites Market Revenue (Million), by Country 2024 & 2032
- Figure 20: North America Rail Composites Market Volume (K Tons), by Country 2024 & 2032
- Figure 21: North America Rail Composites Market Revenue Share (%), by Country 2024 & 2032
- Figure 22: North America Rail Composites Market Volume Share (%), by Country 2024 & 2032
- Figure 23: MEA Rail Composites Market Revenue (Million), by Country 2024 & 2032
- Figure 24: MEA Rail Composites Market Volume (K Tons), by Country 2024 & 2032
- Figure 25: MEA Rail Composites Market Revenue Share (%), by Country 2024 & 2032
- Figure 26: MEA Rail Composites Market Volume Share (%), by Country 2024 & 2032
- Figure 27: Asia Pacific Rail Composites Market Revenue (Million), by Resin Type 2024 & 2032
- Figure 28: Asia Pacific Rail Composites Market Volume (K Tons), by Resin Type 2024 & 2032
- Figure 29: Asia Pacific Rail Composites Market Revenue Share (%), by Resin Type 2024 & 2032
- Figure 30: Asia Pacific Rail Composites Market Volume Share (%), by Resin Type 2024 & 2032
- Figure 31: Asia Pacific Rail Composites Market Revenue (Million), by Fiber Type 2024 & 2032
- Figure 32: Asia Pacific Rail Composites Market Volume (K Tons), by Fiber Type 2024 & 2032
- Figure 33: Asia Pacific Rail Composites Market Revenue Share (%), by Fiber Type 2024 & 2032
- Figure 34: Asia Pacific Rail Composites Market Volume Share (%), by Fiber Type 2024 & 2032
- Figure 35: Asia Pacific Rail Composites Market Revenue (Million), by Application 2024 & 2032
- Figure 36: Asia Pacific Rail Composites Market Volume (K Tons), by Application 2024 & 2032
- Figure 37: Asia Pacific Rail Composites Market Revenue Share (%), by Application 2024 & 2032
- Figure 38: Asia Pacific Rail Composites Market Volume Share (%), by Application 2024 & 2032
- Figure 39: Asia Pacific Rail Composites Market Revenue (Million), by Country 2024 & 2032
- Figure 40: Asia Pacific Rail Composites Market Volume (K Tons), by Country 2024 & 2032
- Figure 41: Asia Pacific Rail Composites Market Revenue Share (%), by Country 2024 & 2032
- Figure 42: Asia Pacific Rail Composites Market Volume Share (%), by Country 2024 & 2032
- Figure 43: North America Rail Composites Market Revenue (Million), by Resin Type 2024 & 2032
- Figure 44: North America Rail Composites Market Volume (K Tons), by Resin Type 2024 & 2032
- Figure 45: North America Rail Composites Market Revenue Share (%), by Resin Type 2024 & 2032
- Figure 46: North America Rail Composites Market Volume Share (%), by Resin Type 2024 & 2032
- Figure 47: North America Rail Composites Market Revenue (Million), by Fiber Type 2024 & 2032
- Figure 48: North America Rail Composites Market Volume (K Tons), by Fiber Type 2024 & 2032
- Figure 49: North America Rail Composites Market Revenue Share (%), by Fiber Type 2024 & 2032
- Figure 50: North America Rail Composites Market Volume Share (%), by Fiber Type 2024 & 2032
- Figure 51: North America Rail Composites Market Revenue (Million), by Application 2024 & 2032
- Figure 52: North America Rail Composites Market Volume (K Tons), by Application 2024 & 2032
- Figure 53: North America Rail Composites Market Revenue Share (%), by Application 2024 & 2032
- Figure 54: North America Rail Composites Market Volume Share (%), by Application 2024 & 2032
- Figure 55: North America Rail Composites Market Revenue (Million), by Country 2024 & 2032
- Figure 56: North America Rail Composites Market Volume (K Tons), by Country 2024 & 2032
- Figure 57: North America Rail Composites Market Revenue Share (%), by Country 2024 & 2032
- Figure 58: North America Rail Composites Market Volume Share (%), by Country 2024 & 2032
- Figure 59: Europe Rail Composites Market Revenue (Million), by Resin Type 2024 & 2032
- Figure 60: Europe Rail Composites Market Volume (K Tons), by Resin Type 2024 & 2032
- Figure 61: Europe Rail Composites Market Revenue Share (%), by Resin Type 2024 & 2032
- Figure 62: Europe Rail Composites Market Volume Share (%), by Resin Type 2024 & 2032
- Figure 63: Europe Rail Composites Market Revenue (Million), by Fiber Type 2024 & 2032
- Figure 64: Europe Rail Composites Market Volume (K Tons), by Fiber Type 2024 & 2032
- Figure 65: Europe Rail Composites Market Revenue Share (%), by Fiber Type 2024 & 2032
- Figure 66: Europe Rail Composites Market Volume Share (%), by Fiber Type 2024 & 2032
- Figure 67: Europe Rail Composites Market Revenue (Million), by Application 2024 & 2032
- Figure 68: Europe Rail Composites Market Volume (K Tons), by Application 2024 & 2032
- Figure 69: Europe Rail Composites Market Revenue Share (%), by Application 2024 & 2032
- Figure 70: Europe Rail Composites Market Volume Share (%), by Application 2024 & 2032
- Figure 71: Europe Rail Composites Market Revenue (Million), by Country 2024 & 2032
- Figure 72: Europe Rail Composites Market Volume (K Tons), by Country 2024 & 2032
- Figure 73: Europe Rail Composites Market Revenue Share (%), by Country 2024 & 2032
- Figure 74: Europe Rail Composites Market Volume Share (%), by Country 2024 & 2032
- Figure 75: Rest of the World Rail Composites Market Revenue (Million), by Resin Type 2024 & 2032
- Figure 76: Rest of the World Rail Composites Market Volume (K Tons), by Resin Type 2024 & 2032
- Figure 77: Rest of the World Rail Composites Market Revenue Share (%), by Resin Type 2024 & 2032
- Figure 78: Rest of the World Rail Composites Market Volume Share (%), by Resin Type 2024 & 2032
- Figure 79: Rest of the World Rail Composites Market Revenue (Million), by Fiber Type 2024 & 2032
- Figure 80: Rest of the World Rail Composites Market Volume (K Tons), by Fiber Type 2024 & 2032
- Figure 81: Rest of the World Rail Composites Market Revenue Share (%), by Fiber Type 2024 & 2032
- Figure 82: Rest of the World Rail Composites Market Volume Share (%), by Fiber Type 2024 & 2032
- Figure 83: Rest of the World Rail Composites Market Revenue (Million), by Application 2024 & 2032
- Figure 84: Rest of the World Rail Composites Market Volume (K Tons), by Application 2024 & 2032
- Figure 85: Rest of the World Rail Composites Market Revenue Share (%), by Application 2024 & 2032
- Figure 86: Rest of the World Rail Composites Market Volume Share (%), by Application 2024 & 2032
- Figure 87: Rest of the World Rail Composites Market Revenue (Million), by Country 2024 & 2032
- Figure 88: Rest of the World Rail Composites Market Volume (K Tons), by Country 2024 & 2032
- Figure 89: Rest of the World Rail Composites Market Revenue Share (%), by Country 2024 & 2032
- Figure 90: Rest of the World Rail Composites Market Volume Share (%), by Country 2024 & 2032
List of Tables
- Table 1: Global Rail Composites Market Revenue Million Forecast, by Region 2019 & 2032
- Table 2: Global Rail Composites Market Volume K Tons Forecast, by Region 2019 & 2032
- Table 3: Global Rail Composites Market Revenue Million Forecast, by Resin Type 2019 & 2032
- Table 4: Global Rail Composites Market Volume K Tons Forecast, by Resin Type 2019 & 2032
- Table 5: Global Rail Composites Market Revenue Million Forecast, by Fiber Type 2019 & 2032
- Table 6: Global Rail Composites Market Volume K Tons Forecast, by Fiber Type 2019 & 2032
- Table 7: Global Rail Composites Market Revenue Million Forecast, by Application 2019 & 2032
- Table 8: Global Rail Composites Market Volume K Tons Forecast, by Application 2019 & 2032
- Table 9: Global Rail Composites Market Revenue Million Forecast, by Region 2019 & 2032
- Table 10: Global Rail Composites Market Volume K Tons Forecast, by Region 2019 & 2032
- Table 11: Global Rail Composites Market Revenue Million Forecast, by Country 2019 & 2032
- Table 12: Global Rail Composites Market Volume K Tons Forecast, by Country 2019 & 2032
- Table 13: United States Rail Composites Market Revenue (Million) Forecast, by Application 2019 & 2032
- Table 14: United States Rail Composites Market Volume (K Tons) Forecast, by Application 2019 & 2032
- Table 15: Canada Rail Composites Market Revenue (Million) Forecast, by Application 2019 & 2032
- Table 16: Canada Rail Composites Market Volume (K Tons) Forecast, by Application 2019 & 2032
- Table 17: Mexico Rail Composites Market Revenue (Million) Forecast, by Application 2019 & 2032
- Table 18: Mexico Rail Composites Market Volume (K Tons) Forecast, by Application 2019 & 2032
- Table 19: Global Rail Composites Market Revenue Million Forecast, by Country 2019 & 2032
- Table 20: Global Rail Composites Market Volume K Tons Forecast, by Country 2019 & 2032
- Table 21: Germany Rail Composites Market Revenue (Million) Forecast, by Application 2019 & 2032
- Table 22: Germany Rail Composites Market Volume (K Tons) Forecast, by Application 2019 & 2032
- Table 23: United Kingdom Rail Composites Market Revenue (Million) Forecast, by Application 2019 & 2032
- Table 24: United Kingdom Rail Composites Market Volume (K Tons) Forecast, by Application 2019 & 2032
- Table 25: France Rail Composites Market Revenue (Million) Forecast, by Application 2019 & 2032
- Table 26: France Rail Composites Market Volume (K Tons) Forecast, by Application 2019 & 2032
- Table 27: Spain Rail Composites Market Revenue (Million) Forecast, by Application 2019 & 2032
- Table 28: Spain Rail Composites Market Volume (K Tons) Forecast, by Application 2019 & 2032
- Table 29: Italy Rail Composites Market Revenue (Million) Forecast, by Application 2019 & 2032
- Table 30: Italy Rail Composites Market Volume (K Tons) Forecast, by Application 2019 & 2032
- Table 31: Spain Rail Composites Market Revenue (Million) Forecast, by Application 2019 & 2032
- Table 32: Spain Rail Composites Market Volume (K Tons) Forecast, by Application 2019 & 2032
- Table 33: Belgium Rail Composites Market Revenue (Million) Forecast, by Application 2019 & 2032
- Table 34: Belgium Rail Composites Market Volume (K Tons) Forecast, by Application 2019 & 2032
- Table 35: Netherland Rail Composites Market Revenue (Million) Forecast, by Application 2019 & 2032
- Table 36: Netherland Rail Composites Market Volume (K Tons) Forecast, by Application 2019 & 2032
- Table 37: Nordics Rail Composites Market Revenue (Million) Forecast, by Application 2019 & 2032
- Table 38: Nordics Rail Composites Market Volume (K Tons) Forecast, by Application 2019 & 2032
- Table 39: Rest of Europe Rail Composites Market Revenue (Million) Forecast, by Application 2019 & 2032
- Table 40: Rest of Europe Rail Composites Market Volume (K Tons) Forecast, by Application 2019 & 2032
- Table 41: Global Rail Composites Market Revenue Million Forecast, by Country 2019 & 2032
- Table 42: Global Rail Composites Market Volume K Tons Forecast, by Country 2019 & 2032
- Table 43: China Rail Composites Market Revenue (Million) Forecast, by Application 2019 & 2032
- Table 44: China Rail Composites Market Volume (K Tons) Forecast, by Application 2019 & 2032
- Table 45: Japan Rail Composites Market Revenue (Million) Forecast, by Application 2019 & 2032
- Table 46: Japan Rail Composites Market Volume (K Tons) Forecast, by Application 2019 & 2032
- Table 47: India Rail Composites Market Revenue (Million) Forecast, by Application 2019 & 2032
- Table 48: India Rail Composites Market Volume (K Tons) Forecast, by Application 2019 & 2032
- Table 49: South Korea Rail Composites Market Revenue (Million) Forecast, by Application 2019 & 2032
- Table 50: South Korea Rail Composites Market Volume (K Tons) Forecast, by Application 2019 & 2032
- Table 51: Southeast Asia Rail Composites Market Revenue (Million) Forecast, by Application 2019 & 2032
- Table 52: Southeast Asia Rail Composites Market Volume (K Tons) Forecast, by Application 2019 & 2032
- Table 53: Australia Rail Composites Market Revenue (Million) Forecast, by Application 2019 & 2032
- Table 54: Australia Rail Composites Market Volume (K Tons) Forecast, by Application 2019 & 2032
- Table 55: Indonesia Rail Composites Market Revenue (Million) Forecast, by Application 2019 & 2032
- Table 56: Indonesia Rail Composites Market Volume (K Tons) Forecast, by Application 2019 & 2032
- Table 57: Phillipes Rail Composites Market Revenue (Million) Forecast, by Application 2019 & 2032
- Table 58: Phillipes Rail Composites Market Volume (K Tons) Forecast, by Application 2019 & 2032
- Table 59: Singapore Rail Composites Market Revenue (Million) Forecast, by Application 2019 & 2032
- Table 60: Singapore Rail Composites Market Volume (K Tons) Forecast, by Application 2019 & 2032
- Table 61: Thailandc Rail Composites Market Revenue (Million) Forecast, by Application 2019 & 2032
- Table 62: Thailandc Rail Composites Market Volume (K Tons) Forecast, by Application 2019 & 2032
- Table 63: Rest of Asia Pacific Rail Composites Market Revenue (Million) Forecast, by Application 2019 & 2032
- Table 64: Rest of Asia Pacific Rail Composites Market Volume (K Tons) Forecast, by Application 2019 & 2032
- Table 65: Global Rail Composites Market Revenue Million Forecast, by Country 2019 & 2032
- Table 66: Global Rail Composites Market Volume K Tons Forecast, by Country 2019 & 2032
- Table 67: Brazil Rail Composites Market Revenue (Million) Forecast, by Application 2019 & 2032
- Table 68: Brazil Rail Composites Market Volume (K Tons) Forecast, by Application 2019 & 2032
- Table 69: Argentina Rail Composites Market Revenue (Million) Forecast, by Application 2019 & 2032
- Table 70: Argentina Rail Composites Market Volume (K Tons) Forecast, by Application 2019 & 2032
- Table 71: Peru Rail Composites Market Revenue (Million) Forecast, by Application 2019 & 2032
- Table 72: Peru Rail Composites Market Volume (K Tons) Forecast, by Application 2019 & 2032
- Table 73: Chile Rail Composites Market Revenue (Million) Forecast, by Application 2019 & 2032
- Table 74: Chile Rail Composites Market Volume (K Tons) Forecast, by Application 2019 & 2032
- Table 75: Colombia Rail Composites Market Revenue (Million) Forecast, by Application 2019 & 2032
- Table 76: Colombia Rail Composites Market Volume (K Tons) Forecast, by Application 2019 & 2032
- Table 77: Ecuador Rail Composites Market Revenue (Million) Forecast, by Application 2019 & 2032
- Table 78: Ecuador Rail Composites Market Volume (K Tons) Forecast, by Application 2019 & 2032
- Table 79: Venezuela Rail Composites Market Revenue (Million) Forecast, by Application 2019 & 2032
- Table 80: Venezuela Rail Composites Market Volume (K Tons) Forecast, by Application 2019 & 2032
- Table 81: Rest of South America Rail Composites Market Revenue (Million) Forecast, by Application 2019 & 2032
- Table 82: Rest of South America Rail Composites Market Volume (K Tons) Forecast, by Application 2019 & 2032
- Table 83: Global Rail Composites Market Revenue Million Forecast, by Country 2019 & 2032
- Table 84: Global Rail Composites Market Volume K Tons Forecast, by Country 2019 & 2032
- Table 85: United States Rail Composites Market Revenue (Million) Forecast, by Application 2019 & 2032
- Table 86: United States Rail Composites Market Volume (K Tons) Forecast, by Application 2019 & 2032
- Table 87: Canada Rail Composites Market Revenue (Million) Forecast, by Application 2019 & 2032
- Table 88: Canada Rail Composites Market Volume (K Tons) Forecast, by Application 2019 & 2032
- Table 89: Mexico Rail Composites Market Revenue (Million) Forecast, by Application 2019 & 2032
- Table 90: Mexico Rail Composites Market Volume (K Tons) Forecast, by Application 2019 & 2032
- Table 91: Global Rail Composites Market Revenue Million Forecast, by Country 2019 & 2032
- Table 92: Global Rail Composites Market Volume K Tons Forecast, by Country 2019 & 2032
- Table 93: United Arab Emirates Rail Composites Market Revenue (Million) Forecast, by Application 2019 & 2032
- Table 94: United Arab Emirates Rail Composites Market Volume (K Tons) Forecast, by Application 2019 & 2032
- Table 95: Saudi Arabia Rail Composites Market Revenue (Million) Forecast, by Application 2019 & 2032
- Table 96: Saudi Arabia Rail Composites Market Volume (K Tons) Forecast, by Application 2019 & 2032
- Table 97: South Africa Rail Composites Market Revenue (Million) Forecast, by Application 2019 & 2032
- Table 98: South Africa Rail Composites Market Volume (K Tons) Forecast, by Application 2019 & 2032
- Table 99: Rest of Middle East and Africa Rail Composites Market Revenue (Million) Forecast, by Application 2019 & 2032
- Table 100: Rest of Middle East and Africa Rail Composites Market Volume (K Tons) Forecast, by Application 2019 & 2032
- Table 101: Global Rail Composites Market Revenue Million Forecast, by Resin Type 2019 & 2032
- Table 102: Global Rail Composites Market Volume K Tons Forecast, by Resin Type 2019 & 2032
- Table 103: Global Rail Composites Market Revenue Million Forecast, by Fiber Type 2019 & 2032
- Table 104: Global Rail Composites Market Volume K Tons Forecast, by Fiber Type 2019 & 2032
- Table 105: Global Rail Composites Market Revenue Million Forecast, by Application 2019 & 2032
- Table 106: Global Rail Composites Market Volume K Tons Forecast, by Application 2019 & 2032
- Table 107: Global Rail Composites Market Revenue Million Forecast, by Country 2019 & 2032
- Table 108: Global Rail Composites Market Volume K Tons Forecast, by Country 2019 & 2032
- Table 109: China Rail Composites Market Revenue (Million) Forecast, by Application 2019 & 2032
- Table 110: China Rail Composites Market Volume (K Tons) Forecast, by Application 2019 & 2032
- Table 111: India Rail Composites Market Revenue (Million) Forecast, by Application 2019 & 2032
- Table 112: India Rail Composites Market Volume (K Tons) Forecast, by Application 2019 & 2032
- Table 113: Japan Rail Composites Market Revenue (Million) Forecast, by Application 2019 & 2032
- Table 114: Japan Rail Composites Market Volume (K Tons) Forecast, by Application 2019 & 2032
- Table 115: South Korea Rail Composites Market Revenue (Million) Forecast, by Application 2019 & 2032
- Table 116: South Korea Rail Composites Market Volume (K Tons) Forecast, by Application 2019 & 2032
- Table 117: Rest of Asia Pacific Rail Composites Market Revenue (Million) Forecast, by Application 2019 & 2032
- Table 118: Rest of Asia Pacific Rail Composites Market Volume (K Tons) Forecast, by Application 2019 & 2032
- Table 119: Global Rail Composites Market Revenue Million Forecast, by Resin Type 2019 & 2032
- Table 120: Global Rail Composites Market Volume K Tons Forecast, by Resin Type 2019 & 2032
- Table 121: Global Rail Composites Market Revenue Million Forecast, by Fiber Type 2019 & 2032
- Table 122: Global Rail Composites Market Volume K Tons Forecast, by Fiber Type 2019 & 2032
- Table 123: Global Rail Composites Market Revenue Million Forecast, by Application 2019 & 2032
- Table 124: Global Rail Composites Market Volume K Tons Forecast, by Application 2019 & 2032
- Table 125: Global Rail Composites Market Revenue Million Forecast, by Country 2019 & 2032
- Table 126: Global Rail Composites Market Volume K Tons Forecast, by Country 2019 & 2032
- Table 127: United States Rail Composites Market Revenue (Million) Forecast, by Application 2019 & 2032
- Table 128: United States Rail Composites Market Volume (K Tons) Forecast, by Application 2019 & 2032
- Table 129: Canada Rail Composites Market Revenue (Million) Forecast, by Application 2019 & 2032
- Table 130: Canada Rail Composites Market Volume (K Tons) Forecast, by Application 2019 & 2032
- Table 131: Mexico Rail Composites Market Revenue (Million) Forecast, by Application 2019 & 2032
- Table 132: Mexico Rail Composites Market Volume (K Tons) Forecast, by Application 2019 & 2032
- Table 133: Global Rail Composites Market Revenue Million Forecast, by Resin Type 2019 & 2032
- Table 134: Global Rail Composites Market Volume K Tons Forecast, by Resin Type 2019 & 2032
- Table 135: Global Rail Composites Market Revenue Million Forecast, by Fiber Type 2019 & 2032
- Table 136: Global Rail Composites Market Volume K Tons Forecast, by Fiber Type 2019 & 2032
- Table 137: Global Rail Composites Market Revenue Million Forecast, by Application 2019 & 2032
- Table 138: Global Rail Composites Market Volume K Tons Forecast, by Application 2019 & 2032
- Table 139: Global Rail Composites Market Revenue Million Forecast, by Country 2019 & 2032
- Table 140: Global Rail Composites Market Volume K Tons Forecast, by Country 2019 & 2032
- Table 141: Germany Rail Composites Market Revenue (Million) Forecast, by Application 2019 & 2032
- Table 142: Germany Rail Composites Market Volume (K Tons) Forecast, by Application 2019 & 2032
- Table 143: United Kingdom Rail Composites Market Revenue (Million) Forecast, by Application 2019 & 2032
- Table 144: United Kingdom Rail Composites Market Volume (K Tons) Forecast, by Application 2019 & 2032
- Table 145: Italy Rail Composites Market Revenue (Million) Forecast, by Application 2019 & 2032
- Table 146: Italy Rail Composites Market Volume (K Tons) Forecast, by Application 2019 & 2032
- Table 147: France Rail Composites Market Revenue (Million) Forecast, by Application 2019 & 2032
- Table 148: France Rail Composites Market Volume (K Tons) Forecast, by Application 2019 & 2032
- Table 149: Rest of Europe Rail Composites Market Revenue (Million) Forecast, by Application 2019 & 2032
- Table 150: Rest of Europe Rail Composites Market Volume (K Tons) Forecast, by Application 2019 & 2032
- Table 151: Global Rail Composites Market Revenue Million Forecast, by Resin Type 2019 & 2032
- Table 152: Global Rail Composites Market Volume K Tons Forecast, by Resin Type 2019 & 2032
- Table 153: Global Rail Composites Market Revenue Million Forecast, by Fiber Type 2019 & 2032
- Table 154: Global Rail Composites Market Volume K Tons Forecast, by Fiber Type 2019 & 2032
- Table 155: Global Rail Composites Market Revenue Million Forecast, by Application 2019 & 2032
- Table 156: Global Rail Composites Market Volume K Tons Forecast, by Application 2019 & 2032
- Table 157: Global Rail Composites Market Revenue Million Forecast, by Country 2019 & 2032
- Table 158: Global Rail Composites Market Volume K Tons Forecast, by Country 2019 & 2032
Frequently Asked Questions
1. What is the projected Compound Annual Growth Rate (CAGR) of the Rail Composites Market?
The projected CAGR is approximately > 5.00%.
2. Which companies are prominent players in the Rail Composites Market?
Key companies in the market include Solvay, Celanese Corporation, Avient Corporation, Reliance Industries Limited, Exel Composites, LANXESS, BASF SE, Kineco Limited, Toray Industries Inc , Hexcel Corporation, Gurit, TEIJIN LIMITED, Mitsubishi Chemical Advanced Materials.
3. What are the main segments of the Rail Composites Market?
The market segments include Resin Type, Fiber Type, Application.
4. Can you provide details about the market size?
The market size is estimated to be USD XX Million as of 2022.
5. What are some drivers contributing to market growth?
Increasing Railway Projects in the Asia-Pacific Region; Rapidly Increasing Demand for High-speed Rail.
6. What are the notable trends driving market growth?
Exterior Application to Dominate the Market.
7. Are there any restraints impacting market growth?
Lack of Railway Infrastructure in Vietnam. Indonesia. and Thailand; Restrictions on Composite Materials for Railway Application.
8. Can you provide examples of recent developments in the market?
In May 2021, Celanese announced its plan to initiate a three-year plan to expand its LFT (long-fiber thermoplastics ) capacity in Nanjing, China. This is expected to be completed by the second half of 2023.
9. What pricing options are available for accessing the report?
Pricing options include single-user, multi-user, and enterprise licenses priced at USD 4750, USD 5250, and USD 8750 respectively.
10. Is the market size provided in terms of value or volume?
The market size is provided in terms of value, measured in Million and volume, measured in K Tons.
11. Are there any specific market keywords associated with the report?
Yes, the market keyword associated with the report is "Rail Composites Market," which aids in identifying and referencing the specific market segment covered.
12. How do I determine which pricing option suits my needs best?
The pricing options vary based on user requirements and access needs. Individual users may opt for single-user licenses, while businesses requiring broader access may choose multi-user or enterprise licenses for cost-effective access to the report.
13. Are there any additional resources or data provided in the Rail Composites Market report?
While the report offers comprehensive insights, it's advisable to review the specific contents or supplementary materials provided to ascertain if additional resources or data are available.
14. How can I stay updated on further developments or reports in the Rail Composites Market?
To stay informed about further developments, trends, and reports in the Rail Composites Market, consider subscribing to industry newsletters, following relevant companies and organizations, or regularly checking reputable industry news sources and publications.
Methodology
Step 1 - Identification of Relevant Samples Size from Population Database


Step 2 - Approaches for Defining Global Market Size (Value, Volume* & Price*)

Note*: In applicable scenarios
Step 3 - Data Sources
Primary Research
- Web Analytics
- Survey Reports
- Research Institute
- Latest Research Reports
- Opinion Leaders
Secondary Research
- Annual Reports
- White Paper
- Latest Press Release
- Industry Association
- Paid Database
- Investor Presentations

Step 4 - Data Triangulation
Involves using different sources of information in order to increase the validity of a study
These sources are likely to be stakeholders in a program - participants, other researchers, program staff, other community members, and so on.
Then we put all data in single framework & apply various statistical tools to find out the dynamic on the market.
During the analysis stage, feedback from the stakeholder groups would be compared to determine areas of agreement as well as areas of divergence


