

Key Insights
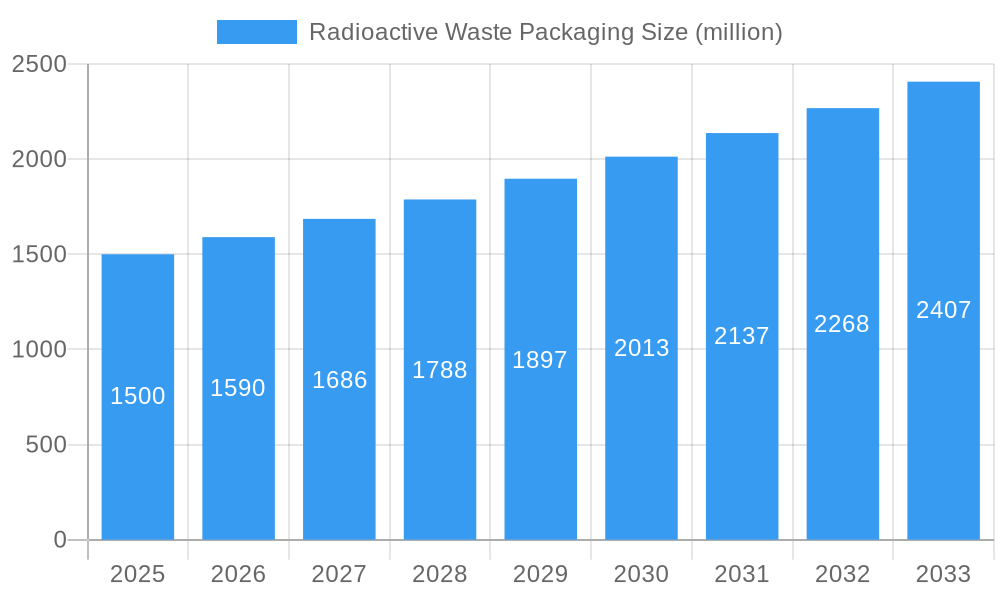
The radioactive waste packaging market is experiencing robust growth, driven by the increasing generation of nuclear waste from power plants and medical facilities globally. The market, estimated at $1.5 billion in 2025, is projected to exhibit a Compound Annual Growth Rate (CAGR) of 6% from 2025 to 2033, reaching an estimated value of $2.5 billion by 2033. This expansion is fueled by stringent regulations regarding the safe transportation and disposal of radioactive materials, necessitating robust and specialized packaging solutions. Furthermore, advancements in packaging materials and technologies, such as the development of more durable and resistant containers, are contributing to market growth. The rising demand for advanced packaging solutions capable of withstanding extreme conditions and ensuring the long-term containment of radioactive waste is a key market driver. Geographic expansion into developing nations with increasing nuclear energy infrastructure will further boost the market. However, challenges remain, including high initial investment costs associated with specialized packaging and the ongoing need for rigorous quality control and safety measures.
Radioactive Waste Packaging Market Size (In Billion)
Competitive landscape analysis reveals a mix of established players like Westinghouse Electric Company and BWX Technologies, Inc. (BWXT), alongside specialized packaging companies such as PacTec and Strategic Packaging Systems. These companies are focusing on innovation, strategic partnerships, and geographic expansion to maintain a competitive edge. The market is segmented by material type (e.g., steel, lead, concrete), packaging type (e.g., containers, casks), and application (e.g., nuclear power plants, research facilities, medical facilities). North America and Europe currently dominate the market, but Asia-Pacific is expected to witness significant growth in the coming years driven by the increasing nuclear energy adoption in the region. The market's future trajectory hinges on factors such as the global nuclear energy landscape, regulatory changes, and technological advancements in radioactive waste management practices.
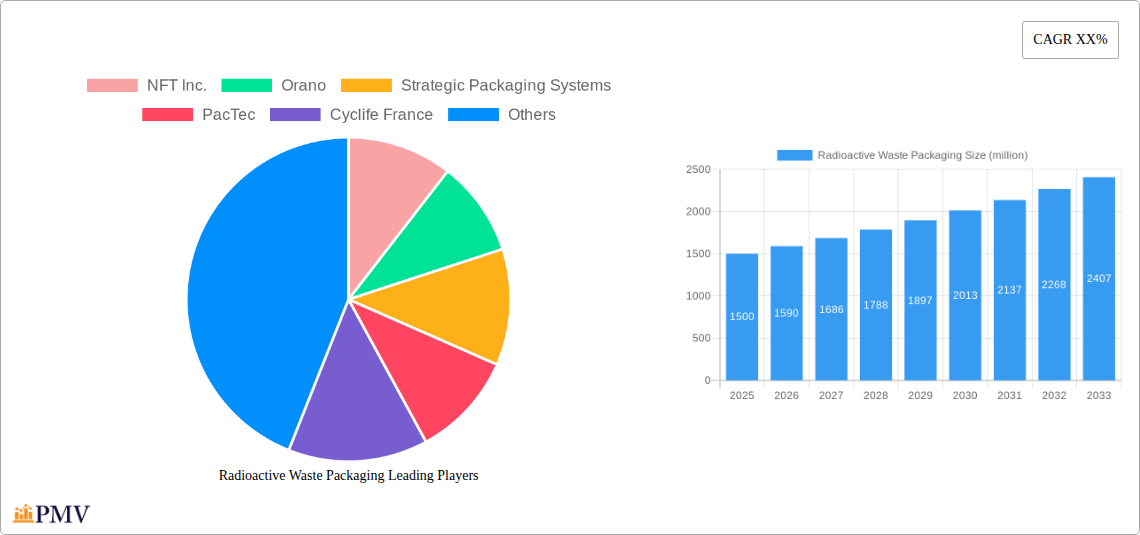
Radioactive Waste Packaging Company Market Share
Radioactive Waste Packaging Market Report: 2019-2033
This comprehensive report provides an in-depth analysis of the global radioactive waste packaging market, offering invaluable insights for industry stakeholders, investors, and researchers. The study period covers 2019-2033, with 2025 serving as the base and estimated year. The forecast period spans 2025-2033, and the historical period encompasses 2019-2024. The report meticulously examines market dynamics, competitive landscapes, and future growth prospects, incorporating detailed segmentation and insightful analysis of key players. The market is projected to reach xx million by 2033, exhibiting a CAGR of xx% during the forecast period.
Radioactive Waste Packaging Market Structure & Competitive Dynamics
The global radioactive waste packaging market exhibits a moderately consolidated structure, with several key players holding significant market share. NFT Inc., Orano, Strategic Packaging Systems, and PacTec are among the leading companies, collectively accounting for approximately xx% of the market in 2025. Market concentration is influenced by factors such as stringent regulatory frameworks, technological expertise, and established supply chains. Innovation ecosystems are primarily driven by collaborations between research institutions, packaging manufacturers, and nuclear waste management organizations. Product substitutes are limited due to the specialized nature of radioactive waste packaging, emphasizing the need for high safety and durability standards. End-user trends are shifting towards sustainable and cost-effective solutions, prompting companies to invest in advanced materials and design technologies.
Mergers and acquisitions (M&A) activity within the sector has been moderate, with several strategic partnerships formed to enhance technological capabilities and expand market reach. Significant M&A deals during the historical period involved a total transaction value of approximately $xx million. These transactions primarily focused on consolidating market share, accessing new technologies, and expanding geographical reach. The ongoing regulatory scrutiny and need for specialized expertise acts as barriers to entry for new players.
- Market Concentration: Moderately Consolidated
- Top 4 Players Market Share (2025): xx%
- Total M&A Deal Value (2019-2024): $xx million
Radioactive Waste Packaging Industry Trends & Insights
The radioactive waste packaging market is experiencing robust growth, driven by increasing nuclear power generation globally, the growing need for safe and secure transportation of radioactive materials, and stringent regulatory compliance mandates. Technological advancements, including the development of advanced materials with enhanced radiation shielding capabilities and improved handling systems, are further propelling market expansion. Consumer preferences are increasingly focused on sustainable and environmentally friendly packaging solutions, leading to the adoption of recyclable and reusable materials.
The market is characterized by intense competition, with companies focusing on product differentiation, technological innovation, and cost optimization strategies. The market's growth is anticipated to be fueled by investments in nuclear power infrastructure, advancements in waste management technologies, and stringent regulations regarding the safe handling and disposal of radioactive waste. This is leading to an increased demand for robust and reliable packaging solutions. The market penetration of advanced packaging technologies is expected to increase significantly in the forecast period, driven by their enhanced safety and efficiency features.
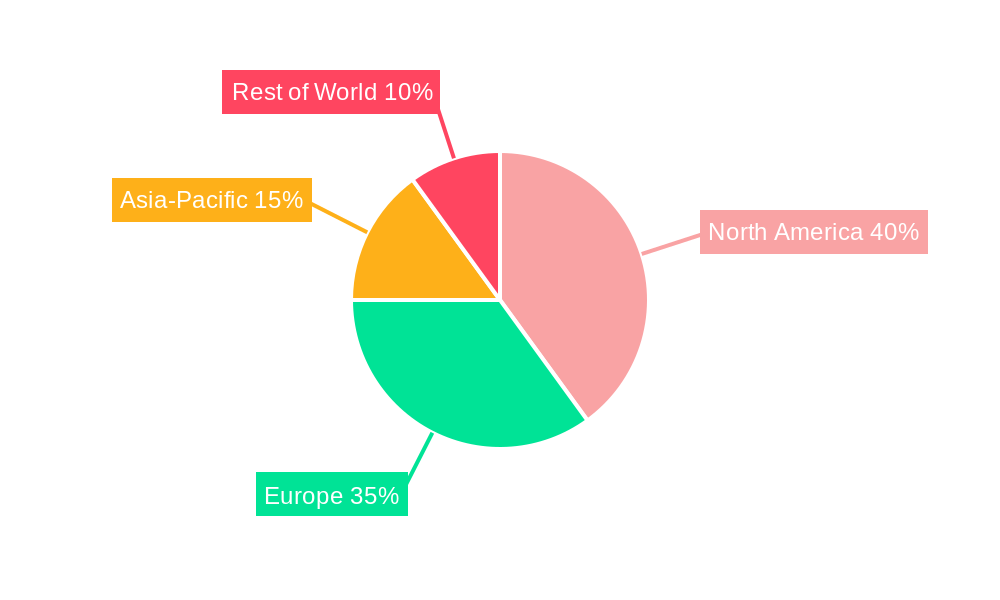
Dominant Markets & Segments in Radioactive Waste Packaging
The North American region currently holds the largest market share in radioactive waste packaging, driven by the substantial nuclear power infrastructure and stringent regulations. Other key regions include Europe and Asia-Pacific, showcasing steady growth potential.
- North America (Dominant Region):
- Key Drivers: Large nuclear power generation capacity, stringent safety regulations, significant investments in waste management infrastructure.
- Europe:
- Key Drivers: Growing focus on nuclear waste management, increasing adoption of advanced packaging technologies, regulatory compliance needs.
- Asia-Pacific:
- Key Drivers: Expanding nuclear power industry, increasing demand for safe transportation solutions, government support for infrastructure development.
The market is segmented by material type (steel, concrete, polymer composites), packaging type (drums, containers, casks), and waste type (low-level, intermediate-level, high-level). The high-level waste segment is projected to experience the highest growth rate owing to the increasing complexity and stringent safety requirements associated with its handling and disposal.
Radioactive Waste Packaging Product Innovations
Recent product innovations in radioactive waste packaging focus on enhancing safety, durability, and sustainability. This includes the development of advanced composite materials offering superior radiation shielding and improved resistance to environmental factors. Innovative designs optimized for efficient transportation and handling are also gaining traction. These advancements address the critical challenges associated with handling radioactive materials, ensuring safe transportation and disposal.
Report Segmentation & Scope
This report segments the radioactive waste packaging market based on material type (steel, concrete, polymer composites), packaging type (drums, containers, casks), and waste type (low-level, intermediate-level, high-level). Each segment's market size, growth projections, and competitive dynamics are analyzed in detail. For example, the steel packaging segment is expected to retain its leading position due to its strength and cost-effectiveness, while the polymer composite segment is projected to demonstrate significant growth due to the increasing demand for lightweight and durable alternatives. Similarly, the high-level waste segment is expected to be the fastest-growing due to the stringent safety requirements associated with its transportation and disposal.
Key Drivers of Radioactive Waste Packaging Growth
Several factors drive the growth of the radioactive waste packaging market. The expansion of the nuclear power industry necessitates robust and reliable packaging solutions for safe waste management. Stringent government regulations concerning the handling and transportation of radioactive materials necessitate compliance with safety standards and drive innovation in packaging technologies. The increasing adoption of advanced materials and design technologies improves radiation shielding, durability, and transportation efficiency, fueling market growth.
Challenges in the Radioactive Waste Packaging Sector
The radioactive waste packaging sector faces various challenges. Stringent regulatory requirements and complex certification processes increase the costs and time required for product development and market entry. Ensuring the long-term integrity and safety of packaging materials in diverse environmental conditions is crucial, posing technological challenges. Supply chain disruptions and fluctuating raw material prices also impact the industry's profitability and sustainability. The high cost of disposal and the potential environmental impact of packaging materials also pose significant challenges.
Leading Players in the Radioactive Waste Packaging Market
- NFT Inc.
- Orano
- Strategic Packaging Systems
- PacTec
- Cyclife France
- Columbiana Hi Tech
- Westinghouse Electric Company
- Paragon D&E
- BWX Technologies, Inc. (BWXT)
- Eckert & Ziegler UK
- Tradebe
Key Developments in Radioactive Waste Packaging Sector
- 2022 Q4: Orano announced the successful testing of a new type of composite cask for high-level waste transportation.
- 2023 Q1: PacTec launched a new line of lightweight and durable containers for low-level waste.
- 2023 Q3: A strategic partnership between NFT Inc. and Cyclife France led to the development of a novel sustainable packaging solution. (Further details on specific announcements may need to be added based on real-time data).
Strategic Radioactive Waste Packaging Market Outlook
The future of the radioactive waste packaging market looks promising, driven by the continued expansion of the nuclear power industry and growing focus on safe and sustainable waste management practices. Strategic opportunities lie in developing innovative packaging solutions that meet stringent regulatory requirements, utilize advanced materials, and offer enhanced safety and sustainability features. Companies that invest in research and development, strategic partnerships, and expansion into new geographical markets are poised to capitalize on the market's growth potential. The focus on sustainable and cost-effective solutions will further shape the market dynamics in the coming years.
Radioactive Waste Packaging Segmentation
-
1. Application
- 1.1. Low-level Radioactive Nuclear Waste
- 1.2. Medium-level Radioactive Nuclear Waste
- 1.3. High-level Radioactive Nuclear Waste
-
2. Types
- 2.1. Industrial Packaging
- 2.2. Type A Packaging
- 2.3. Type B Packaging
- 2.4. Others
Radioactive Waste Packaging Segmentation By Geography
-
1. North America
- 1.1. United States
- 1.2. Canada
- 1.3. Mexico
-
2. South America
- 2.1. Brazil
- 2.2. Argentina
- 2.3. Rest of South America
-
3. Europe
- 3.1. United Kingdom
- 3.2. Germany
- 3.3. France
- 3.4. Italy
- 3.5. Spain
- 3.6. Russia
- 3.7. Benelux
- 3.8. Nordics
- 3.9. Rest of Europe
-
4. Middle East & Africa
- 4.1. Turkey
- 4.2. Israel
- 4.3. GCC
- 4.4. North Africa
- 4.5. South Africa
- 4.6. Rest of Middle East & Africa
-
5. Asia Pacific
- 5.1. China
- 5.2. India
- 5.3. Japan
- 5.4. South Korea
- 5.5. ASEAN
- 5.6. Oceania
- 5.7. Rest of Asia Pacific
Radioactive Waste Packaging Regional Market Share
Geographic Coverage of Radioactive Waste Packaging
Radioactive Waste Packaging REPORT HIGHLIGHTS
| Aspects | Details |
|---|---|
| Study Period | 2020-2034 |
| Base Year | 2025 |
| Estimated Year | 2026 |
| Forecast Period | 2026-2034 |
| Historical Period | 2020-2025 |
| Growth Rate | CAGR of 7% from 2020-2034 |
| Segmentation |
|
Table of Contents
- 1. Introduction
- 1.1. Research Scope
- 1.2. Market Segmentation
- 1.3. Research Objective
- 1.4. Definitions and Assumptions
- 2. Executive Summary
- 2.1. Market Snapshot
- 3. Market Dynamics
- 3.1. Market Drivers
- 3.2. Market Restrains
- 3.3. Market Trends
- 3.4. Market Opportunities
- 4. Market Factor Analysis
- 4.1. Porters Five Forces
- 4.1.1. Bargaining Power of Suppliers
- 4.1.2. Bargaining Power of Buyers
- 4.1.3. Threat of New Entrants
- 4.1.4. Threat of Substitutes
- 4.1.5. Competitive Rivalry
- 4.2. PESTEL analysis
- 4.3. BCG Analysis
- 4.3.1. Stars (High Growth, High Market Share)
- 4.3.2. Cash Cows (Low Growth, High Market Share)
- 4.3.3. Question Mark (High Growth, Low Market Share)
- 4.3.4. Dogs (Low Growth, Low Market Share)
- 4.4. Ansoff Matrix Analysis
- 4.5. Supply Chain Analysis
- 4.6. Regulatory Landscape
- 4.7. Current Market Potential and Opportunity Assessment (TAM–SAM–SOM Framework)
- 4.8. PMV Analyst Note
- 4.1. Porters Five Forces
- 5. Market Analysis, Insights and Forecast 2021-2033
- 5.1. Market Analysis, Insights and Forecast - by Application
- 5.1.1. Low-level Radioactive Nuclear Waste
- 5.1.2. Medium-level Radioactive Nuclear Waste
- 5.1.3. High-level Radioactive Nuclear Waste
- 5.2. Market Analysis, Insights and Forecast - by Types
- 5.2.1. Industrial Packaging
- 5.2.2. Type A Packaging
- 5.2.3. Type B Packaging
- 5.2.4. Others
- 5.3. Market Analysis, Insights and Forecast - by Region
- 5.3.1. North America
- 5.3.2. South America
- 5.3.3. Europe
- 5.3.4. Middle East & Africa
- 5.3.5. Asia Pacific
- 5.1. Market Analysis, Insights and Forecast - by Application
- 6. Global Radioactive Waste Packaging Analysis, Insights and Forecast, 2021-2033
- 6.1. Market Analysis, Insights and Forecast - by Application
- 6.1.1. Low-level Radioactive Nuclear Waste
- 6.1.2. Medium-level Radioactive Nuclear Waste
- 6.1.3. High-level Radioactive Nuclear Waste
- 6.2. Market Analysis, Insights and Forecast - by Types
- 6.2.1. Industrial Packaging
- 6.2.2. Type A Packaging
- 6.2.3. Type B Packaging
- 6.2.4. Others
- 6.1. Market Analysis, Insights and Forecast - by Application
- 7. North America Radioactive Waste Packaging Analysis, Insights and Forecast, 2020-2032
- 7.1. Market Analysis, Insights and Forecast - by Application
- 7.1.1. Low-level Radioactive Nuclear Waste
- 7.1.2. Medium-level Radioactive Nuclear Waste
- 7.1.3. High-level Radioactive Nuclear Waste
- 7.2. Market Analysis, Insights and Forecast - by Types
- 7.2.1. Industrial Packaging
- 7.2.2. Type A Packaging
- 7.2.3. Type B Packaging
- 7.2.4. Others
- 7.1. Market Analysis, Insights and Forecast - by Application
- 8. South America Radioactive Waste Packaging Analysis, Insights and Forecast, 2020-2032
- 8.1. Market Analysis, Insights and Forecast - by Application
- 8.1.1. Low-level Radioactive Nuclear Waste
- 8.1.2. Medium-level Radioactive Nuclear Waste
- 8.1.3. High-level Radioactive Nuclear Waste
- 8.2. Market Analysis, Insights and Forecast - by Types
- 8.2.1. Industrial Packaging
- 8.2.2. Type A Packaging
- 8.2.3. Type B Packaging
- 8.2.4. Others
- 8.1. Market Analysis, Insights and Forecast - by Application
- 9. Europe Radioactive Waste Packaging Analysis, Insights and Forecast, 2020-2032
- 9.1. Market Analysis, Insights and Forecast - by Application
- 9.1.1. Low-level Radioactive Nuclear Waste
- 9.1.2. Medium-level Radioactive Nuclear Waste
- 9.1.3. High-level Radioactive Nuclear Waste
- 9.2. Market Analysis, Insights and Forecast - by Types
- 9.2.1. Industrial Packaging
- 9.2.2. Type A Packaging
- 9.2.3. Type B Packaging
- 9.2.4. Others
- 9.1. Market Analysis, Insights and Forecast - by Application
- 10. Middle East & Africa Radioactive Waste Packaging Analysis, Insights and Forecast, 2020-2032
- 10.1. Market Analysis, Insights and Forecast - by Application
- 10.1.1. Low-level Radioactive Nuclear Waste
- 10.1.2. Medium-level Radioactive Nuclear Waste
- 10.1.3. High-level Radioactive Nuclear Waste
- 10.2. Market Analysis, Insights and Forecast - by Types
- 10.2.1. Industrial Packaging
- 10.2.2. Type A Packaging
- 10.2.3. Type B Packaging
- 10.2.4. Others
- 10.1. Market Analysis, Insights and Forecast - by Application
- 11. Asia Pacific Radioactive Waste Packaging Analysis, Insights and Forecast, 2020-2032
- 11.1. Market Analysis, Insights and Forecast - by Application
- 11.1.1. Low-level Radioactive Nuclear Waste
- 11.1.2. Medium-level Radioactive Nuclear Waste
- 11.1.3. High-level Radioactive Nuclear Waste
- 11.2. Market Analysis, Insights and Forecast - by Types
- 11.2.1. Industrial Packaging
- 11.2.2. Type A Packaging
- 11.2.3. Type B Packaging
- 11.2.4. Others
- 11.1. Market Analysis, Insights and Forecast - by Application
- 12. Competitive Analysis
- 12.1. Company Profiles
- 12.1.1 NFT Inc.
- 12.1.1.1. Company Overview
- 12.1.1.2. Products
- 12.1.1.3. Company Financials
- 12.1.1.4. SWOT Analysis
- 12.1.2 Orano
- 12.1.2.1. Company Overview
- 12.1.2.2. Products
- 12.1.2.3. Company Financials
- 12.1.2.4. SWOT Analysis
- 12.1.3 Strategic Packaging Systems
- 12.1.3.1. Company Overview
- 12.1.3.2. Products
- 12.1.3.3. Company Financials
- 12.1.3.4. SWOT Analysis
- 12.1.4 PacTec
- 12.1.4.1. Company Overview
- 12.1.4.2. Products
- 12.1.4.3. Company Financials
- 12.1.4.4. SWOT Analysis
- 12.1.5 Cyclife France
- 12.1.5.1. Company Overview
- 12.1.5.2. Products
- 12.1.5.3. Company Financials
- 12.1.5.4. SWOT Analysis
- 12.1.6 Columbiana Hi Tech
- 12.1.6.1. Company Overview
- 12.1.6.2. Products
- 12.1.6.3. Company Financials
- 12.1.6.4. SWOT Analysis
- 12.1.7 Westinghouse Electric Company
- 12.1.7.1. Company Overview
- 12.1.7.2. Products
- 12.1.7.3. Company Financials
- 12.1.7.4. SWOT Analysis
- 12.1.8 Paragon D&E
- 12.1.8.1. Company Overview
- 12.1.8.2. Products
- 12.1.8.3. Company Financials
- 12.1.8.4. SWOT Analysis
- 12.1.9 BWX Technologies
- 12.1.9.1. Company Overview
- 12.1.9.2. Products
- 12.1.9.3. Company Financials
- 12.1.9.4. SWOT Analysis
- 12.1.10 Inc. (BWXT)
- 12.1.10.1. Company Overview
- 12.1.10.2. Products
- 12.1.10.3. Company Financials
- 12.1.10.4. SWOT Analysis
- 12.1.11 Eckert & Ziegler UK
- 12.1.11.1. Company Overview
- 12.1.11.2. Products
- 12.1.11.3. Company Financials
- 12.1.11.4. SWOT Analysis
- 12.1.12 Tradebe
- 12.1.12.1. Company Overview
- 12.1.12.2. Products
- 12.1.12.3. Company Financials
- 12.1.12.4. SWOT Analysis
- 12.1.1 NFT Inc.
- 12.2. Market Entropy
- 12.2.1 Company's Key Areas Served
- 12.2.2 Recent Developments
- 12.3. Company Market Share Analysis 2025
- 12.3.1 Top 5 Companies Market Share Analysis
- 12.3.2 Top 3 Companies Market Share Analysis
- 12.4. List of Potential Customers
- 13. Research Methodology
List of Figures
- Figure 1: Global Radioactive Waste Packaging Revenue Breakdown (undefined, %) by Region 2025 & 2033
- Figure 2: Global Radioactive Waste Packaging Volume Breakdown (K, %) by Region 2025 & 2033
- Figure 3: North America Radioactive Waste Packaging Revenue (undefined), by Application 2025 & 2033
- Figure 4: North America Radioactive Waste Packaging Volume (K), by Application 2025 & 2033
- Figure 5: North America Radioactive Waste Packaging Revenue Share (%), by Application 2025 & 2033
- Figure 6: North America Radioactive Waste Packaging Volume Share (%), by Application 2025 & 2033
- Figure 7: North America Radioactive Waste Packaging Revenue (undefined), by Types 2025 & 2033
- Figure 8: North America Radioactive Waste Packaging Volume (K), by Types 2025 & 2033
- Figure 9: North America Radioactive Waste Packaging Revenue Share (%), by Types 2025 & 2033
- Figure 10: North America Radioactive Waste Packaging Volume Share (%), by Types 2025 & 2033
- Figure 11: North America Radioactive Waste Packaging Revenue (undefined), by Country 2025 & 2033
- Figure 12: North America Radioactive Waste Packaging Volume (K), by Country 2025 & 2033
- Figure 13: North America Radioactive Waste Packaging Revenue Share (%), by Country 2025 & 2033
- Figure 14: North America Radioactive Waste Packaging Volume Share (%), by Country 2025 & 2033
- Figure 15: South America Radioactive Waste Packaging Revenue (undefined), by Application 2025 & 2033
- Figure 16: South America Radioactive Waste Packaging Volume (K), by Application 2025 & 2033
- Figure 17: South America Radioactive Waste Packaging Revenue Share (%), by Application 2025 & 2033
- Figure 18: South America Radioactive Waste Packaging Volume Share (%), by Application 2025 & 2033
- Figure 19: South America Radioactive Waste Packaging Revenue (undefined), by Types 2025 & 2033
- Figure 20: South America Radioactive Waste Packaging Volume (K), by Types 2025 & 2033
- Figure 21: South America Radioactive Waste Packaging Revenue Share (%), by Types 2025 & 2033
- Figure 22: South America Radioactive Waste Packaging Volume Share (%), by Types 2025 & 2033
- Figure 23: South America Radioactive Waste Packaging Revenue (undefined), by Country 2025 & 2033
- Figure 24: South America Radioactive Waste Packaging Volume (K), by Country 2025 & 2033
- Figure 25: South America Radioactive Waste Packaging Revenue Share (%), by Country 2025 & 2033
- Figure 26: South America Radioactive Waste Packaging Volume Share (%), by Country 2025 & 2033
- Figure 27: Europe Radioactive Waste Packaging Revenue (undefined), by Application 2025 & 2033
- Figure 28: Europe Radioactive Waste Packaging Volume (K), by Application 2025 & 2033
- Figure 29: Europe Radioactive Waste Packaging Revenue Share (%), by Application 2025 & 2033
- Figure 30: Europe Radioactive Waste Packaging Volume Share (%), by Application 2025 & 2033
- Figure 31: Europe Radioactive Waste Packaging Revenue (undefined), by Types 2025 & 2033
- Figure 32: Europe Radioactive Waste Packaging Volume (K), by Types 2025 & 2033
- Figure 33: Europe Radioactive Waste Packaging Revenue Share (%), by Types 2025 & 2033
- Figure 34: Europe Radioactive Waste Packaging Volume Share (%), by Types 2025 & 2033
- Figure 35: Europe Radioactive Waste Packaging Revenue (undefined), by Country 2025 & 2033
- Figure 36: Europe Radioactive Waste Packaging Volume (K), by Country 2025 & 2033
- Figure 37: Europe Radioactive Waste Packaging Revenue Share (%), by Country 2025 & 2033
- Figure 38: Europe Radioactive Waste Packaging Volume Share (%), by Country 2025 & 2033
- Figure 39: Middle East & Africa Radioactive Waste Packaging Revenue (undefined), by Application 2025 & 2033
- Figure 40: Middle East & Africa Radioactive Waste Packaging Volume (K), by Application 2025 & 2033
- Figure 41: Middle East & Africa Radioactive Waste Packaging Revenue Share (%), by Application 2025 & 2033
- Figure 42: Middle East & Africa Radioactive Waste Packaging Volume Share (%), by Application 2025 & 2033
- Figure 43: Middle East & Africa Radioactive Waste Packaging Revenue (undefined), by Types 2025 & 2033
- Figure 44: Middle East & Africa Radioactive Waste Packaging Volume (K), by Types 2025 & 2033
- Figure 45: Middle East & Africa Radioactive Waste Packaging Revenue Share (%), by Types 2025 & 2033
- Figure 46: Middle East & Africa Radioactive Waste Packaging Volume Share (%), by Types 2025 & 2033
- Figure 47: Middle East & Africa Radioactive Waste Packaging Revenue (undefined), by Country 2025 & 2033
- Figure 48: Middle East & Africa Radioactive Waste Packaging Volume (K), by Country 2025 & 2033
- Figure 49: Middle East & Africa Radioactive Waste Packaging Revenue Share (%), by Country 2025 & 2033
- Figure 50: Middle East & Africa Radioactive Waste Packaging Volume Share (%), by Country 2025 & 2033
- Figure 51: Asia Pacific Radioactive Waste Packaging Revenue (undefined), by Application 2025 & 2033
- Figure 52: Asia Pacific Radioactive Waste Packaging Volume (K), by Application 2025 & 2033
- Figure 53: Asia Pacific Radioactive Waste Packaging Revenue Share (%), by Application 2025 & 2033
- Figure 54: Asia Pacific Radioactive Waste Packaging Volume Share (%), by Application 2025 & 2033
- Figure 55: Asia Pacific Radioactive Waste Packaging Revenue (undefined), by Types 2025 & 2033
- Figure 56: Asia Pacific Radioactive Waste Packaging Volume (K), by Types 2025 & 2033
- Figure 57: Asia Pacific Radioactive Waste Packaging Revenue Share (%), by Types 2025 & 2033
- Figure 58: Asia Pacific Radioactive Waste Packaging Volume Share (%), by Types 2025 & 2033
- Figure 59: Asia Pacific Radioactive Waste Packaging Revenue (undefined), by Country 2025 & 2033
- Figure 60: Asia Pacific Radioactive Waste Packaging Volume (K), by Country 2025 & 2033
- Figure 61: Asia Pacific Radioactive Waste Packaging Revenue Share (%), by Country 2025 & 2033
- Figure 62: Asia Pacific Radioactive Waste Packaging Volume Share (%), by Country 2025 & 2033
List of Tables
- Table 1: Global Radioactive Waste Packaging Revenue undefined Forecast, by Application 2020 & 2033
- Table 2: Global Radioactive Waste Packaging Volume K Forecast, by Application 2020 & 2033
- Table 3: Global Radioactive Waste Packaging Revenue undefined Forecast, by Types 2020 & 2033
- Table 4: Global Radioactive Waste Packaging Volume K Forecast, by Types 2020 & 2033
- Table 5: Global Radioactive Waste Packaging Revenue undefined Forecast, by Region 2020 & 2033
- Table 6: Global Radioactive Waste Packaging Volume K Forecast, by Region 2020 & 2033
- Table 7: Global Radioactive Waste Packaging Revenue undefined Forecast, by Application 2020 & 2033
- Table 8: Global Radioactive Waste Packaging Volume K Forecast, by Application 2020 & 2033
- Table 9: Global Radioactive Waste Packaging Revenue undefined Forecast, by Types 2020 & 2033
- Table 10: Global Radioactive Waste Packaging Volume K Forecast, by Types 2020 & 2033
- Table 11: Global Radioactive Waste Packaging Revenue undefined Forecast, by Country 2020 & 2033
- Table 12: Global Radioactive Waste Packaging Volume K Forecast, by Country 2020 & 2033
- Table 13: United States Radioactive Waste Packaging Revenue (undefined) Forecast, by Application 2020 & 2033
- Table 14: United States Radioactive Waste Packaging Volume (K) Forecast, by Application 2020 & 2033
- Table 15: Canada Radioactive Waste Packaging Revenue (undefined) Forecast, by Application 2020 & 2033
- Table 16: Canada Radioactive Waste Packaging Volume (K) Forecast, by Application 2020 & 2033
- Table 17: Mexico Radioactive Waste Packaging Revenue (undefined) Forecast, by Application 2020 & 2033
- Table 18: Mexico Radioactive Waste Packaging Volume (K) Forecast, by Application 2020 & 2033
- Table 19: Global Radioactive Waste Packaging Revenue undefined Forecast, by Application 2020 & 2033
- Table 20: Global Radioactive Waste Packaging Volume K Forecast, by Application 2020 & 2033
- Table 21: Global Radioactive Waste Packaging Revenue undefined Forecast, by Types 2020 & 2033
- Table 22: Global Radioactive Waste Packaging Volume K Forecast, by Types 2020 & 2033
- Table 23: Global Radioactive Waste Packaging Revenue undefined Forecast, by Country 2020 & 2033
- Table 24: Global Radioactive Waste Packaging Volume K Forecast, by Country 2020 & 2033
- Table 25: Brazil Radioactive Waste Packaging Revenue (undefined) Forecast, by Application 2020 & 2033
- Table 26: Brazil Radioactive Waste Packaging Volume (K) Forecast, by Application 2020 & 2033
- Table 27: Argentina Radioactive Waste Packaging Revenue (undefined) Forecast, by Application 2020 & 2033
- Table 28: Argentina Radioactive Waste Packaging Volume (K) Forecast, by Application 2020 & 2033
- Table 29: Rest of South America Radioactive Waste Packaging Revenue (undefined) Forecast, by Application 2020 & 2033
- Table 30: Rest of South America Radioactive Waste Packaging Volume (K) Forecast, by Application 2020 & 2033
- Table 31: Global Radioactive Waste Packaging Revenue undefined Forecast, by Application 2020 & 2033
- Table 32: Global Radioactive Waste Packaging Volume K Forecast, by Application 2020 & 2033
- Table 33: Global Radioactive Waste Packaging Revenue undefined Forecast, by Types 2020 & 2033
- Table 34: Global Radioactive Waste Packaging Volume K Forecast, by Types 2020 & 2033
- Table 35: Global Radioactive Waste Packaging Revenue undefined Forecast, by Country 2020 & 2033
- Table 36: Global Radioactive Waste Packaging Volume K Forecast, by Country 2020 & 2033
- Table 37: United Kingdom Radioactive Waste Packaging Revenue (undefined) Forecast, by Application 2020 & 2033
- Table 38: United Kingdom Radioactive Waste Packaging Volume (K) Forecast, by Application 2020 & 2033
- Table 39: Germany Radioactive Waste Packaging Revenue (undefined) Forecast, by Application 2020 & 2033
- Table 40: Germany Radioactive Waste Packaging Volume (K) Forecast, by Application 2020 & 2033
- Table 41: France Radioactive Waste Packaging Revenue (undefined) Forecast, by Application 2020 & 2033
- Table 42: France Radioactive Waste Packaging Volume (K) Forecast, by Application 2020 & 2033
- Table 43: Italy Radioactive Waste Packaging Revenue (undefined) Forecast, by Application 2020 & 2033
- Table 44: Italy Radioactive Waste Packaging Volume (K) Forecast, by Application 2020 & 2033
- Table 45: Spain Radioactive Waste Packaging Revenue (undefined) Forecast, by Application 2020 & 2033
- Table 46: Spain Radioactive Waste Packaging Volume (K) Forecast, by Application 2020 & 2033
- Table 47: Russia Radioactive Waste Packaging Revenue (undefined) Forecast, by Application 2020 & 2033
- Table 48: Russia Radioactive Waste Packaging Volume (K) Forecast, by Application 2020 & 2033
- Table 49: Benelux Radioactive Waste Packaging Revenue (undefined) Forecast, by Application 2020 & 2033
- Table 50: Benelux Radioactive Waste Packaging Volume (K) Forecast, by Application 2020 & 2033
- Table 51: Nordics Radioactive Waste Packaging Revenue (undefined) Forecast, by Application 2020 & 2033
- Table 52: Nordics Radioactive Waste Packaging Volume (K) Forecast, by Application 2020 & 2033
- Table 53: Rest of Europe Radioactive Waste Packaging Revenue (undefined) Forecast, by Application 2020 & 2033
- Table 54: Rest of Europe Radioactive Waste Packaging Volume (K) Forecast, by Application 2020 & 2033
- Table 55: Global Radioactive Waste Packaging Revenue undefined Forecast, by Application 2020 & 2033
- Table 56: Global Radioactive Waste Packaging Volume K Forecast, by Application 2020 & 2033
- Table 57: Global Radioactive Waste Packaging Revenue undefined Forecast, by Types 2020 & 2033
- Table 58: Global Radioactive Waste Packaging Volume K Forecast, by Types 2020 & 2033
- Table 59: Global Radioactive Waste Packaging Revenue undefined Forecast, by Country 2020 & 2033
- Table 60: Global Radioactive Waste Packaging Volume K Forecast, by Country 2020 & 2033
- Table 61: Turkey Radioactive Waste Packaging Revenue (undefined) Forecast, by Application 2020 & 2033
- Table 62: Turkey Radioactive Waste Packaging Volume (K) Forecast, by Application 2020 & 2033
- Table 63: Israel Radioactive Waste Packaging Revenue (undefined) Forecast, by Application 2020 & 2033
- Table 64: Israel Radioactive Waste Packaging Volume (K) Forecast, by Application 2020 & 2033
- Table 65: GCC Radioactive Waste Packaging Revenue (undefined) Forecast, by Application 2020 & 2033
- Table 66: GCC Radioactive Waste Packaging Volume (K) Forecast, by Application 2020 & 2033
- Table 67: North Africa Radioactive Waste Packaging Revenue (undefined) Forecast, by Application 2020 & 2033
- Table 68: North Africa Radioactive Waste Packaging Volume (K) Forecast, by Application 2020 & 2033
- Table 69: South Africa Radioactive Waste Packaging Revenue (undefined) Forecast, by Application 2020 & 2033
- Table 70: South Africa Radioactive Waste Packaging Volume (K) Forecast, by Application 2020 & 2033
- Table 71: Rest of Middle East & Africa Radioactive Waste Packaging Revenue (undefined) Forecast, by Application 2020 & 2033
- Table 72: Rest of Middle East & Africa Radioactive Waste Packaging Volume (K) Forecast, by Application 2020 & 2033
- Table 73: Global Radioactive Waste Packaging Revenue undefined Forecast, by Application 2020 & 2033
- Table 74: Global Radioactive Waste Packaging Volume K Forecast, by Application 2020 & 2033
- Table 75: Global Radioactive Waste Packaging Revenue undefined Forecast, by Types 2020 & 2033
- Table 76: Global Radioactive Waste Packaging Volume K Forecast, by Types 2020 & 2033
- Table 77: Global Radioactive Waste Packaging Revenue undefined Forecast, by Country 2020 & 2033
- Table 78: Global Radioactive Waste Packaging Volume K Forecast, by Country 2020 & 2033
- Table 79: China Radioactive Waste Packaging Revenue (undefined) Forecast, by Application 2020 & 2033
- Table 80: China Radioactive Waste Packaging Volume (K) Forecast, by Application 2020 & 2033
- Table 81: India Radioactive Waste Packaging Revenue (undefined) Forecast, by Application 2020 & 2033
- Table 82: India Radioactive Waste Packaging Volume (K) Forecast, by Application 2020 & 2033
- Table 83: Japan Radioactive Waste Packaging Revenue (undefined) Forecast, by Application 2020 & 2033
- Table 84: Japan Radioactive Waste Packaging Volume (K) Forecast, by Application 2020 & 2033
- Table 85: South Korea Radioactive Waste Packaging Revenue (undefined) Forecast, by Application 2020 & 2033
- Table 86: South Korea Radioactive Waste Packaging Volume (K) Forecast, by Application 2020 & 2033
- Table 87: ASEAN Radioactive Waste Packaging Revenue (undefined) Forecast, by Application 2020 & 2033
- Table 88: ASEAN Radioactive Waste Packaging Volume (K) Forecast, by Application 2020 & 2033
- Table 89: Oceania Radioactive Waste Packaging Revenue (undefined) Forecast, by Application 2020 & 2033
- Table 90: Oceania Radioactive Waste Packaging Volume (K) Forecast, by Application 2020 & 2033
- Table 91: Rest of Asia Pacific Radioactive Waste Packaging Revenue (undefined) Forecast, by Application 2020 & 2033
- Table 92: Rest of Asia Pacific Radioactive Waste Packaging Volume (K) Forecast, by Application 2020 & 2033
Frequently Asked Questions
1. What is the projected Compound Annual Growth Rate (CAGR) of the Radioactive Waste Packaging?
The projected CAGR is approximately 7%.
2. Which companies are prominent players in the Radioactive Waste Packaging?
Key companies in the market include NFT Inc., Orano, Strategic Packaging Systems, PacTec, Cyclife France, Columbiana Hi Tech, Westinghouse Electric Company, Paragon D&E, BWX Technologies, Inc. (BWXT), Eckert & Ziegler UK, Tradebe.
3. What are the main segments of the Radioactive Waste Packaging?
The market segments include Application, Types.
4. Can you provide details about the market size?
The market size is estimated to be USD XXX N/A as of 2022.
5. What are some drivers contributing to market growth?
N/A
6. What are the notable trends driving market growth?
N/A
7. Are there any restraints impacting market growth?
N/A
8. Can you provide examples of recent developments in the market?
N/A
9. What pricing options are available for accessing the report?
Pricing options include single-user, multi-user, and enterprise licenses priced at USD 4350.00, USD 6525.00, and USD 8700.00 respectively.
10. Is the market size provided in terms of value or volume?
The market size is provided in terms of value, measured in N/A and volume, measured in K.
11. Are there any specific market keywords associated with the report?
Yes, the market keyword associated with the report is "Radioactive Waste Packaging," which aids in identifying and referencing the specific market segment covered.
12. How do I determine which pricing option suits my needs best?
The pricing options vary based on user requirements and access needs. Individual users may opt for single-user licenses, while businesses requiring broader access may choose multi-user or enterprise licenses for cost-effective access to the report.
13. Are there any additional resources or data provided in the Radioactive Waste Packaging report?
While the report offers comprehensive insights, it's advisable to review the specific contents or supplementary materials provided to ascertain if additional resources or data are available.
14. How can I stay updated on further developments or reports in the Radioactive Waste Packaging?
To stay informed about further developments, trends, and reports in the Radioactive Waste Packaging, consider subscribing to industry newsletters, following relevant companies and organizations, or regularly checking reputable industry news sources and publications.
Methodology
Step 1 - Identification of Relevant Samples Size from Population Database


Step 2 - Approaches for Defining Global Market Size (Value, Volume* & Price*)

Note*: In applicable scenarios
Step 3 - Data Sources
Primary Research
- Web Analytics
- Survey Reports
- Research Institute
- Latest Research Reports
- Opinion Leaders
Secondary Research
- Annual Reports
- White Paper
- Latest Press Release
- Industry Association
- Paid Database
- Investor Presentations

Step 4 - Data Triangulation
Involves using different sources of information in order to increase the validity of a study
These sources are likely to be stakeholders in a program - participants, other researchers, program staff, other community members, and so on.
Then we put all data in single framework & apply various statistical tools to find out the dynamic on the market.
During the analysis stage, feedback from the stakeholder groups would be compared to determine areas of agreement as well as areas of divergence