Key Insights
The global Radiation Monitoring and Dosimeter Badges market is poised for significant expansion, driven by increasing awareness and stringent regulations surrounding radiation safety across various industries. With a current market size estimated at $4.47 billion in 2025, the sector is projected to experience robust growth, exhibiting a Compound Annual Growth Rate (CAGR) of 6.88% during the forecast period of 2025-2033. This upward trajectory is fueled by several key factors. The escalating adoption of nuclear technologies for energy generation, coupled with the continuous advancements and widespread use of radiation in medical diagnostics and treatments like radiation therapy and cancer treatment centers, forms a primary growth engine. Furthermore, the defense sector's consistent need for personnel protection in environments involving potential radiation exposure, alongside the increasing deployment of environmental radiation monitoring systems to safeguard public health and comply with environmental standards, are significantly contributing to market buoyancy. The growing emphasis on workplace safety and the demand for accurate, reliable personal dosimetry solutions in industries handling radioactive materials further bolster this demand.
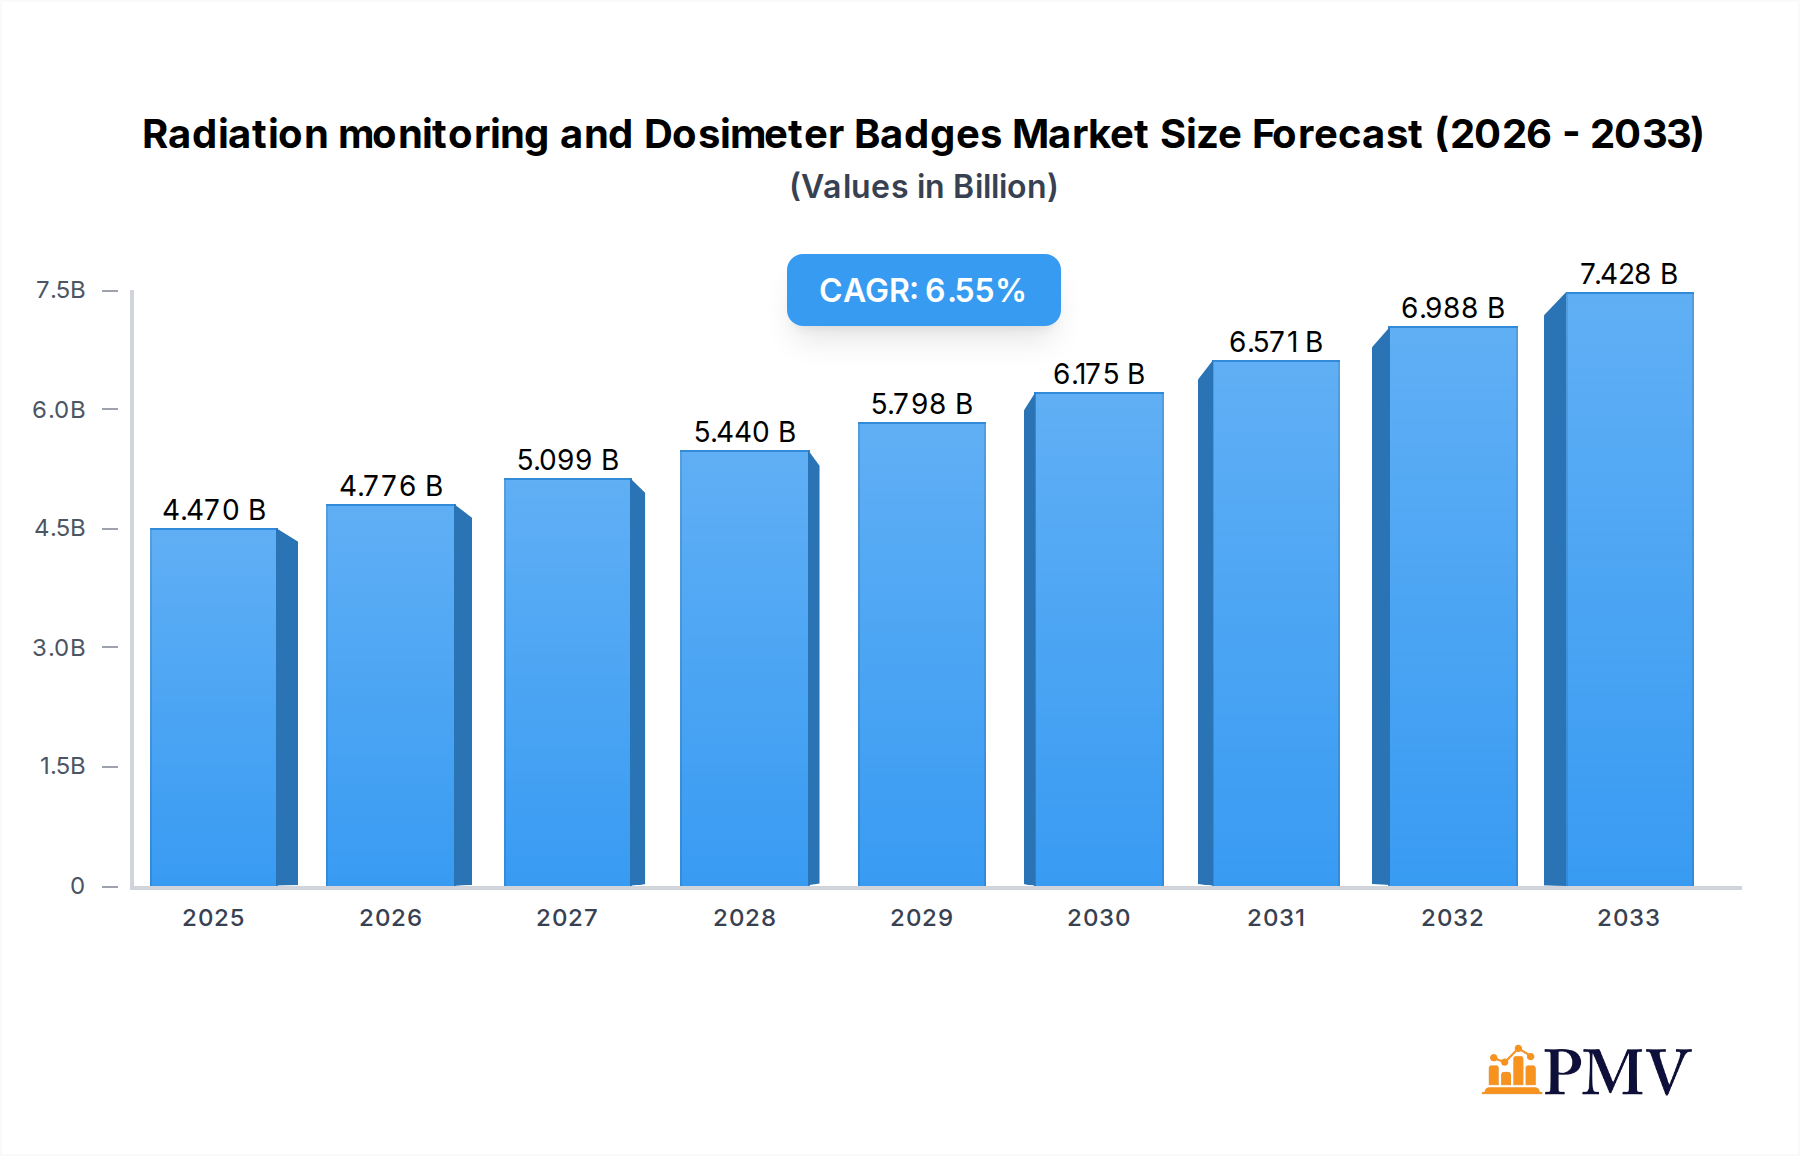
Radiation monitoring and Dosimeter Badges Market Size (In Billion)
The market is characterized by a diverse range of applications, encompassing crucial areas such as nuclear industries, hospitals, defense, radiation therapy, and cancer treatment centers. The types of monitoring and dosimeter badges available cater to specific needs, including personal dosimeters for individual exposure tracking, environmental radiation monitors for broader area assessment, radioactive material detection, active dosimeters for real-time monitoring, surface contamination monitors, and area process monitors for industrial settings. While the market is experiencing strong growth, certain factors could present challenges. These include the high initial cost of advanced monitoring equipment and the need for specialized training to operate and interpret data from sophisticated devices. However, the increasing focus on data integrity, regulatory compliance, and the development of more user-friendly and cost-effective solutions by leading companies like Thermo Fisher Scientific, Mirion Technologies, and Landauer are expected to mitigate these restraints, paving the way for sustained market expansion and innovation.

Radiation monitoring and Dosimeter Badges Company Market Share
Unveiling the Future of Radiation Safety: A Comprehensive Report on the Radiation Monitoring and Dosimeter Badges Market
This in-depth market research report provides an unparalleled analysis of the radiation monitoring and dosimeter badges market, offering critical insights into its structure, dynamics, and future trajectory. Covering the period from 2019 to 2033, with a base and estimated year of 2025 and a forecast period from 2025 to 2033, this report is essential for stakeholders seeking to navigate the evolving landscape of radiation safety solutions. We delve deep into market segmentation, key growth drivers, emerging trends, and the competitive strategies employed by industry leaders. With a focus on high-ranking keywords such as radiation dosimetry, personal dosimeter badges, environmental radiation monitoring, nuclear safety equipment, and radiation therapy dosimetry, this report aims to equip you with actionable intelligence for informed decision-making.
Radiation monitoring and Dosimeter Badges Market Structure & Competitive Dynamics
The radiation monitoring and dosimeter badges market is characterized by a moderately concentrated structure, with key players actively engaged in product innovation and strategic alliances. The innovation ecosystem thrives on continuous advancements in sensor technology, data analytics, and miniaturization, leading to enhanced accuracy and user-friendliness of radiation detection devices. Regulatory frameworks, particularly those governed by bodies like the International Atomic Energy Agency (IAEA) and national nuclear regulatory commissions, play a pivotal role in shaping market standards and product development. The presence of product substitutes, such as real-time monitoring systems and advanced detection technologies, influences market dynamics, pushing for greater value proposition in traditional dosimeter badges. End-user trends highlight a growing demand for integrated safety solutions and real-time data access, especially within the nuclear industries and healthcare sectors. Mergers and acquisition (M&A) activities are a significant aspect of the competitive landscape, with estimated M&A deal values in the billions of dollars, aimed at consolidating market share and expanding technological capabilities. Key market participants are: Landauer, Ludlum Measurements, ECOTEST, Mirion Technologies, CHP Dosimetry, Renentech Laboratories, MP Biomedicals, Sierra Radiation Dosimetry Service, Thermo Fisher Scientific, Fluke, Biodex. The market share distribution reflects a competitive battle for dominance across various segments, with significant investments in R&D by leading companies to maintain their edge.
Radiation monitoring and Dosimeter Badges Industry Trends & Insights
The radiation monitoring and dosimeter badges industry is experiencing robust growth, driven by an escalating emphasis on occupational safety and public health in environments exposed to ionizing radiation. The projected Compound Annual Growth Rate (CAGR) for the forecast period is estimated at approximately 6.5 billion, indicating substantial market expansion. Key growth drivers include the increasing adoption of advanced radiation detection equipment in the nuclear industries for power generation and waste management, coupled with the stringent regulatory requirements mandating regular dosimetry for personnel. In the healthcare sector, the rise in radiation therapy and cancer treatment centers fuels the demand for precise and reliable personal dosimeters to safeguard patients and medical professionals. Technological disruptions are central to market evolution, with innovations in solid-state detectors, wireless data transmission, and artificial intelligence-powered analytics transforming how radiation exposure is monitored and managed. The market penetration of digital dosimetry solutions is steadily increasing, offering real-time feedback and enhanced data management capabilities. Consumer preferences are shifting towards user-friendly interfaces, compact designs, and integrated software solutions that simplify data interpretation and compliance reporting. Competitive dynamics are intense, with companies vying for market share through product differentiation, strategic partnerships, and expanding geographical reach. The growing awareness of the long-term health implications of radiation exposure is a fundamental market penetration accelerator, pushing for wider adoption of comprehensive radiation safety protocols across diverse industries. The global push for enhanced safety standards in defense applications also contributes significantly to market growth, ensuring the well-being of military personnel operating in potentially hazardous environments. Furthermore, the increasing use of radioisotopes in industrial applications, such as medical imaging and sterilization, further bolsters the demand for reliable radiation monitoring solutions. The report forecasts the market to reach an estimated value of 15 billion by 2033.
Dominant Markets & Segments in Radiation monitoring and Dosimeter Badges
The radiation monitoring and dosimeter badges market exhibits significant dominance in the Nuclear Industries application segment, driven by the continuous operation and expansion of nuclear power plants globally, alongside stringent safety regulations for handling radioactive materials. Within this segment, personal dosimeters are paramount for tracking individual occupational radiation exposure, with an estimated market share of 25 billion. The Hospital and Radiation Therapy segments also represent substantial markets, fueled by the increasing demand for advanced cancer treatments and diagnostic imaging techniques that involve ionizing radiation. Here, the adoption of active dosimeters and surface contamination monitors is crucial for patient safety and regulatory compliance, contributing an estimated 18 billion to the market. The Defense sector is another key player, with a consistent need for robust environmental radiation monitoring and personal protection for personnel in potentially contaminated zones, contributing approximately 12 billion.
- Key Drivers for Nuclear Industries Dominance:
- Stringent international and national safety regulations (e.g., IAEA standards).
- Ongoing investments in new nuclear power plant construction and decommissioning projects.
- Critical need for accurate radiation monitoring during the handling of radioactive material.
- Key Drivers for Healthcare Dominance (Hospitals, Radiation Therapy, Cancer Treatment Centers):
- Growing incidence of cancer and increasing utilization of radiotherapy.
- Advancements in medical imaging technologies (e.g., PET, SPECT) requiring precise dosimetry.
- Focus on patient safety and minimizing radiation exposure to healthcare professionals.
- Key Drivers for Defense Sector Dominance:
- National security imperatives and the need for preparedness against radiological threats.
- Deployment of personnel in environments with potential radiation hazards.
- Requirement for reliable area process monitors in sensitive military installations.
The Personal Dosimeters type segment holds the largest market share due to its ubiquitous application across all major sectors. Environmental Radiation monitoring is also a rapidly growing segment, driven by increasing concerns about background radiation and industrial emissions. The market value for Personal Dosimeters is estimated at 30 billion, while Environmental Radiation monitoring holds an estimated 15 billion. Radioactive Material handling equipment and Active Dosimeters are crucial for specialized applications, contributing an estimated 10 billion and 8 billion respectively. Surface Contamination Monitors and Area Process Monitors are vital for localized safety and large-scale industrial monitoring, with combined market values estimated at 7 billion and 5 billion respectively.
Radiation monitoring and Dosimeter Badges Product Innovations
Product innovation in the radiation monitoring and dosimeter badges market is driven by a relentless pursuit of enhanced accuracy, portability, and data integration. Key developments include the introduction of highly sensitive solid-state detectors, such as silicon-based sensors, offering superior performance and durability compared to traditional TLD or OSL badges. The integration of wireless connectivity and IoT capabilities is enabling real-time data transmission, allowing for immediate alerts and comprehensive radiation exposure tracking. Smart dosimeter badges with advanced algorithms are providing more sophisticated analysis of radiation dose and trends. These innovations offer significant competitive advantages by improving user experience, reducing operational costs, and ensuring compliance with evolving safety standards across nuclear industries, healthcare, and defense.
Report Segmentation & Scope
This comprehensive report segments the radiation monitoring and dosimeter badges market by Application and Type. The Application segments include Nuclear Industries, Hospital, Defense, Radiation Therapy, and Cancer Treatment Center. The Type segments encompass Personal Dosimeters, Environmental Radiation monitoring, Radioactive Material handling, Active Dosimeters, Surface Contamination Monitors, and Area Process Monitor. Each segment is analyzed for its projected growth, market size, and competitive dynamics. For instance, the Nuclear Industries segment is projected to witness a CAGR of 7 billion, driven by global energy demands and regulatory mandates. The Personal Dosimeters segment is expected to maintain its leading position with a projected market value of 30 billion by 2033, owing to their universal application. The scope of this report covers global market trends, regional analyses, and detailed competitive intelligence.
Key Drivers of Radiation monitoring and Dosimeter Badges Growth
The radiation monitoring and dosimeter badges market is propelled by a confluence of powerful drivers. Foremost among these is the ever-increasing global emphasis on occupational health and safety regulations across all industries that handle ionizing radiation. This is directly linked to the expansion of the nuclear industries, both for power generation and research, necessitating robust radiation safety equipment. Furthermore, the burgeoning healthcare sector, with its growing reliance on radiation therapy and advanced diagnostic imaging, significantly boosts the demand for precise personal dosimeters. Technological advancements in sensor technology, leading to more accurate, compact, and user-friendly radiation detection devices, are also key accelerators. The rising awareness of the long-term health risks associated with radiation exposure among both workers and the general public further fuels the market.
Challenges in the Radiation monitoring and Dosimeter Badges Sector
Despite the promising growth trajectory, the radiation monitoring and dosimeter badges sector faces several significant challenges. Stringent and evolving regulatory landscapes can pose a hurdle, requiring continuous adaptation and investment in compliance by manufacturers. The high initial cost of advanced radiation monitoring systems can be a barrier for smaller organizations. Supply chain disruptions, particularly for specialized electronic components, can impact production timelines and costs. Intense competition among established players and the emergence of new entrants can lead to price pressures. Additionally, the need for specialized training to effectively operate and interpret data from complex radiation detection equipment can limit widespread adoption in less technically inclined sectors.
Leading Players in the Radiation monitoring and Dosimeter Badges Market
- Landauer
- Ludlum Measurements
- ECOTEST
- Mirion Technologies
- CHP Dosimetry
- Renentech Laboratories
- MP Biomedicals
- Sierra Radiation Dosimetry Service
- Thermo Fisher Scientific
- Fluke
- Biodex
Key Developments in Radiation monitoring and Dosimeter Badges Sector
- 2023/11: Landauer launches its next-generation OSL dosimetry system, offering enhanced precision and faster processing times for personal radiation monitoring.
- 2023/10: Mirion Technologies acquires a leading developer of real-time radiation monitoring software, integrating advanced data analytics into their product portfolio.
- 2023/09: Ludlum Measurements introduces a new handheld radiation survey meter with improved sensitivity and wireless data logging capabilities, catering to field applications.
- 2023/08: ECOTEST expands its environmental radiation monitoring network with advanced sensor technology for real-time atmospheric radiation detection.
- 2023/07: CHP Dosimetry announces a partnership with a major hospital network to implement its advanced radiation therapy dosimetry services.
Strategic Radiation monitoring and Dosimeter Badges Market Outlook
The strategic outlook for the radiation monitoring and dosimeter badges market is exceptionally positive, driven by sustained global investment in nuclear energy, advancements in medical technology, and a perpetual focus on enhancing workplace safety. Growth accelerators include the increasing adoption of digital and real-time dosimetry solutions, the development of miniaturized and wearable radiation sensors, and the expanding application of radiation in industrial processes. Strategic opportunities lie in catering to emerging markets with growing nuclear infrastructure and healthcare facilities, as well as in developing integrated safety platforms that combine various radiation monitoring functions. The market's future hinges on continuous innovation, robust regulatory compliance, and a proactive approach to meeting the evolving safety needs of a world increasingly reliant on radiation-based technologies.
Radiation monitoring and Dosimeter Badges Segmentation
-
1. Application
- 1.1. Nuclear Industries
- 1.2. Hospital
- 1.3. Defense
- 1.4. Radiation Therapy
- 1.5. Caner Treatment Center
-
2. Types
- 2.1. Personal Dosimeters
- 2.2. Environmental Radiation
- 2.3. Radioactive Material
- 2.4. Active Dosimeters
- 2.5. Surface Contamination Monitors
- 2.6. Area Process Monitor
Radiation monitoring and Dosimeter Badges Segmentation By Geography
-
1. North America
- 1.1. United States
- 1.2. Canada
- 1.3. Mexico
-
2. South America
- 2.1. Brazil
- 2.2. Argentina
- 2.3. Rest of South America
-
3. Europe
- 3.1. United Kingdom
- 3.2. Germany
- 3.3. France
- 3.4. Italy
- 3.5. Spain
- 3.6. Russia
- 3.7. Benelux
- 3.8. Nordics
- 3.9. Rest of Europe
-
4. Middle East & Africa
- 4.1. Turkey
- 4.2. Israel
- 4.3. GCC
- 4.4. North Africa
- 4.5. South Africa
- 4.6. Rest of Middle East & Africa
-
5. Asia Pacific
- 5.1. China
- 5.2. India
- 5.3. Japan
- 5.4. South Korea
- 5.5. ASEAN
- 5.6. Oceania
- 5.7. Rest of Asia Pacific
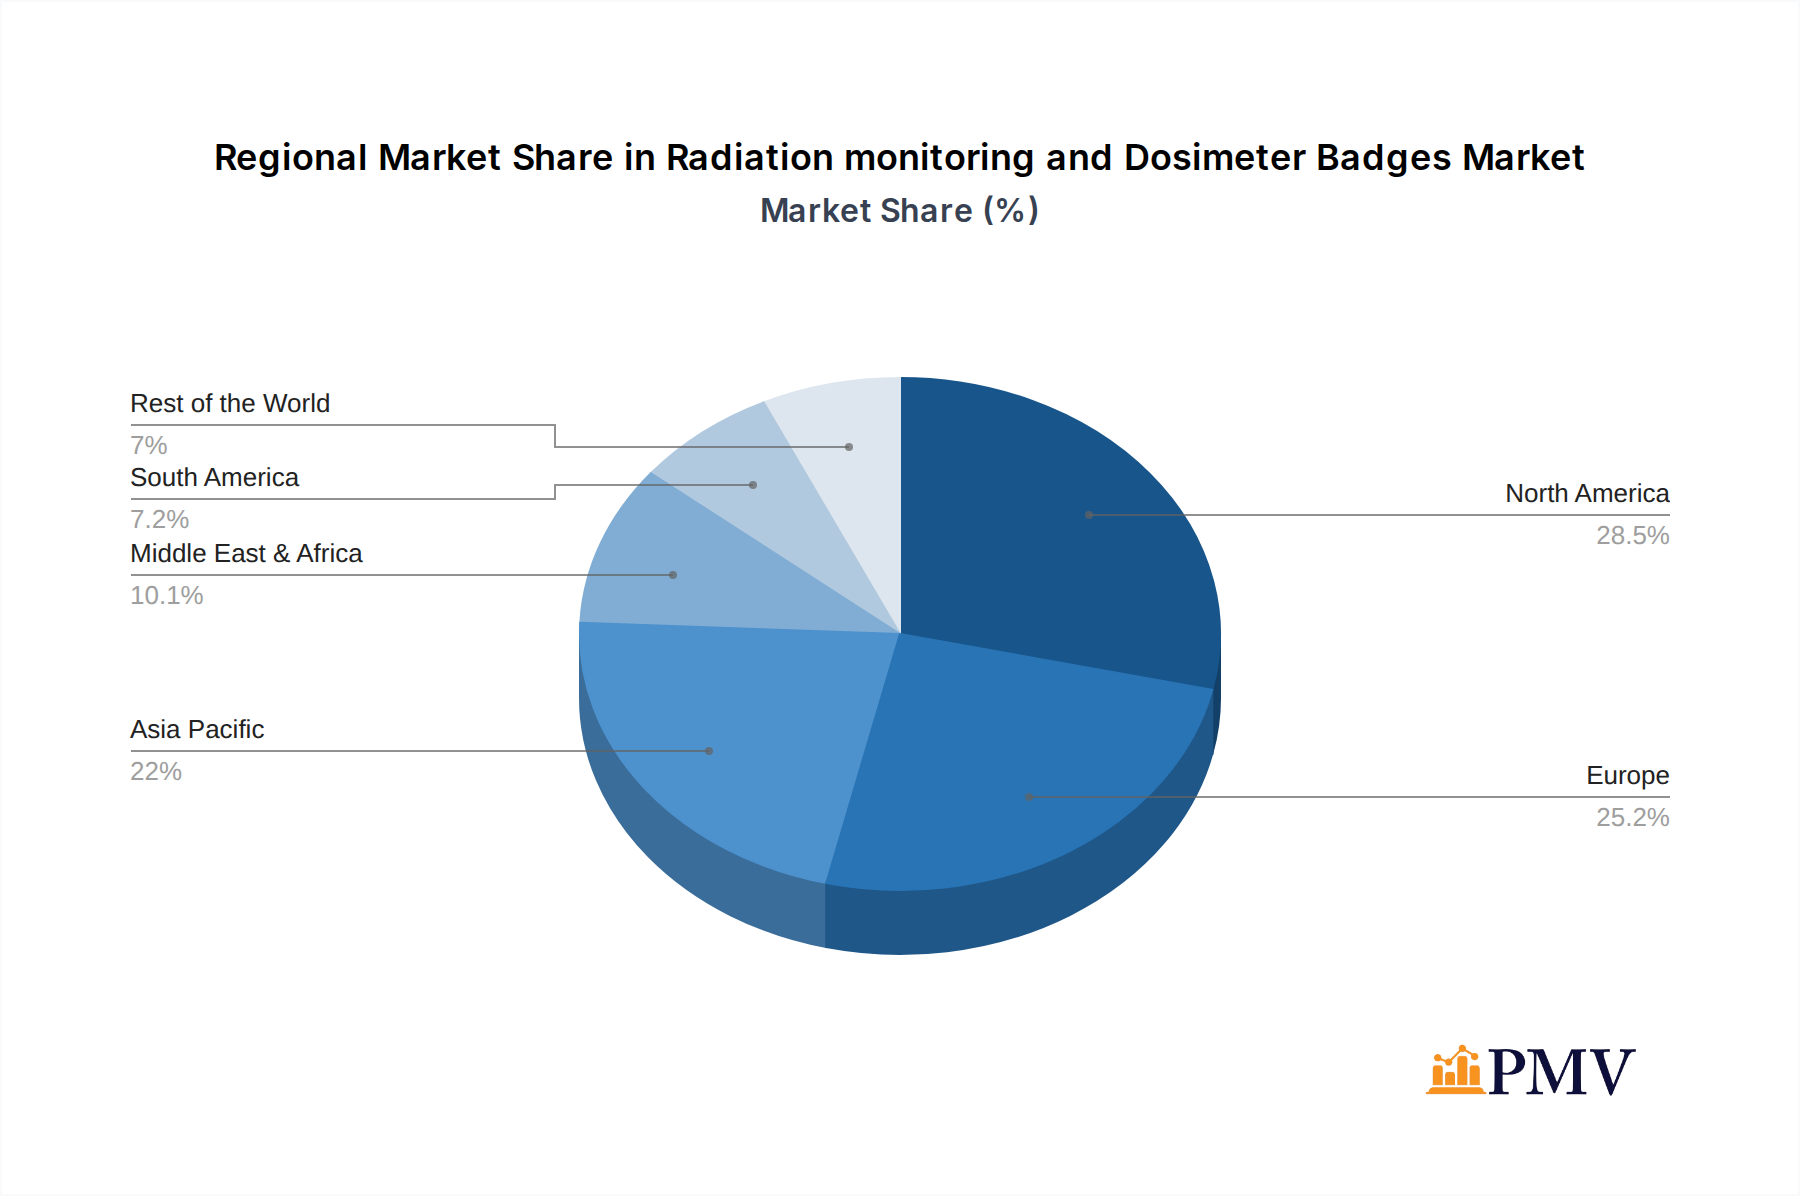
Radiation monitoring and Dosimeter Badges Regional Market Share
Geographic Coverage of Radiation monitoring and Dosimeter Badges
Radiation monitoring and Dosimeter Badges REPORT HIGHLIGHTS
| Aspects | Details |
|---|---|
| Study Period | 2020-2034 |
| Base Year | 2025 |
| Estimated Year | 2026 |
| Forecast Period | 2026-2034 |
| Historical Period | 2020-2025 |
| Growth Rate | CAGR of 9% from 2020-2034 |
| Segmentation |
|
Table of Contents
- 1. Introduction
- 1.1. Research Scope
- 1.2. Market Segmentation
- 1.3. Research Methodology
- 1.4. Definitions and Assumptions
- 2. Executive Summary
- 2.1. Introduction
- 3. Market Dynamics
- 3.1. Introduction
- 3.2. Market Drivers
- 3.3. Market Restrains
- 3.4. Market Trends
- 4. Market Factor Analysis
- 4.1. Porters Five Forces
- 4.2. Supply/Value Chain
- 4.3. PESTEL analysis
- 4.4. Market Entropy
- 4.5. Patent/Trademark Analysis
- 5. Global Radiation monitoring and Dosimeter Badges Analysis, Insights and Forecast, 2020-2032
- 5.1. Market Analysis, Insights and Forecast - by Application
- 5.1.1. Nuclear Industries
- 5.1.2. Hospital
- 5.1.3. Defense
- 5.1.4. Radiation Therapy
- 5.1.5. Caner Treatment Center
- 5.2. Market Analysis, Insights and Forecast - by Types
- 5.2.1. Personal Dosimeters
- 5.2.2. Environmental Radiation
- 5.2.3. Radioactive Material
- 5.2.4. Active Dosimeters
- 5.2.5. Surface Contamination Monitors
- 5.2.6. Area Process Monitor
- 5.3. Market Analysis, Insights and Forecast - by Region
- 5.3.1. North America
- 5.3.2. South America
- 5.3.3. Europe
- 5.3.4. Middle East & Africa
- 5.3.5. Asia Pacific
- 5.1. Market Analysis, Insights and Forecast - by Application
- 6. North America Radiation monitoring and Dosimeter Badges Analysis, Insights and Forecast, 2020-2032
- 6.1. Market Analysis, Insights and Forecast - by Application
- 6.1.1. Nuclear Industries
- 6.1.2. Hospital
- 6.1.3. Defense
- 6.1.4. Radiation Therapy
- 6.1.5. Caner Treatment Center
- 6.2. Market Analysis, Insights and Forecast - by Types
- 6.2.1. Personal Dosimeters
- 6.2.2. Environmental Radiation
- 6.2.3. Radioactive Material
- 6.2.4. Active Dosimeters
- 6.2.5. Surface Contamination Monitors
- 6.2.6. Area Process Monitor
- 6.1. Market Analysis, Insights and Forecast - by Application
- 7. South America Radiation monitoring and Dosimeter Badges Analysis, Insights and Forecast, 2020-2032
- 7.1. Market Analysis, Insights and Forecast - by Application
- 7.1.1. Nuclear Industries
- 7.1.2. Hospital
- 7.1.3. Defense
- 7.1.4. Radiation Therapy
- 7.1.5. Caner Treatment Center
- 7.2. Market Analysis, Insights and Forecast - by Types
- 7.2.1. Personal Dosimeters
- 7.2.2. Environmental Radiation
- 7.2.3. Radioactive Material
- 7.2.4. Active Dosimeters
- 7.2.5. Surface Contamination Monitors
- 7.2.6. Area Process Monitor
- 7.1. Market Analysis, Insights and Forecast - by Application
- 8. Europe Radiation monitoring and Dosimeter Badges Analysis, Insights and Forecast, 2020-2032
- 8.1. Market Analysis, Insights and Forecast - by Application
- 8.1.1. Nuclear Industries
- 8.1.2. Hospital
- 8.1.3. Defense
- 8.1.4. Radiation Therapy
- 8.1.5. Caner Treatment Center
- 8.2. Market Analysis, Insights and Forecast - by Types
- 8.2.1. Personal Dosimeters
- 8.2.2. Environmental Radiation
- 8.2.3. Radioactive Material
- 8.2.4. Active Dosimeters
- 8.2.5. Surface Contamination Monitors
- 8.2.6. Area Process Monitor
- 8.1. Market Analysis, Insights and Forecast - by Application
- 9. Middle East & Africa Radiation monitoring and Dosimeter Badges Analysis, Insights and Forecast, 2020-2032
- 9.1. Market Analysis, Insights and Forecast - by Application
- 9.1.1. Nuclear Industries
- 9.1.2. Hospital
- 9.1.3. Defense
- 9.1.4. Radiation Therapy
- 9.1.5. Caner Treatment Center
- 9.2. Market Analysis, Insights and Forecast - by Types
- 9.2.1. Personal Dosimeters
- 9.2.2. Environmental Radiation
- 9.2.3. Radioactive Material
- 9.2.4. Active Dosimeters
- 9.2.5. Surface Contamination Monitors
- 9.2.6. Area Process Monitor
- 9.1. Market Analysis, Insights and Forecast - by Application
- 10. Asia Pacific Radiation monitoring and Dosimeter Badges Analysis, Insights and Forecast, 2020-2032
- 10.1. Market Analysis, Insights and Forecast - by Application
- 10.1.1. Nuclear Industries
- 10.1.2. Hospital
- 10.1.3. Defense
- 10.1.4. Radiation Therapy
- 10.1.5. Caner Treatment Center
- 10.2. Market Analysis, Insights and Forecast - by Types
- 10.2.1. Personal Dosimeters
- 10.2.2. Environmental Radiation
- 10.2.3. Radioactive Material
- 10.2.4. Active Dosimeters
- 10.2.5. Surface Contamination Monitors
- 10.2.6. Area Process Monitor
- 10.1. Market Analysis, Insights and Forecast - by Application
- 11. Competitive Analysis
- 11.1. Global Market Share Analysis 2025
- 11.2. Company Profiles
- 11.2.1 Landauer
- 11.2.1.1. Overview
- 11.2.1.2. Products
- 11.2.1.3. SWOT Analysis
- 11.2.1.4. Recent Developments
- 11.2.1.5. Financials (Based on Availability)
- 11.2.2 Ludlum Measurements
- 11.2.2.1. Overview
- 11.2.2.2. Products
- 11.2.2.3. SWOT Analysis
- 11.2.2.4. Recent Developments
- 11.2.2.5. Financials (Based on Availability)
- 11.2.3 ECOTEST
- 11.2.3.1. Overview
- 11.2.3.2. Products
- 11.2.3.3. SWOT Analysis
- 11.2.3.4. Recent Developments
- 11.2.3.5. Financials (Based on Availability)
- 11.2.4 Mirion Technologies
- 11.2.4.1. Overview
- 11.2.4.2. Products
- 11.2.4.3. SWOT Analysis
- 11.2.4.4. Recent Developments
- 11.2.4.5. Financials (Based on Availability)
- 11.2.5 CHP Dosimetry
- 11.2.5.1. Overview
- 11.2.5.2. Products
- 11.2.5.3. SWOT Analysis
- 11.2.5.4. Recent Developments
- 11.2.5.5. Financials (Based on Availability)
- 11.2.6 Renentech Laboratories
- 11.2.6.1. Overview
- 11.2.6.2. Products
- 11.2.6.3. SWOT Analysis
- 11.2.6.4. Recent Developments
- 11.2.6.5. Financials (Based on Availability)
- 11.2.7 MP Biomedicals
- 11.2.7.1. Overview
- 11.2.7.2. Products
- 11.2.7.3. SWOT Analysis
- 11.2.7.4. Recent Developments
- 11.2.7.5. Financials (Based on Availability)
- 11.2.8 Sierra Radiation Dosimetry Service
- 11.2.8.1. Overview
- 11.2.8.2. Products
- 11.2.8.3. SWOT Analysis
- 11.2.8.4. Recent Developments
- 11.2.8.5. Financials (Based on Availability)
- 11.2.9 Thermo Fisher Scientific
- 11.2.9.1. Overview
- 11.2.9.2. Products
- 11.2.9.3. SWOT Analysis
- 11.2.9.4. Recent Developments
- 11.2.9.5. Financials (Based on Availability)
- 11.2.10 Fluke
- 11.2.10.1. Overview
- 11.2.10.2. Products
- 11.2.10.3. SWOT Analysis
- 11.2.10.4. Recent Developments
- 11.2.10.5. Financials (Based on Availability)
- 11.2.11 Biodex
- 11.2.11.1. Overview
- 11.2.11.2. Products
- 11.2.11.3. SWOT Analysis
- 11.2.11.4. Recent Developments
- 11.2.11.5. Financials (Based on Availability)
- 11.2.1 Landauer
List of Figures
- Figure 1: Global Radiation monitoring and Dosimeter Badges Revenue Breakdown (undefined, %) by Region 2025 & 2033
- Figure 2: North America Radiation monitoring and Dosimeter Badges Revenue (undefined), by Application 2025 & 2033
- Figure 3: North America Radiation monitoring and Dosimeter Badges Revenue Share (%), by Application 2025 & 2033
- Figure 4: North America Radiation monitoring and Dosimeter Badges Revenue (undefined), by Types 2025 & 2033
- Figure 5: North America Radiation monitoring and Dosimeter Badges Revenue Share (%), by Types 2025 & 2033
- Figure 6: North America Radiation monitoring and Dosimeter Badges Revenue (undefined), by Country 2025 & 2033
- Figure 7: North America Radiation monitoring and Dosimeter Badges Revenue Share (%), by Country 2025 & 2033
- Figure 8: South America Radiation monitoring and Dosimeter Badges Revenue (undefined), by Application 2025 & 2033
- Figure 9: South America Radiation monitoring and Dosimeter Badges Revenue Share (%), by Application 2025 & 2033
- Figure 10: South America Radiation monitoring and Dosimeter Badges Revenue (undefined), by Types 2025 & 2033
- Figure 11: South America Radiation monitoring and Dosimeter Badges Revenue Share (%), by Types 2025 & 2033
- Figure 12: South America Radiation monitoring and Dosimeter Badges Revenue (undefined), by Country 2025 & 2033
- Figure 13: South America Radiation monitoring and Dosimeter Badges Revenue Share (%), by Country 2025 & 2033
- Figure 14: Europe Radiation monitoring and Dosimeter Badges Revenue (undefined), by Application 2025 & 2033
- Figure 15: Europe Radiation monitoring and Dosimeter Badges Revenue Share (%), by Application 2025 & 2033
- Figure 16: Europe Radiation monitoring and Dosimeter Badges Revenue (undefined), by Types 2025 & 2033
- Figure 17: Europe Radiation monitoring and Dosimeter Badges Revenue Share (%), by Types 2025 & 2033
- Figure 18: Europe Radiation monitoring and Dosimeter Badges Revenue (undefined), by Country 2025 & 2033
- Figure 19: Europe Radiation monitoring and Dosimeter Badges Revenue Share (%), by Country 2025 & 2033
- Figure 20: Middle East & Africa Radiation monitoring and Dosimeter Badges Revenue (undefined), by Application 2025 & 2033
- Figure 21: Middle East & Africa Radiation monitoring and Dosimeter Badges Revenue Share (%), by Application 2025 & 2033
- Figure 22: Middle East & Africa Radiation monitoring and Dosimeter Badges Revenue (undefined), by Types 2025 & 2033
- Figure 23: Middle East & Africa Radiation monitoring and Dosimeter Badges Revenue Share (%), by Types 2025 & 2033
- Figure 24: Middle East & Africa Radiation monitoring and Dosimeter Badges Revenue (undefined), by Country 2025 & 2033
- Figure 25: Middle East & Africa Radiation monitoring and Dosimeter Badges Revenue Share (%), by Country 2025 & 2033
- Figure 26: Asia Pacific Radiation monitoring and Dosimeter Badges Revenue (undefined), by Application 2025 & 2033
- Figure 27: Asia Pacific Radiation monitoring and Dosimeter Badges Revenue Share (%), by Application 2025 & 2033
- Figure 28: Asia Pacific Radiation monitoring and Dosimeter Badges Revenue (undefined), by Types 2025 & 2033
- Figure 29: Asia Pacific Radiation monitoring and Dosimeter Badges Revenue Share (%), by Types 2025 & 2033
- Figure 30: Asia Pacific Radiation monitoring and Dosimeter Badges Revenue (undefined), by Country 2025 & 2033
- Figure 31: Asia Pacific Radiation monitoring and Dosimeter Badges Revenue Share (%), by Country 2025 & 2033
List of Tables
- Table 1: Global Radiation monitoring and Dosimeter Badges Revenue undefined Forecast, by Application 2020 & 2033
- Table 2: Global Radiation monitoring and Dosimeter Badges Revenue undefined Forecast, by Types 2020 & 2033
- Table 3: Global Radiation monitoring and Dosimeter Badges Revenue undefined Forecast, by Region 2020 & 2033
- Table 4: Global Radiation monitoring and Dosimeter Badges Revenue undefined Forecast, by Application 2020 & 2033
- Table 5: Global Radiation monitoring and Dosimeter Badges Revenue undefined Forecast, by Types 2020 & 2033
- Table 6: Global Radiation monitoring and Dosimeter Badges Revenue undefined Forecast, by Country 2020 & 2033
- Table 7: United States Radiation monitoring and Dosimeter Badges Revenue (undefined) Forecast, by Application 2020 & 2033
- Table 8: Canada Radiation monitoring and Dosimeter Badges Revenue (undefined) Forecast, by Application 2020 & 2033
- Table 9: Mexico Radiation monitoring and Dosimeter Badges Revenue (undefined) Forecast, by Application 2020 & 2033
- Table 10: Global Radiation monitoring and Dosimeter Badges Revenue undefined Forecast, by Application 2020 & 2033
- Table 11: Global Radiation monitoring and Dosimeter Badges Revenue undefined Forecast, by Types 2020 & 2033
- Table 12: Global Radiation monitoring and Dosimeter Badges Revenue undefined Forecast, by Country 2020 & 2033
- Table 13: Brazil Radiation monitoring and Dosimeter Badges Revenue (undefined) Forecast, by Application 2020 & 2033
- Table 14: Argentina Radiation monitoring and Dosimeter Badges Revenue (undefined) Forecast, by Application 2020 & 2033
- Table 15: Rest of South America Radiation monitoring and Dosimeter Badges Revenue (undefined) Forecast, by Application 2020 & 2033
- Table 16: Global Radiation monitoring and Dosimeter Badges Revenue undefined Forecast, by Application 2020 & 2033
- Table 17: Global Radiation monitoring and Dosimeter Badges Revenue undefined Forecast, by Types 2020 & 2033
- Table 18: Global Radiation monitoring and Dosimeter Badges Revenue undefined Forecast, by Country 2020 & 2033
- Table 19: United Kingdom Radiation monitoring and Dosimeter Badges Revenue (undefined) Forecast, by Application 2020 & 2033
- Table 20: Germany Radiation monitoring and Dosimeter Badges Revenue (undefined) Forecast, by Application 2020 & 2033
- Table 21: France Radiation monitoring and Dosimeter Badges Revenue (undefined) Forecast, by Application 2020 & 2033
- Table 22: Italy Radiation monitoring and Dosimeter Badges Revenue (undefined) Forecast, by Application 2020 & 2033
- Table 23: Spain Radiation monitoring and Dosimeter Badges Revenue (undefined) Forecast, by Application 2020 & 2033
- Table 24: Russia Radiation monitoring and Dosimeter Badges Revenue (undefined) Forecast, by Application 2020 & 2033
- Table 25: Benelux Radiation monitoring and Dosimeter Badges Revenue (undefined) Forecast, by Application 2020 & 2033
- Table 26: Nordics Radiation monitoring and Dosimeter Badges Revenue (undefined) Forecast, by Application 2020 & 2033
- Table 27: Rest of Europe Radiation monitoring and Dosimeter Badges Revenue (undefined) Forecast, by Application 2020 & 2033
- Table 28: Global Radiation monitoring and Dosimeter Badges Revenue undefined Forecast, by Application 2020 & 2033
- Table 29: Global Radiation monitoring and Dosimeter Badges Revenue undefined Forecast, by Types 2020 & 2033
- Table 30: Global Radiation monitoring and Dosimeter Badges Revenue undefined Forecast, by Country 2020 & 2033
- Table 31: Turkey Radiation monitoring and Dosimeter Badges Revenue (undefined) Forecast, by Application 2020 & 2033
- Table 32: Israel Radiation monitoring and Dosimeter Badges Revenue (undefined) Forecast, by Application 2020 & 2033
- Table 33: GCC Radiation monitoring and Dosimeter Badges Revenue (undefined) Forecast, by Application 2020 & 2033
- Table 34: North Africa Radiation monitoring and Dosimeter Badges Revenue (undefined) Forecast, by Application 2020 & 2033
- Table 35: South Africa Radiation monitoring and Dosimeter Badges Revenue (undefined) Forecast, by Application 2020 & 2033
- Table 36: Rest of Middle East & Africa Radiation monitoring and Dosimeter Badges Revenue (undefined) Forecast, by Application 2020 & 2033
- Table 37: Global Radiation monitoring and Dosimeter Badges Revenue undefined Forecast, by Application 2020 & 2033
- Table 38: Global Radiation monitoring and Dosimeter Badges Revenue undefined Forecast, by Types 2020 & 2033
- Table 39: Global Radiation monitoring and Dosimeter Badges Revenue undefined Forecast, by Country 2020 & 2033
- Table 40: China Radiation monitoring and Dosimeter Badges Revenue (undefined) Forecast, by Application 2020 & 2033
- Table 41: India Radiation monitoring and Dosimeter Badges Revenue (undefined) Forecast, by Application 2020 & 2033
- Table 42: Japan Radiation monitoring and Dosimeter Badges Revenue (undefined) Forecast, by Application 2020 & 2033
- Table 43: South Korea Radiation monitoring and Dosimeter Badges Revenue (undefined) Forecast, by Application 2020 & 2033
- Table 44: ASEAN Radiation monitoring and Dosimeter Badges Revenue (undefined) Forecast, by Application 2020 & 2033
- Table 45: Oceania Radiation monitoring and Dosimeter Badges Revenue (undefined) Forecast, by Application 2020 & 2033
- Table 46: Rest of Asia Pacific Radiation monitoring and Dosimeter Badges Revenue (undefined) Forecast, by Application 2020 & 2033
Frequently Asked Questions
1. What is the projected Compound Annual Growth Rate (CAGR) of the Radiation monitoring and Dosimeter Badges?
The projected CAGR is approximately 9%.
2. Which companies are prominent players in the Radiation monitoring and Dosimeter Badges?
Key companies in the market include Landauer, Ludlum Measurements, ECOTEST, Mirion Technologies, CHP Dosimetry, Renentech Laboratories, MP Biomedicals, Sierra Radiation Dosimetry Service, Thermo Fisher Scientific, Fluke, Biodex.
3. What are the main segments of the Radiation monitoring and Dosimeter Badges?
The market segments include Application, Types.
4. Can you provide details about the market size?
The market size is estimated to be USD XXX N/A as of 2022.
5. What are some drivers contributing to market growth?
N/A
6. What are the notable trends driving market growth?
N/A
7. Are there any restraints impacting market growth?
N/A
8. Can you provide examples of recent developments in the market?
N/A
9. What pricing options are available for accessing the report?
Pricing options include single-user, multi-user, and enterprise licenses priced at USD 2900.00, USD 4350.00, and USD 5800.00 respectively.
10. Is the market size provided in terms of value or volume?
The market size is provided in terms of value, measured in N/A.
11. Are there any specific market keywords associated with the report?
Yes, the market keyword associated with the report is "Radiation monitoring and Dosimeter Badges," which aids in identifying and referencing the specific market segment covered.
12. How do I determine which pricing option suits my needs best?
The pricing options vary based on user requirements and access needs. Individual users may opt for single-user licenses, while businesses requiring broader access may choose multi-user or enterprise licenses for cost-effective access to the report.
13. Are there any additional resources or data provided in the Radiation monitoring and Dosimeter Badges report?
While the report offers comprehensive insights, it's advisable to review the specific contents or supplementary materials provided to ascertain if additional resources or data are available.
14. How can I stay updated on further developments or reports in the Radiation monitoring and Dosimeter Badges?
To stay informed about further developments, trends, and reports in the Radiation monitoring and Dosimeter Badges, consider subscribing to industry newsletters, following relevant companies and organizations, or regularly checking reputable industry news sources and publications.
Methodology
Step 1 - Identification of Relevant Samples Size from Population Database


Step 2 - Approaches for Defining Global Market Size (Value, Volume* & Price*)

Note*: In applicable scenarios
Step 3 - Data Sources
Primary Research
- Web Analytics
- Survey Reports
- Research Institute
- Latest Research Reports
- Opinion Leaders
Secondary Research
- Annual Reports
- White Paper
- Latest Press Release
- Industry Association
- Paid Database
- Investor Presentations

Step 4 - Data Triangulation
Involves using different sources of information in order to increase the validity of a study
These sources are likely to be stakeholders in a program - participants, other researchers, program staff, other community members, and so on.
Then we put all data in single framework & apply various statistical tools to find out the dynamic on the market.
During the analysis stage, feedback from the stakeholder groups would be compared to determine areas of agreement as well as areas of divergence

