
Key Insights
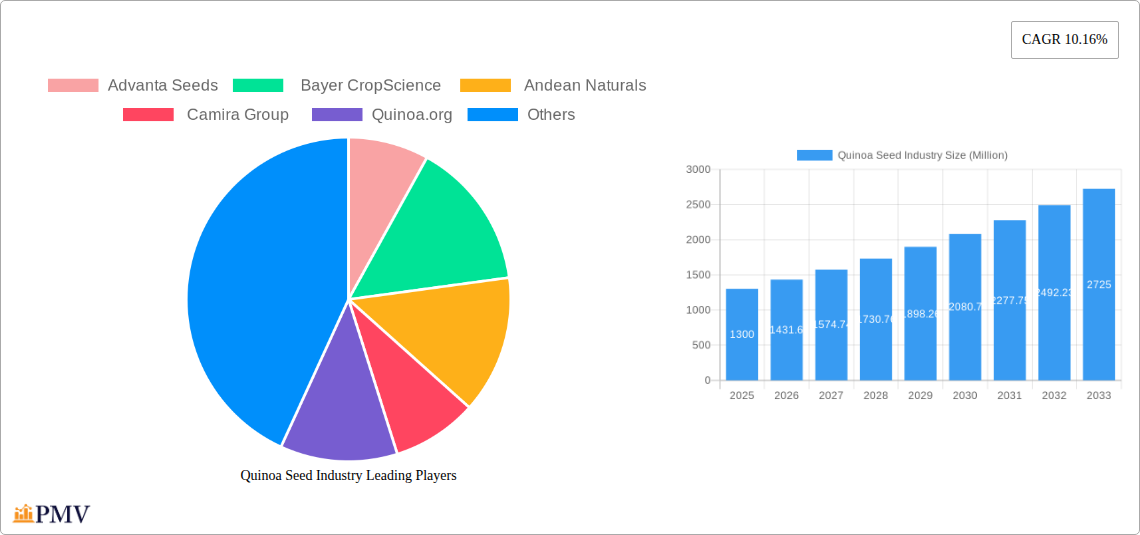
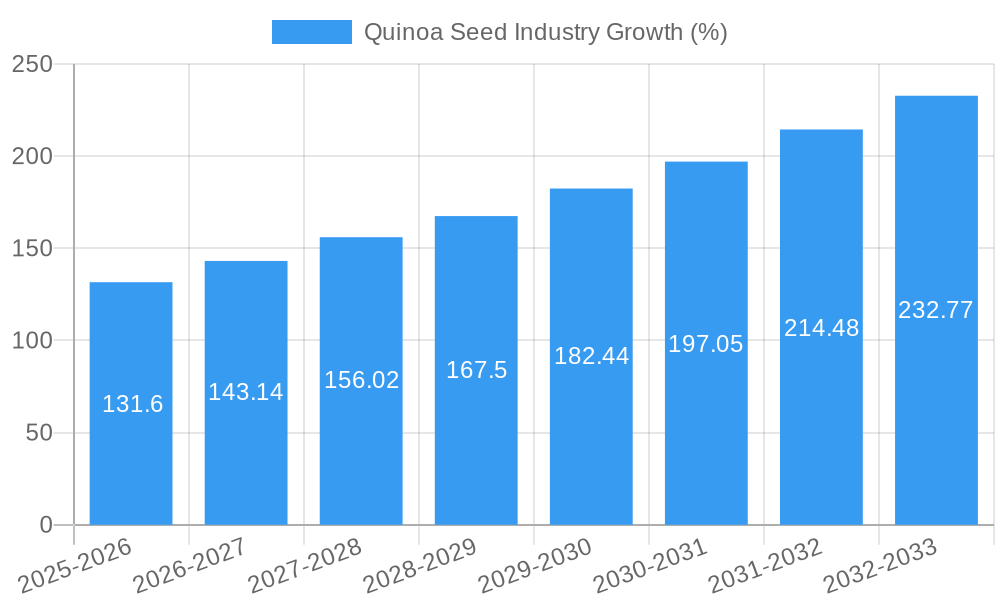
The global quinoa seed market, valued at $1.3 billion in 2025, is projected to experience robust growth, exhibiting a compound annual growth rate (CAGR) of 10.16% from 2025 to 2033. This expansion is fueled by several key factors. The rising global demand for nutritious and gluten-free foods is a primary driver, with quinoa's high protein content and complete amino acid profile making it an attractive option for health-conscious consumers. Increased awareness of quinoa's versatility in diverse culinary applications, ranging from traditional dishes to innovative food products, further contributes to its market growth. The burgeoning health supplement industry also significantly boosts demand, with quinoa extracts and flours incorporated into various functional foods and supplements targeting specific health benefits. Furthermore, the growing adoption of sustainable and organic farming practices supports the expansion of the organic quinoa segment, catering to environmentally conscious consumers. However, challenges such as price volatility due to weather conditions and fluctuating yields, along with competition from other pseudocereals and grains, represent potential restraints.
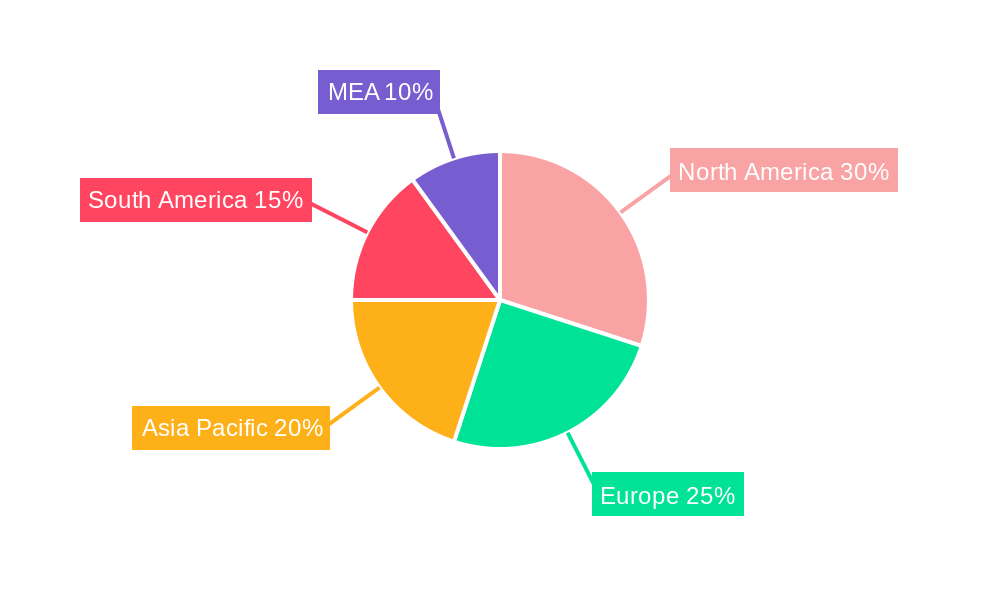
Geographical distribution reveals a diversified market landscape. North America and Europe currently hold significant market shares, driven by high consumer awareness and established distribution channels. However, the Asia-Pacific region presents significant growth potential due to its expanding population and increasing disposable incomes. Within the market segments, the food and beverage application dominates, but the health supplements and animal feed segments are showing promising growth trajectories. The market is characterized by both large multinational companies such as Bayer CropScience and Advanta Seeds, as well as smaller, niche players focusing on organic production and direct-to-consumer sales. The competitive landscape is expected to remain dynamic, with companies focusing on innovation in product development, supply chain optimization, and brand building to capture market share. The forecast period suggests continued market expansion, driven by the factors mentioned above, leading to substantial revenue generation by 2033.
Quinoa Seed Industry: A Comprehensive Market Report (2019-2033)
This comprehensive report provides a detailed analysis of the global quinoa seed industry, offering invaluable insights for stakeholders across the value chain. The report covers the period 2019-2033, with a focus on the forecast period 2025-2033 and a base year of 2025. The analysis encompasses market size estimations (in Millions), competitive dynamics, key segments, and future growth projections. This report is an essential resource for businesses, investors, and researchers seeking to understand and navigate the evolving quinoa seed market.
Quinoa Seed Industry Market Structure & Competitive Dynamics
The global quinoa seed market exhibits a moderately concentrated structure, with several key players competing for market share. Market concentration is influenced by factors such as production capacity, geographic reach, and brand recognition. The industry is characterized by ongoing innovation in cultivation techniques, processing technologies, and product diversification, driving improvements in yield, quality, and value-added product offerings. Regulatory frameworks concerning organic certification, food safety, and labeling significantly impact market dynamics. Substitute products, such as rice and other grains, exert competitive pressure, while the growing demand for gluten-free and healthy food options presents a significant market opportunity. Mergers and acquisitions (M&A) activity within the sector remains moderate, with deal values averaging xx Million annually during the historical period (2019-2024). Key players are focusing on strategic partnerships and vertical integration to enhance their market position. Market share analysis reveals that the top five players collectively hold approximately xx% of the market, indicating a fragmented yet competitive landscape. Further analysis of M&A activities shows a focus on expanding geographic reach and acquiring specialized processing capabilities.
Quinoa Seed Industry Industry Trends & Insights
The global quinoa seed industry is witnessing robust growth, driven by several key factors. The increasing global demand for healthy and nutritious food, coupled with the rising popularity of gluten-free diets, is a primary driver. The rising awareness of quinoa's nutritional benefits, including its high protein and fiber content, contributes significantly to market expansion. Technological advancements in cultivation practices, particularly in improving yields and reducing saponin content, are enhancing the product's appeal. Consumer preferences are shifting towards organic and sustainably sourced quinoa, creating opportunities for producers who prioritize ethical and environmentally responsible farming practices. The industry also faces challenges such as price volatility due to fluctuations in production and demand, and competition from other pseudocereals and grains. Despite these challenges, the market is expected to experience a Compound Annual Growth Rate (CAGR) of xx% during the forecast period (2025-2033), with market penetration in key regions expected to increase significantly. The shift towards value-added products, such as ready-to-eat quinoa meals and quinoa-based snacks, is further fueling market growth.
Dominant Markets & Segments in Quinoa Seed Industry
The quinoa seed market is geographically diverse, with South America remaining a dominant producer and exporter. Within South America, Peru and Bolivia are leading quinoa-producing countries. The dominance is driven by favorable climatic conditions and established agricultural practices. Key drivers contributing to this dominance include:
- Favorable Climate: Ideal altitude and climatic conditions for optimal quinoa growth.
- Established Agricultural Practices: Centuries of experience in quinoa cultivation.
- Government Support: Policies promoting quinoa production and export.
- Infrastructure: Relatively well-established infrastructure for harvesting and transportation.
In terms of product type, the demand for organic quinoa is growing faster than conventional quinoa. The food-grade segment holds the largest market share compared to feed-grade, driven by consumer demand for nutritional food. Within applications, the food and beverages sector leads, followed by health supplements, with animal feed representing a smaller but growing market segment. The end-user analysis reveals that food manufacturers are the largest consumers, followed by food service providers and retail chains.
Quinoa Seed Industry Product Innovations
Recent product innovations in the quinoa seed industry focus on enhancing product quality, improving processing techniques, and developing value-added products. These include the development of quinoa varieties with reduced saponin content for improved taste and digestibility, as well as the creation of convenient and ready-to-eat quinoa-based products that cater to busy lifestyles. Technological advancements are streamlining the processing and packaging of quinoa, enhancing its shelf life and minimizing waste. Innovations in organic farming practices aim to ensure sustainable and eco-friendly quinoa production, addressing growing consumer concerns about environmental impact. These advancements are critical for maintaining market competitiveness and meeting evolving consumer demands.
Report Segmentation & Scope
This report segments the quinoa seed market based on several key parameters:
Product Type: Organic quinoa is projected to witness a faster growth rate compared to conventional quinoa due to increasing consumer preference for organic products. This is leading to increased production of organic quinoa and higher pricing.
Food-Grade vs. Feed-Grade: The food-grade segment is currently the dominant segment, driven by the rising demand for quinoa in the food and beverage and health supplement industries. The feed-grade segment, although smaller, is showing a steady increase due to the use of quinoa in animal feed for nutritional enhancement.
Application: Food & Beverages holds the largest market share among the application segments. Health supplements and Animal feed are expected to show significant growth in the coming years.
End User: Food manufacturers are the major consumers of quinoa seeds, followed by Food Service Providers and Retail Chains. The increase in retail sales contributes to the market expansion.
Key Drivers of Quinoa Seed Industry Growth
The growth of the quinoa seed industry is propelled by several key factors. The rising global awareness of quinoa's nutritional value and its suitability for various dietary needs, particularly gluten-free diets, is a primary driver. Increasing demand for organic and sustainably produced food is boosting the growth of organic quinoa cultivation. Technological improvements in cultivation, processing, and packaging are enhancing product quality, efficiency, and market access. Government policies and initiatives supporting sustainable agriculture and promoting quinoa production contribute to the market's expansion. Finally, the increasing number of health-conscious consumers is driving up demand.
Challenges in the Quinoa Seed Industry Sector
The quinoa seed industry faces several challenges, including fluctuating prices influenced by seasonal production patterns and global demand fluctuations. Supply chain inefficiencies, particularly in transportation and storage, can negatively impact product quality and market access. Competition from other pseudocereals and grains, along with concerns about sustainable production practices and environmental impact, also pose significant challenges. The industry needs to address these challenges to ensure sustainable and consistent market growth. These factors collectively affect the overall revenue generation by an estimated xx Million annually.
Leading Players in the Quinoa Seed Industry Market
- Advanta Seeds
- Bayer CropScience
- Andean Naturals
- Camira Group
- Quinoa.org
Key Developments in Quinoa Seed Industry Sector
April 2022: Olam Agri released its Speciality Grains and Seeds, Peru Sustainability Report 2021, highlighting progress towards more sustainable quinoa and chia supply chains. This initiative enhances the industry's environmental and social responsibility.
January 2021: The Department of Primary Industries and Regional Development (DPIRD) in Australia developed a specialized measurement technique to quantify saponin levels in quinoa seeds. This enhances product quality control and standardization.
Strategic Quinoa Seed Industry Market Outlook
The quinoa seed industry is poised for continued growth, driven by sustained demand for healthy and nutritious foods. Strategic opportunities lie in expanding value-added product offerings, leveraging technological advancements to improve efficiency and sustainability, and focusing on building strong supply chains. Further market penetration in developing regions with growing middle classes presents significant growth potential. The industry will need to address the challenges of price volatility and sustainability concerns to capitalize on the long-term market outlook. Market size is estimated to reach xx Million by 2033, indicating robust future potential.
Quinoa Seed Industry Segmentation
- 1. Production Analysis
- 2. Consumption Analysis
- 3. Import Market Analysis (Value & Volume)
- 4. Export Market Analysis (Value & Volume)
- 5. Price Trend Analysis
Quinoa Seed Industry Segmentation By Geography
-
1. North America
- 1.1. United States
- 1.2. Canada
-
2. Europe
- 2.1. Germany
- 2.2. United Kingdom
- 2.3. France
- 2.4. Spain
- 2.5. Russia
-
3. Asia Pacific
- 3.1. China
- 3.2. Australia
- 3.3. India
-
4. South America
- 4.1. Brazil
- 4.2. Argentina
- 4.3. Peru
- 4.4. Bolivia
-
5. Africa
- 5.1. South Africa
Quinoa Seed Industry REPORT HIGHLIGHTS
| Aspects | Details |
|---|---|
| Study Period | 2019-2033 |
| Base Year | 2024 |
| Estimated Year | 2025 |
| Forecast Period | 2025-2033 |
| Historical Period | 2019-2024 |
| Growth Rate | CAGR of 10.16% from 2019-2033 |
| Segmentation |
|
Table of Contents
- 1. Introduction
- 1.1. Research Scope
- 1.2. Market Segmentation
- 1.3. Research Methodology
- 1.4. Definitions and Assumptions
- 2. Executive Summary
- 2.1. Introduction
- 3. Market Dynamics
- 3.1. Introduction
- 3.2. Market Drivers
- 3.2.1. ; Favorable Government Policies & Technological Advancements; Rising Global Population and Purchasing Capacity of Consumers
- 3.3. Market Restrains
- 3.3.1. ; Extreme Climatic Conditions; High Production Cost & Water Scarcity
- 3.4. Market Trends
- 3.4.1. Increasing Health Awareness and Technological Advancements are Driving the Market
- 4. Market Factor Analysis
- 4.1. Porters Five Forces
- 4.2. Supply/Value Chain
- 4.3. PESTEL analysis
- 4.4. Market Entropy
- 4.5. Patent/Trademark Analysis
- 5. Global Quinoa Seed Industry Analysis, Insights and Forecast, 2019-2031
- 5.1. Market Analysis, Insights and Forecast - by Production Analysis
- 5.2. Market Analysis, Insights and Forecast - by Consumption Analysis
- 5.3. Market Analysis, Insights and Forecast - by Import Market Analysis (Value & Volume)
- 5.4. Market Analysis, Insights and Forecast - by Export Market Analysis (Value & Volume)
- 5.5. Market Analysis, Insights and Forecast - by Price Trend Analysis
- 5.6. Market Analysis, Insights and Forecast - by Region
- 5.6.1. North America
- 5.6.2. Europe
- 5.6.3. Asia Pacific
- 5.6.4. South America
- 5.6.5. Africa
- 5.1. Market Analysis, Insights and Forecast - by Production Analysis
- 6. North America Quinoa Seed Industry Analysis, Insights and Forecast, 2019-2031
- 6.1. Market Analysis, Insights and Forecast - by Production Analysis
- 6.2. Market Analysis, Insights and Forecast - by Consumption Analysis
- 6.3. Market Analysis, Insights and Forecast - by Import Market Analysis (Value & Volume)
- 6.4. Market Analysis, Insights and Forecast - by Export Market Analysis (Value & Volume)
- 6.5. Market Analysis, Insights and Forecast - by Price Trend Analysis
- 6.1. Market Analysis, Insights and Forecast - by Production Analysis
- 7. Europe Quinoa Seed Industry Analysis, Insights and Forecast, 2019-2031
- 7.1. Market Analysis, Insights and Forecast - by Production Analysis
- 7.2. Market Analysis, Insights and Forecast - by Consumption Analysis
- 7.3. Market Analysis, Insights and Forecast - by Import Market Analysis (Value & Volume)
- 7.4. Market Analysis, Insights and Forecast - by Export Market Analysis (Value & Volume)
- 7.5. Market Analysis, Insights and Forecast - by Price Trend Analysis
- 7.1. Market Analysis, Insights and Forecast - by Production Analysis
- 8. Asia Pacific Quinoa Seed Industry Analysis, Insights and Forecast, 2019-2031
- 8.1. Market Analysis, Insights and Forecast - by Production Analysis
- 8.2. Market Analysis, Insights and Forecast - by Consumption Analysis
- 8.3. Market Analysis, Insights and Forecast - by Import Market Analysis (Value & Volume)
- 8.4. Market Analysis, Insights and Forecast - by Export Market Analysis (Value & Volume)
- 8.5. Market Analysis, Insights and Forecast - by Price Trend Analysis
- 8.1. Market Analysis, Insights and Forecast - by Production Analysis
- 9. South America Quinoa Seed Industry Analysis, Insights and Forecast, 2019-2031
- 9.1. Market Analysis, Insights and Forecast - by Production Analysis
- 9.2. Market Analysis, Insights and Forecast - by Consumption Analysis
- 9.3. Market Analysis, Insights and Forecast - by Import Market Analysis (Value & Volume)
- 9.4. Market Analysis, Insights and Forecast - by Export Market Analysis (Value & Volume)
- 9.5. Market Analysis, Insights and Forecast - by Price Trend Analysis
- 9.1. Market Analysis, Insights and Forecast - by Production Analysis
- 10. Africa Quinoa Seed Industry Analysis, Insights and Forecast, 2019-2031
- 10.1. Market Analysis, Insights and Forecast - by Production Analysis
- 10.2. Market Analysis, Insights and Forecast - by Consumption Analysis
- 10.3. Market Analysis, Insights and Forecast - by Import Market Analysis (Value & Volume)
- 10.4. Market Analysis, Insights and Forecast - by Export Market Analysis (Value & Volume)
- 10.5. Market Analysis, Insights and Forecast - by Price Trend Analysis
- 10.1. Market Analysis, Insights and Forecast - by Production Analysis
- 11. North America Quinoa Seed Industry Analysis, Insights and Forecast, 2019-2031
- 11.1. Market Analysis, Insights and Forecast - By Country/Sub-region
- 11.1.1 United States
- 11.1.2 Canada
- 11.1.3 Mexico
- 12. Europe Quinoa Seed Industry Analysis, Insights and Forecast, 2019-2031
- 12.1. Market Analysis, Insights and Forecast - By Country/Sub-region
- 12.1.1 Germany
- 12.1.2 United Kingdom
- 12.1.3 France
- 12.1.4 Spain
- 12.1.5 Italy
- 12.1.6 Spain
- 12.1.7 Belgium
- 12.1.8 Netherland
- 12.1.9 Nordics
- 12.1.10 Rest of Europe
- 13. Asia Pacific Quinoa Seed Industry Analysis, Insights and Forecast, 2019-2031
- 13.1. Market Analysis, Insights and Forecast - By Country/Sub-region
- 13.1.1 China
- 13.1.2 Japan
- 13.1.3 India
- 13.1.4 South Korea
- 13.1.5 Southeast Asia
- 13.1.6 Australia
- 13.1.7 Indonesia
- 13.1.8 Phillipes
- 13.1.9 Singapore
- 13.1.10 Thailandc
- 13.1.11 Rest of Asia Pacific
- 14. South America Quinoa Seed Industry Analysis, Insights and Forecast, 2019-2031
- 14.1. Market Analysis, Insights and Forecast - By Country/Sub-region
- 14.1.1 Brazil
- 14.1.2 Argentina
- 14.1.3 Peru
- 14.1.4 Chile
- 14.1.5 Colombia
- 14.1.6 Ecuador
- 14.1.7 Venezuela
- 14.1.8 Rest of South America
- 15. MEA Quinoa Seed Industry Analysis, Insights and Forecast, 2019-2031
- 15.1. Market Analysis, Insights and Forecast - By Country/Sub-region
- 15.1.1 United Arab Emirates
- 15.1.2 Saudi Arabia
- 15.1.3 South Africa
- 15.1.4 Rest of Middle East and Africa
- 16. Competitive Analysis
- 16.1. Global Market Share Analysis 2024
- 16.2. Company Profiles
- 16.2.1 Advanta Seeds
- 16.2.1.1. Overview
- 16.2.1.2. Products
- 16.2.1.3. SWOT Analysis
- 16.2.1.4. Recent Developments
- 16.2.1.5. Financials (Based on Availability)
- 16.2.2 Bayer CropScience
- 16.2.2.1. Overview
- 16.2.2.2. Products
- 16.2.2.3. SWOT Analysis
- 16.2.2.4. Recent Developments
- 16.2.2.5. Financials (Based on Availability)
- 16.2.3 Andean Naturals
- 16.2.3.1. Overview
- 16.2.3.2. Products
- 16.2.3.3. SWOT Analysis
- 16.2.3.4. Recent Developments
- 16.2.3.5. Financials (Based on Availability)
- 16.2.4 Camira Group
- 16.2.4.1. Overview
- 16.2.4.2. Products
- 16.2.4.3. SWOT Analysis
- 16.2.4.4. Recent Developments
- 16.2.4.5. Financials (Based on Availability)
- 16.2.5 Quinoa.org
- 16.2.5.1. Overview
- 16.2.5.2. Products
- 16.2.5.3. SWOT Analysis
- 16.2.5.4. Recent Developments
- 16.2.5.5. Financials (Based on Availability)
- 16.2.1 Advanta Seeds
List of Figures
- Figure 1: Global Quinoa Seed Industry Revenue Breakdown (Million, %) by Region 2024 & 2032
- Figure 2: North America Quinoa Seed Industry Revenue (Million), by Country 2024 & 2032
- Figure 3: North America Quinoa Seed Industry Revenue Share (%), by Country 2024 & 2032
- Figure 4: Europe Quinoa Seed Industry Revenue (Million), by Country 2024 & 2032
- Figure 5: Europe Quinoa Seed Industry Revenue Share (%), by Country 2024 & 2032
- Figure 6: Asia Pacific Quinoa Seed Industry Revenue (Million), by Country 2024 & 2032
- Figure 7: Asia Pacific Quinoa Seed Industry Revenue Share (%), by Country 2024 & 2032
- Figure 8: South America Quinoa Seed Industry Revenue (Million), by Country 2024 & 2032
- Figure 9: South America Quinoa Seed Industry Revenue Share (%), by Country 2024 & 2032
- Figure 10: MEA Quinoa Seed Industry Revenue (Million), by Country 2024 & 2032
- Figure 11: MEA Quinoa Seed Industry Revenue Share (%), by Country 2024 & 2032
- Figure 12: North America Quinoa Seed Industry Revenue (Million), by Production Analysis 2024 & 2032
- Figure 13: North America Quinoa Seed Industry Revenue Share (%), by Production Analysis 2024 & 2032
- Figure 14: North America Quinoa Seed Industry Revenue (Million), by Consumption Analysis 2024 & 2032
- Figure 15: North America Quinoa Seed Industry Revenue Share (%), by Consumption Analysis 2024 & 2032
- Figure 16: North America Quinoa Seed Industry Revenue (Million), by Import Market Analysis (Value & Volume) 2024 & 2032
- Figure 17: North America Quinoa Seed Industry Revenue Share (%), by Import Market Analysis (Value & Volume) 2024 & 2032
- Figure 18: North America Quinoa Seed Industry Revenue (Million), by Export Market Analysis (Value & Volume) 2024 & 2032
- Figure 19: North America Quinoa Seed Industry Revenue Share (%), by Export Market Analysis (Value & Volume) 2024 & 2032
- Figure 20: North America Quinoa Seed Industry Revenue (Million), by Price Trend Analysis 2024 & 2032
- Figure 21: North America Quinoa Seed Industry Revenue Share (%), by Price Trend Analysis 2024 & 2032
- Figure 22: North America Quinoa Seed Industry Revenue (Million), by Country 2024 & 2032
- Figure 23: North America Quinoa Seed Industry Revenue Share (%), by Country 2024 & 2032
- Figure 24: Europe Quinoa Seed Industry Revenue (Million), by Production Analysis 2024 & 2032
- Figure 25: Europe Quinoa Seed Industry Revenue Share (%), by Production Analysis 2024 & 2032
- Figure 26: Europe Quinoa Seed Industry Revenue (Million), by Consumption Analysis 2024 & 2032
- Figure 27: Europe Quinoa Seed Industry Revenue Share (%), by Consumption Analysis 2024 & 2032
- Figure 28: Europe Quinoa Seed Industry Revenue (Million), by Import Market Analysis (Value & Volume) 2024 & 2032
- Figure 29: Europe Quinoa Seed Industry Revenue Share (%), by Import Market Analysis (Value & Volume) 2024 & 2032
- Figure 30: Europe Quinoa Seed Industry Revenue (Million), by Export Market Analysis (Value & Volume) 2024 & 2032
- Figure 31: Europe Quinoa Seed Industry Revenue Share (%), by Export Market Analysis (Value & Volume) 2024 & 2032
- Figure 32: Europe Quinoa Seed Industry Revenue (Million), by Price Trend Analysis 2024 & 2032
- Figure 33: Europe Quinoa Seed Industry Revenue Share (%), by Price Trend Analysis 2024 & 2032
- Figure 34: Europe Quinoa Seed Industry Revenue (Million), by Country 2024 & 2032
- Figure 35: Europe Quinoa Seed Industry Revenue Share (%), by Country 2024 & 2032
- Figure 36: Asia Pacific Quinoa Seed Industry Revenue (Million), by Production Analysis 2024 & 2032
- Figure 37: Asia Pacific Quinoa Seed Industry Revenue Share (%), by Production Analysis 2024 & 2032
- Figure 38: Asia Pacific Quinoa Seed Industry Revenue (Million), by Consumption Analysis 2024 & 2032
- Figure 39: Asia Pacific Quinoa Seed Industry Revenue Share (%), by Consumption Analysis 2024 & 2032
- Figure 40: Asia Pacific Quinoa Seed Industry Revenue (Million), by Import Market Analysis (Value & Volume) 2024 & 2032
- Figure 41: Asia Pacific Quinoa Seed Industry Revenue Share (%), by Import Market Analysis (Value & Volume) 2024 & 2032
- Figure 42: Asia Pacific Quinoa Seed Industry Revenue (Million), by Export Market Analysis (Value & Volume) 2024 & 2032
- Figure 43: Asia Pacific Quinoa Seed Industry Revenue Share (%), by Export Market Analysis (Value & Volume) 2024 & 2032
- Figure 44: Asia Pacific Quinoa Seed Industry Revenue (Million), by Price Trend Analysis 2024 & 2032
- Figure 45: Asia Pacific Quinoa Seed Industry Revenue Share (%), by Price Trend Analysis 2024 & 2032
- Figure 46: Asia Pacific Quinoa Seed Industry Revenue (Million), by Country 2024 & 2032
- Figure 47: Asia Pacific Quinoa Seed Industry Revenue Share (%), by Country 2024 & 2032
- Figure 48: South America Quinoa Seed Industry Revenue (Million), by Production Analysis 2024 & 2032
- Figure 49: South America Quinoa Seed Industry Revenue Share (%), by Production Analysis 2024 & 2032
- Figure 50: South America Quinoa Seed Industry Revenue (Million), by Consumption Analysis 2024 & 2032
- Figure 51: South America Quinoa Seed Industry Revenue Share (%), by Consumption Analysis 2024 & 2032
- Figure 52: South America Quinoa Seed Industry Revenue (Million), by Import Market Analysis (Value & Volume) 2024 & 2032
- Figure 53: South America Quinoa Seed Industry Revenue Share (%), by Import Market Analysis (Value & Volume) 2024 & 2032
- Figure 54: South America Quinoa Seed Industry Revenue (Million), by Export Market Analysis (Value & Volume) 2024 & 2032
- Figure 55: South America Quinoa Seed Industry Revenue Share (%), by Export Market Analysis (Value & Volume) 2024 & 2032
- Figure 56: South America Quinoa Seed Industry Revenue (Million), by Price Trend Analysis 2024 & 2032
- Figure 57: South America Quinoa Seed Industry Revenue Share (%), by Price Trend Analysis 2024 & 2032
- Figure 58: South America Quinoa Seed Industry Revenue (Million), by Country 2024 & 2032
- Figure 59: South America Quinoa Seed Industry Revenue Share (%), by Country 2024 & 2032
- Figure 60: Africa Quinoa Seed Industry Revenue (Million), by Production Analysis 2024 & 2032
- Figure 61: Africa Quinoa Seed Industry Revenue Share (%), by Production Analysis 2024 & 2032
- Figure 62: Africa Quinoa Seed Industry Revenue (Million), by Consumption Analysis 2024 & 2032
- Figure 63: Africa Quinoa Seed Industry Revenue Share (%), by Consumption Analysis 2024 & 2032
- Figure 64: Africa Quinoa Seed Industry Revenue (Million), by Import Market Analysis (Value & Volume) 2024 & 2032
- Figure 65: Africa Quinoa Seed Industry Revenue Share (%), by Import Market Analysis (Value & Volume) 2024 & 2032
- Figure 66: Africa Quinoa Seed Industry Revenue (Million), by Export Market Analysis (Value & Volume) 2024 & 2032
- Figure 67: Africa Quinoa Seed Industry Revenue Share (%), by Export Market Analysis (Value & Volume) 2024 & 2032
- Figure 68: Africa Quinoa Seed Industry Revenue (Million), by Price Trend Analysis 2024 & 2032
- Figure 69: Africa Quinoa Seed Industry Revenue Share (%), by Price Trend Analysis 2024 & 2032
- Figure 70: Africa Quinoa Seed Industry Revenue (Million), by Country 2024 & 2032
- Figure 71: Africa Quinoa Seed Industry Revenue Share (%), by Country 2024 & 2032
List of Tables
- Table 1: Global Quinoa Seed Industry Revenue Million Forecast, by Region 2019 & 2032
- Table 2: Global Quinoa Seed Industry Revenue Million Forecast, by Production Analysis 2019 & 2032
- Table 3: Global Quinoa Seed Industry Revenue Million Forecast, by Consumption Analysis 2019 & 2032
- Table 4: Global Quinoa Seed Industry Revenue Million Forecast, by Import Market Analysis (Value & Volume) 2019 & 2032
- Table 5: Global Quinoa Seed Industry Revenue Million Forecast, by Export Market Analysis (Value & Volume) 2019 & 2032
- Table 6: Global Quinoa Seed Industry Revenue Million Forecast, by Price Trend Analysis 2019 & 2032
- Table 7: Global Quinoa Seed Industry Revenue Million Forecast, by Region 2019 & 2032
- Table 8: Global Quinoa Seed Industry Revenue Million Forecast, by Country 2019 & 2032
- Table 9: United States Quinoa Seed Industry Revenue (Million) Forecast, by Application 2019 & 2032
- Table 10: Canada Quinoa Seed Industry Revenue (Million) Forecast, by Application 2019 & 2032
- Table 11: Mexico Quinoa Seed Industry Revenue (Million) Forecast, by Application 2019 & 2032
- Table 12: Global Quinoa Seed Industry Revenue Million Forecast, by Country 2019 & 2032
- Table 13: Germany Quinoa Seed Industry Revenue (Million) Forecast, by Application 2019 & 2032
- Table 14: United Kingdom Quinoa Seed Industry Revenue (Million) Forecast, by Application 2019 & 2032
- Table 15: France Quinoa Seed Industry Revenue (Million) Forecast, by Application 2019 & 2032
- Table 16: Spain Quinoa Seed Industry Revenue (Million) Forecast, by Application 2019 & 2032
- Table 17: Italy Quinoa Seed Industry Revenue (Million) Forecast, by Application 2019 & 2032
- Table 18: Spain Quinoa Seed Industry Revenue (Million) Forecast, by Application 2019 & 2032
- Table 19: Belgium Quinoa Seed Industry Revenue (Million) Forecast, by Application 2019 & 2032
- Table 20: Netherland Quinoa Seed Industry Revenue (Million) Forecast, by Application 2019 & 2032
- Table 21: Nordics Quinoa Seed Industry Revenue (Million) Forecast, by Application 2019 & 2032
- Table 22: Rest of Europe Quinoa Seed Industry Revenue (Million) Forecast, by Application 2019 & 2032
- Table 23: Global Quinoa Seed Industry Revenue Million Forecast, by Country 2019 & 2032
- Table 24: China Quinoa Seed Industry Revenue (Million) Forecast, by Application 2019 & 2032
- Table 25: Japan Quinoa Seed Industry Revenue (Million) Forecast, by Application 2019 & 2032
- Table 26: India Quinoa Seed Industry Revenue (Million) Forecast, by Application 2019 & 2032
- Table 27: South Korea Quinoa Seed Industry Revenue (Million) Forecast, by Application 2019 & 2032
- Table 28: Southeast Asia Quinoa Seed Industry Revenue (Million) Forecast, by Application 2019 & 2032
- Table 29: Australia Quinoa Seed Industry Revenue (Million) Forecast, by Application 2019 & 2032
- Table 30: Indonesia Quinoa Seed Industry Revenue (Million) Forecast, by Application 2019 & 2032
- Table 31: Phillipes Quinoa Seed Industry Revenue (Million) Forecast, by Application 2019 & 2032
- Table 32: Singapore Quinoa Seed Industry Revenue (Million) Forecast, by Application 2019 & 2032
- Table 33: Thailandc Quinoa Seed Industry Revenue (Million) Forecast, by Application 2019 & 2032
- Table 34: Rest of Asia Pacific Quinoa Seed Industry Revenue (Million) Forecast, by Application 2019 & 2032
- Table 35: Global Quinoa Seed Industry Revenue Million Forecast, by Country 2019 & 2032
- Table 36: Brazil Quinoa Seed Industry Revenue (Million) Forecast, by Application 2019 & 2032
- Table 37: Argentina Quinoa Seed Industry Revenue (Million) Forecast, by Application 2019 & 2032
- Table 38: Peru Quinoa Seed Industry Revenue (Million) Forecast, by Application 2019 & 2032
- Table 39: Chile Quinoa Seed Industry Revenue (Million) Forecast, by Application 2019 & 2032
- Table 40: Colombia Quinoa Seed Industry Revenue (Million) Forecast, by Application 2019 & 2032
- Table 41: Ecuador Quinoa Seed Industry Revenue (Million) Forecast, by Application 2019 & 2032
- Table 42: Venezuela Quinoa Seed Industry Revenue (Million) Forecast, by Application 2019 & 2032
- Table 43: Rest of South America Quinoa Seed Industry Revenue (Million) Forecast, by Application 2019 & 2032
- Table 44: Global Quinoa Seed Industry Revenue Million Forecast, by Country 2019 & 2032
- Table 45: United Arab Emirates Quinoa Seed Industry Revenue (Million) Forecast, by Application 2019 & 2032
- Table 46: Saudi Arabia Quinoa Seed Industry Revenue (Million) Forecast, by Application 2019 & 2032
- Table 47: South Africa Quinoa Seed Industry Revenue (Million) Forecast, by Application 2019 & 2032
- Table 48: Rest of Middle East and Africa Quinoa Seed Industry Revenue (Million) Forecast, by Application 2019 & 2032
- Table 49: Global Quinoa Seed Industry Revenue Million Forecast, by Production Analysis 2019 & 2032
- Table 50: Global Quinoa Seed Industry Revenue Million Forecast, by Consumption Analysis 2019 & 2032
- Table 51: Global Quinoa Seed Industry Revenue Million Forecast, by Import Market Analysis (Value & Volume) 2019 & 2032
- Table 52: Global Quinoa Seed Industry Revenue Million Forecast, by Export Market Analysis (Value & Volume) 2019 & 2032
- Table 53: Global Quinoa Seed Industry Revenue Million Forecast, by Price Trend Analysis 2019 & 2032
- Table 54: Global Quinoa Seed Industry Revenue Million Forecast, by Country 2019 & 2032
- Table 55: United States Quinoa Seed Industry Revenue (Million) Forecast, by Application 2019 & 2032
- Table 56: Canada Quinoa Seed Industry Revenue (Million) Forecast, by Application 2019 & 2032
- Table 57: Global Quinoa Seed Industry Revenue Million Forecast, by Production Analysis 2019 & 2032
- Table 58: Global Quinoa Seed Industry Revenue Million Forecast, by Consumption Analysis 2019 & 2032
- Table 59: Global Quinoa Seed Industry Revenue Million Forecast, by Import Market Analysis (Value & Volume) 2019 & 2032
- Table 60: Global Quinoa Seed Industry Revenue Million Forecast, by Export Market Analysis (Value & Volume) 2019 & 2032
- Table 61: Global Quinoa Seed Industry Revenue Million Forecast, by Price Trend Analysis 2019 & 2032
- Table 62: Global Quinoa Seed Industry Revenue Million Forecast, by Country 2019 & 2032
- Table 63: Germany Quinoa Seed Industry Revenue (Million) Forecast, by Application 2019 & 2032
- Table 64: United Kingdom Quinoa Seed Industry Revenue (Million) Forecast, by Application 2019 & 2032
- Table 65: France Quinoa Seed Industry Revenue (Million) Forecast, by Application 2019 & 2032
- Table 66: Spain Quinoa Seed Industry Revenue (Million) Forecast, by Application 2019 & 2032
- Table 67: Russia Quinoa Seed Industry Revenue (Million) Forecast, by Application 2019 & 2032
- Table 68: Global Quinoa Seed Industry Revenue Million Forecast, by Production Analysis 2019 & 2032
- Table 69: Global Quinoa Seed Industry Revenue Million Forecast, by Consumption Analysis 2019 & 2032
- Table 70: Global Quinoa Seed Industry Revenue Million Forecast, by Import Market Analysis (Value & Volume) 2019 & 2032
- Table 71: Global Quinoa Seed Industry Revenue Million Forecast, by Export Market Analysis (Value & Volume) 2019 & 2032
- Table 72: Global Quinoa Seed Industry Revenue Million Forecast, by Price Trend Analysis 2019 & 2032
- Table 73: Global Quinoa Seed Industry Revenue Million Forecast, by Country 2019 & 2032
- Table 74: China Quinoa Seed Industry Revenue (Million) Forecast, by Application 2019 & 2032
- Table 75: Australia Quinoa Seed Industry Revenue (Million) Forecast, by Application 2019 & 2032
- Table 76: India Quinoa Seed Industry Revenue (Million) Forecast, by Application 2019 & 2032
- Table 77: Global Quinoa Seed Industry Revenue Million Forecast, by Production Analysis 2019 & 2032
- Table 78: Global Quinoa Seed Industry Revenue Million Forecast, by Consumption Analysis 2019 & 2032
- Table 79: Global Quinoa Seed Industry Revenue Million Forecast, by Import Market Analysis (Value & Volume) 2019 & 2032
- Table 80: Global Quinoa Seed Industry Revenue Million Forecast, by Export Market Analysis (Value & Volume) 2019 & 2032
- Table 81: Global Quinoa Seed Industry Revenue Million Forecast, by Price Trend Analysis 2019 & 2032
- Table 82: Global Quinoa Seed Industry Revenue Million Forecast, by Country 2019 & 2032
- Table 83: Brazil Quinoa Seed Industry Revenue (Million) Forecast, by Application 2019 & 2032
- Table 84: Argentina Quinoa Seed Industry Revenue (Million) Forecast, by Application 2019 & 2032
- Table 85: Peru Quinoa Seed Industry Revenue (Million) Forecast, by Application 2019 & 2032
- Table 86: Bolivia Quinoa Seed Industry Revenue (Million) Forecast, by Application 2019 & 2032
- Table 87: Global Quinoa Seed Industry Revenue Million Forecast, by Production Analysis 2019 & 2032
- Table 88: Global Quinoa Seed Industry Revenue Million Forecast, by Consumption Analysis 2019 & 2032
- Table 89: Global Quinoa Seed Industry Revenue Million Forecast, by Import Market Analysis (Value & Volume) 2019 & 2032
- Table 90: Global Quinoa Seed Industry Revenue Million Forecast, by Export Market Analysis (Value & Volume) 2019 & 2032
- Table 91: Global Quinoa Seed Industry Revenue Million Forecast, by Price Trend Analysis 2019 & 2032
- Table 92: Global Quinoa Seed Industry Revenue Million Forecast, by Country 2019 & 2032
- Table 93: South Africa Quinoa Seed Industry Revenue (Million) Forecast, by Application 2019 & 2032
Frequently Asked Questions
1. What is the projected Compound Annual Growth Rate (CAGR) of the Quinoa Seed Industry?
The projected CAGR is approximately 10.16%.
2. Which companies are prominent players in the Quinoa Seed Industry?
Key companies in the market include Advanta Seeds, Bayer CropScience , Andean Naturals , Camira Group , Quinoa.org.
3. What are the main segments of the Quinoa Seed Industry?
The market segments include Production Analysis, Consumption Analysis, Import Market Analysis (Value & Volume), Export Market Analysis (Value & Volume), Price Trend Analysis.
4. Can you provide details about the market size?
The market size is estimated to be USD 1.30 Million as of 2022.
5. What are some drivers contributing to market growth?
; Favorable Government Policies & Technological Advancements; Rising Global Population and Purchasing Capacity of Consumers.
6. What are the notable trends driving market growth?
Increasing Health Awareness and Technological Advancements are Driving the Market.
7. Are there any restraints impacting market growth?
; Extreme Climatic Conditions; High Production Cost & Water Scarcity.
8. Can you provide examples of recent developments in the market?
April 2022: Olam Agri, has released its Speciality Grains and Seeds, Peru Sustainability Report 2021 that outlines its continued progress towards more sustainable quinoa and chia supply chains, which are delivering positive social and environmental impacts for local quinoa and chia farming communities in Peru.
9. What pricing options are available for accessing the report?
Pricing options include single-user, multi-user, and enterprise licenses priced at USD 4750, USD 5250, and USD 8750 respectively.
10. Is the market size provided in terms of value or volume?
The market size is provided in terms of value, measured in Million.
11. Are there any specific market keywords associated with the report?
Yes, the market keyword associated with the report is "Quinoa Seed Industry," which aids in identifying and referencing the specific market segment covered.
12. How do I determine which pricing option suits my needs best?
The pricing options vary based on user requirements and access needs. Individual users may opt for single-user licenses, while businesses requiring broader access may choose multi-user or enterprise licenses for cost-effective access to the report.
13. Are there any additional resources or data provided in the Quinoa Seed Industry report?
While the report offers comprehensive insights, it's advisable to review the specific contents or supplementary materials provided to ascertain if additional resources or data are available.
14. How can I stay updated on further developments or reports in the Quinoa Seed Industry?
To stay informed about further developments, trends, and reports in the Quinoa Seed Industry, consider subscribing to industry newsletters, following relevant companies and organizations, or regularly checking reputable industry news sources and publications.
Methodology
Step 1 - Identification of Relevant Samples Size from Population Database


Step 2 - Approaches for Defining Global Market Size (Value, Volume* & Price*)

Note*: In applicable scenarios
Step 3 - Data Sources
Primary Research
- Web Analytics
- Survey Reports
- Research Institute
- Latest Research Reports
- Opinion Leaders
Secondary Research
- Annual Reports
- White Paper
- Latest Press Release
- Industry Association
- Paid Database
- Investor Presentations

Step 4 - Data Triangulation
Involves using different sources of information in order to increase the validity of a study
These sources are likely to be stakeholders in a program - participants, other researchers, program staff, other community members, and so on.
Then we put all data in single framework & apply various statistical tools to find out the dynamic on the market.
During the analysis stage, feedback from the stakeholder groups would be compared to determine areas of agreement as well as areas of divergence


