Key Insights
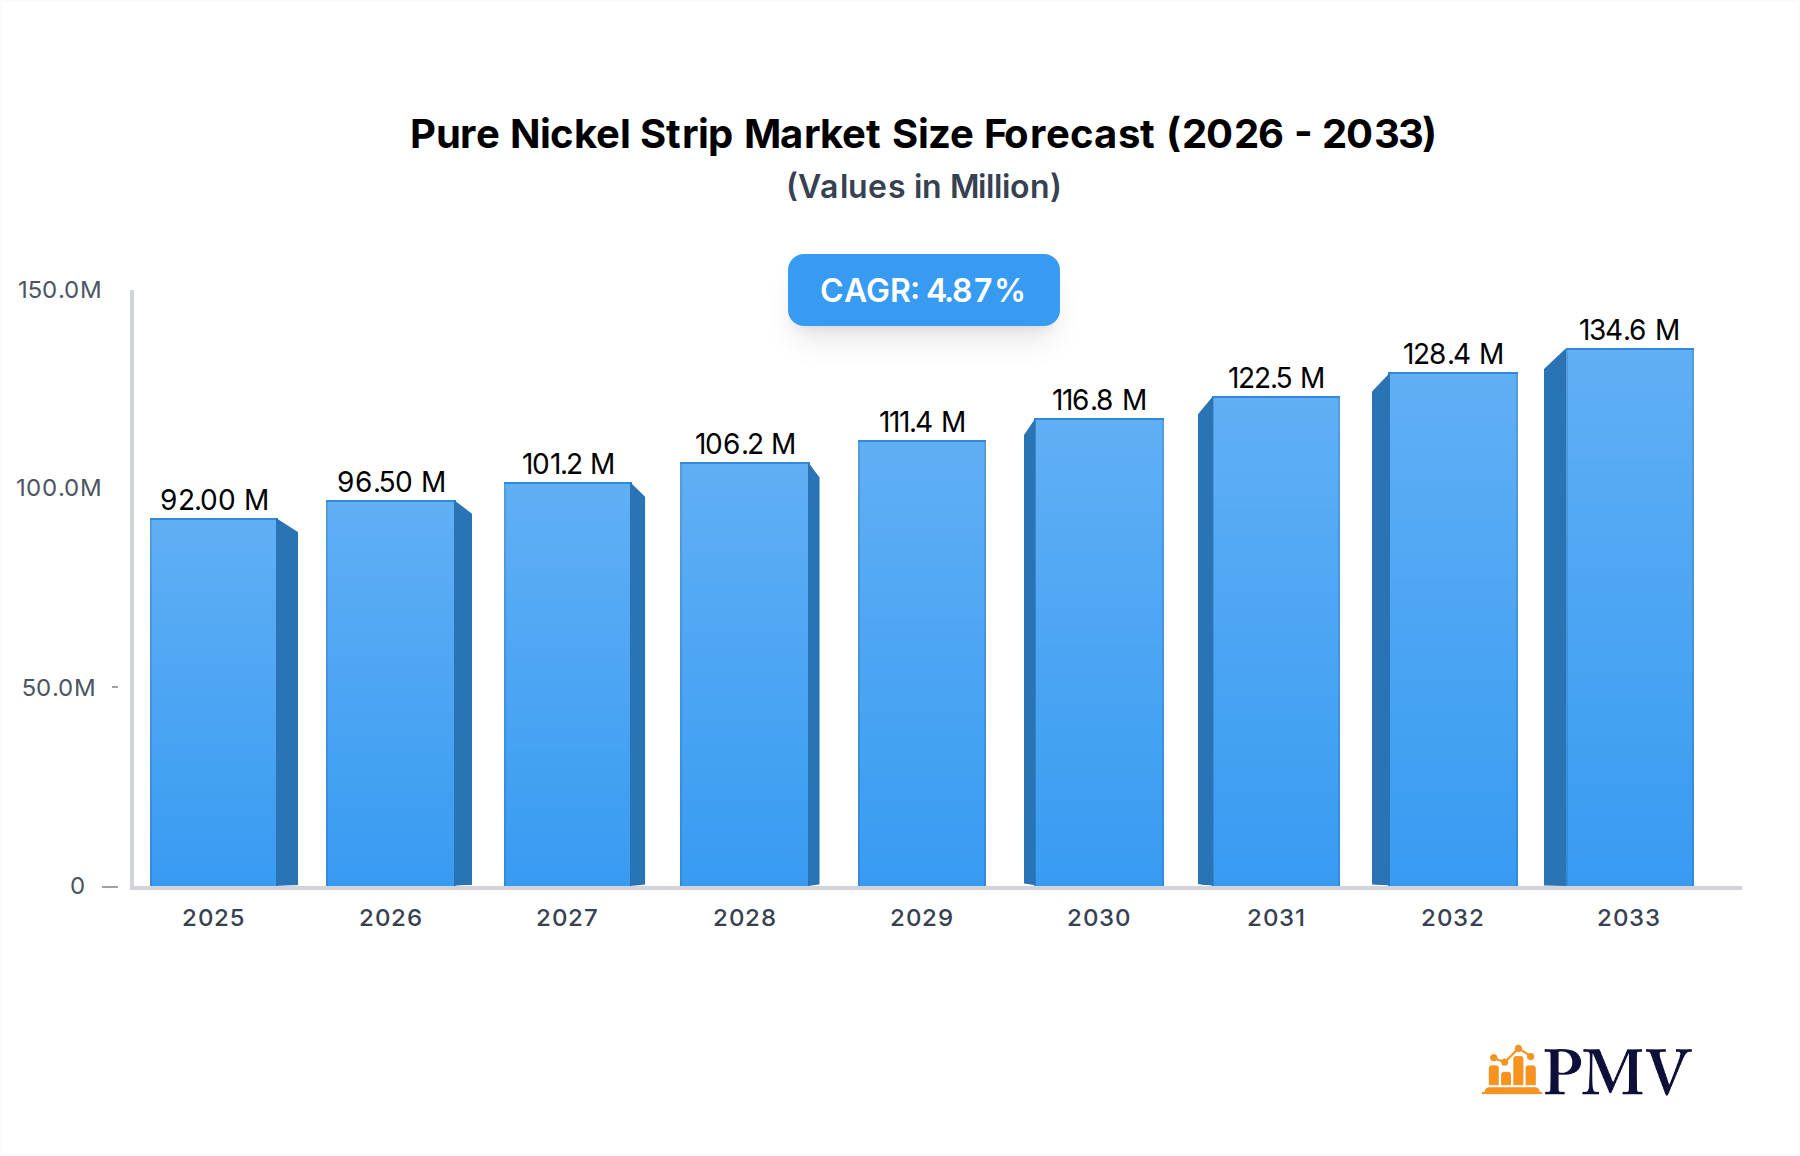
The global pure nickel strip market is poised for significant expansion, projected to reach a valuation of $92 million by 2025. This growth trajectory is underpinned by a robust Compound Annual Growth Rate (CAGR) of 4.9% anticipated throughout the forecast period of 2025-2033. A primary driver for this upward trend is the escalating demand for high-capacity lithium and lithium-ion batteries, which are integral components in electric vehicles, portable electronics, and energy storage systems. The increasing adoption of renewable energy sources further fuels the need for efficient battery technologies, where pure nickel strips play a crucial role in their construction due to their excellent conductivity and corrosion resistance.

Pure Nickel Strip Market Size (In Million)
The market is segmented by application, with High Capacity Lithium and Lithium Polymer Battery segments showing the most promising growth. Beyond these, NiMh and NiCd battery packs, along with other niche applications, contribute to the overall market demand. In terms of thickness, the 0.1 mm-0.2 mm and 0.2 mm-0.3 mm segments are expected to dominate, catering to the precise requirements of battery manufacturing. Geographically, the Asia Pacific region, particularly China and Japan, is expected to be a dominant force in both production and consumption, owing to its strong manufacturing base for electronics and electric vehicles. North America and Europe are also significant markets, driven by advancements in battery technology and the growing EV infrastructure.
Pure Nickel Strip Company Market Share
This in-depth market research report provides a detailed analysis of the global pure nickel strip market, offering critical insights into market size, growth drivers, challenges, and competitive landscape. Covering the period from 2019 to 2033, with a base year of 2025, this report is an indispensable resource for stakeholders looking to understand and capitalize on the evolving opportunities within this vital sector. We delve into market structure, industry trends, segment-specific analysis, product innovations, key drivers, challenges, leading players, significant developments, and a strategic market outlook, providing a 360-degree view of the pure nickel strip industry.
Pure Nickel Strip Market Structure & Competitive Dynamics
The global pure nickel strip market exhibits a moderately concentrated structure, with a blend of established global players and emerging regional manufacturers. Innovation ecosystems are driven by the relentless pursuit of enhanced battery performance and durability. Key market participants are actively investing in research and development to produce high-purity nickel strips with improved conductivity and corrosion resistance, crucial for advanced battery technologies. Regulatory frameworks primarily focus on environmental compliance and material sourcing, influencing production processes and supply chain management. Product substitutes, though present in niche applications, generally fall short of pure nickel strip's unique properties for demanding electrical applications, particularly in high-energy-density batteries. End-user trends are heavily influenced by the accelerating adoption of electric vehicles (EVs) and portable electronics, creating substantial demand for high-quality battery components. Mergers and acquisitions (M&A) activities are strategic moves aimed at consolidating market share, expanding product portfolios, and gaining access to new technologies and geographical markets. For instance, recent M&A deals have involved players seeking to integrate upstream raw material sourcing with downstream strip production, aiming for supply chain resilience and cost optimization. Market share figures indicate that the top ten companies collectively hold approximately 70% of the global market, with M&A deal values ranging from tens of millions to several hundred million dollars, reflecting strategic consolidation efforts.
Pure Nickel Strip Industry Trends & Insights
The pure nickel strip industry is poised for significant growth, driven by a confluence of technological advancements, expanding applications, and increasing global demand. The market is projected to witness a Compound Annual Growth Rate (CAGR) of approximately 6.5% during the forecast period (2025-2033). A primary growth driver is the booming electric vehicle (EV) sector, which necessitates high-performance battery packs that rely heavily on pure nickel strips for their internal connections and structural integrity. The burgeoning consumer electronics market, encompassing smartphones, laptops, and other portable devices, also contributes substantially to demand, as these devices increasingly feature advanced lithium-ion batteries. Furthermore, the growing adoption of renewable energy storage solutions, such as grid-scale battery systems, further amplifies the need for reliable and durable nickel strip components.
Technological disruptions are continuously shaping the industry. Innovations in nickel refining processes are leading to higher purity levels, which translate to improved electrical conductivity and reduced internal resistance in batteries, ultimately enhancing their performance and lifespan. Manufacturers are also focusing on developing specialized alloys and strip geometries to meet specific application requirements, such as increased flexibility for flexible battery designs or enhanced heat dissipation for high-power applications.
Consumer preferences are leaning towards devices with longer battery life, faster charging capabilities, and improved safety features. Pure nickel strips play a critical role in achieving these attributes. Their excellent corrosion resistance ensures the longevity and reliability of battery packs, while their high conductivity facilitates efficient energy transfer. The competitive dynamics within the industry are characterized by a keen focus on product quality, cost-effectiveness, and supply chain reliability. Companies are investing in advanced manufacturing techniques and quality control measures to ensure consistent product performance. Strategic partnerships and collaborations are becoming increasingly common as companies seek to leverage each other's expertise and expand their market reach. Market penetration of pure nickel strips is projected to exceed 85% in the battery sector by 2030, driven by the ongoing transition away from traditional energy sources and the increasing electrification of various industries.
Dominant Markets & Segments in Pure Nickel Strip
The pure nickel strip market is characterized by its dominance in specific geographic regions and application segments, driven by strong industrial bases and accelerating technological adoption. Asia-Pacific stands out as the leading region, primarily propelled by China's expansive manufacturing sector and its pivotal role in the global battery supply chain. Robust economic policies promoting domestic production, significant investments in EV infrastructure, and a vast consumer market for electronics solidify China's position. Furthermore, countries like South Korea and Japan are major contributors due to their advanced battery manufacturing capabilities and leadership in consumer electronics.
Within the application segment, High Capacity Lithium and Lithium Polymer Battery applications are exhibiting the most significant dominance. The global surge in electric vehicle adoption is a primary catalyst, as these batteries require vast quantities of high-purity nickel strips for their construction. The demand is further bolstered by the proliferation of electric buses, scooters, and other micro-mobility solutions. Lithium Polymer batteries, favored for their flexibility and slim form factor, are essential for portable electronics like smartphones, tablets, and wearables, driving sustained demand for pure nickel strips in this sub-segment. The NiMh and NiCd Battery Pack Battery segment, while mature, still represents a substantial market share, particularly in industrial applications, backup power systems, and some consumer electronics where cost-effectiveness and reliability are paramount.
Regarding types, the 0.2 mm-0.3 mm thickness range is currently experiencing the highest demand. This thickness offers an optimal balance of conductivity, structural integrity, and flexibility required for a wide array of battery designs, particularly for high-capacity applications. The 0.1 mm-0.2 mm thickness is also gaining traction, driven by the increasing demand for thinner and lighter battery packs in compact electronic devices. The "Others" category, encompassing thicker or specialized strips, caters to niche industrial applications and emerging battery technologies, with potential for future growth. Key drivers for regional and segment dominance include government incentives for EV adoption and renewable energy storage, substantial foreign direct investment in battery manufacturing facilities, favorable trade policies, and continuous advancements in battery technology that necessitate higher-performance materials.
Pure Nickel Strip Product Innovations
Product innovations in the pure nickel strip market are predominantly focused on enhancing purity levels, improving electrical conductivity, and achieving superior corrosion resistance. Manufacturers are developing ultra-high purity nickel strips (e.g., 99.99%+) to meet the stringent requirements of next-generation battery chemistries, such as solid-state batteries and advanced lithium-ion variations. Innovations also include specialized surface treatments and micro-structural engineering to optimize performance in demanding environments, leading to increased battery lifespan and safety. These advancements provide a significant competitive advantage by enabling the development of smaller, lighter, and more powerful energy storage solutions across the consumer electronics and electric vehicle sectors.
Report Segmentation & Scope
This report segments the global pure nickel strip market based on key application and type classifications. Under the Application segmentation, the market is analyzed across High Capacity Lithium batteries, Lithium Polymer Battery applications, NiMh and NiCd Battery Pack Battery applications, and Others. The High Capacity Lithium segment is projected to witness a CAGR of approximately 7.2% through 2033, driven by the exponential growth of the EV market. The Lithium Polymer Battery segment is expected to grow at a CAGR of 6.8%, fueled by the demand for flexible and compact batteries in consumer electronics. The NiMh and NiCd Battery Pack Battery segment, while mature, is forecast to maintain a steady CAGR of 4.5%, serving niche industrial and backup power applications. The Others application segment encompasses emerging battery technologies and specialized industrial uses, with an estimated CAGR of 5.5%.
In terms of Types, the market is segmented into 0.1 mm-0.2 mm, 0.2 mm-0.3 mm, and Others. The 0.2 mm-0.3 mm segment currently holds the largest market share and is anticipated to grow at a CAGR of 6.7%, reflecting its widespread use in high-capacity batteries. The 0.1 mm-0.2 mm segment is expected to experience a higher growth rate, with a CAGR of 7.0%, driven by the trend towards miniaturization in electronics. The Others segment, comprising specialized thicknesses and alloys, is projected to grow at a CAGR of 5.8%, catering to unique application needs.
Key Drivers of Pure Nickel Strip Growth
The growth of the pure nickel strip market is primarily fueled by the relentless expansion of the electric vehicle (EV) industry worldwide. Governments globally are implementing supportive policies, including subsidies and tax incentives, to promote EV adoption, directly increasing the demand for high-quality battery components like pure nickel strips. Secondly, the burgeoning consumer electronics sector, with its ever-increasing demand for portable devices, contributes significantly to market growth. Technological advancements in battery technology, leading to higher energy density and longer lifespans, necessitate the use of high-purity nickel strips, further driving demand. Moreover, the increasing adoption of renewable energy storage solutions, such as grid-scale batteries for solar and wind power, represents another substantial growth avenue.
Challenges in the Pure Nickel Strip Sector
Despite robust growth prospects, the pure nickel strip sector faces several challenges. Price volatility of raw nickel, a key input material, poses a significant threat to profit margins and can impact market stability. Stringent environmental regulations concerning nickel mining and processing can lead to increased operational costs and necessitate significant capital expenditure for compliance. Supply chain disruptions, exacerbated by geopolitical events or logistical hurdles, can affect the availability and timely delivery of pure nickel strips, impacting manufacturing schedules. Intense competition among market players, particularly from low-cost producers, can also exert downward pressure on pricing and profitability.
Leading Players in the Pure Nickel Strip Market
- AOT Battery Technology
- AMETEK Wallingford
- Smiths Metal Centers
- Technolloy
- Shijiazhuang Chengyuan Alloy Material
- Ulbrich Stainless Steels and Special Metals
- Alloyed Sustainables
- Jet Engineering
- SK Enterprises
- Wuxi Chiyue
- Shanghai Tankii Alloy Material
- Jiangsu Jiangneng New Material Technology
Key Developments in Pure Nickel Strip Sector
- 2023 Q4: AOT Battery Technology announced a significant investment in advanced nickel refining technology to achieve ultra-high purity levels, aiming to meet the demands of next-generation battery applications.
- 2024 Q1: AMETEK Wallingford introduced a new range of high-conductivity pure nickel strips specifically designed for high-discharge rate EV battery packs, enhancing thermal management capabilities.
- 2024 Q2: Smiths Metal Centers expanded its global distribution network to better serve the growing battery manufacturing hubs in Southeast Asia and Eastern Europe.
- 2024 Q3: Technolloy acquired a specialized nickel processing facility, increasing its production capacity for battery-grade nickel strips by an estimated 20%.
Strategic Pure Nickel Strip Market Outlook
The strategic outlook for the pure nickel strip market remains highly optimistic, driven by sustained global trends in electrification and technological advancement. The accelerating transition to electric mobility will continue to be the primary growth engine, demanding innovative and high-performance nickel strip solutions. Opportunities also lie in the expanding market for energy storage systems that support renewable energy integration. Companies that focus on product differentiation through enhanced purity, specialized properties, and sustainable manufacturing practices will be well-positioned for success. Strategic investments in R&D for advanced battery chemistries and strengthening supply chain resilience will be crucial for capturing future market potential and navigating evolving industry dynamics.
Pure Nickel Strip Segmentation
-
1. Application
- 1.1. High Capacity Lithium
- 1.2. Lithium Polymer Battery
- 1.3. NiMh and NiCd Battery Pack Battery
- 1.4. Others
-
2. Types
- 2.1. 0.1 mm-0.2 mm
- 2.2. 0.2 mm-0.3 mm
- 2.3. Others
Pure Nickel Strip Segmentation By Geography
-
1. North America
- 1.1. United States
- 1.2. Canada
- 1.3. Mexico
-
2. South America
- 2.1. Brazil
- 2.2. Argentina
- 2.3. Rest of South America
-
3. Europe
- 3.1. United Kingdom
- 3.2. Germany
- 3.3. France
- 3.4. Italy
- 3.5. Spain
- 3.6. Russia
- 3.7. Benelux
- 3.8. Nordics
- 3.9. Rest of Europe
-
4. Middle East & Africa
- 4.1. Turkey
- 4.2. Israel
- 4.3. GCC
- 4.4. North Africa
- 4.5. South Africa
- 4.6. Rest of Middle East & Africa
-
5. Asia Pacific
- 5.1. China
- 5.2. India
- 5.3. Japan
- 5.4. South Korea
- 5.5. ASEAN
- 5.6. Oceania
- 5.7. Rest of Asia Pacific
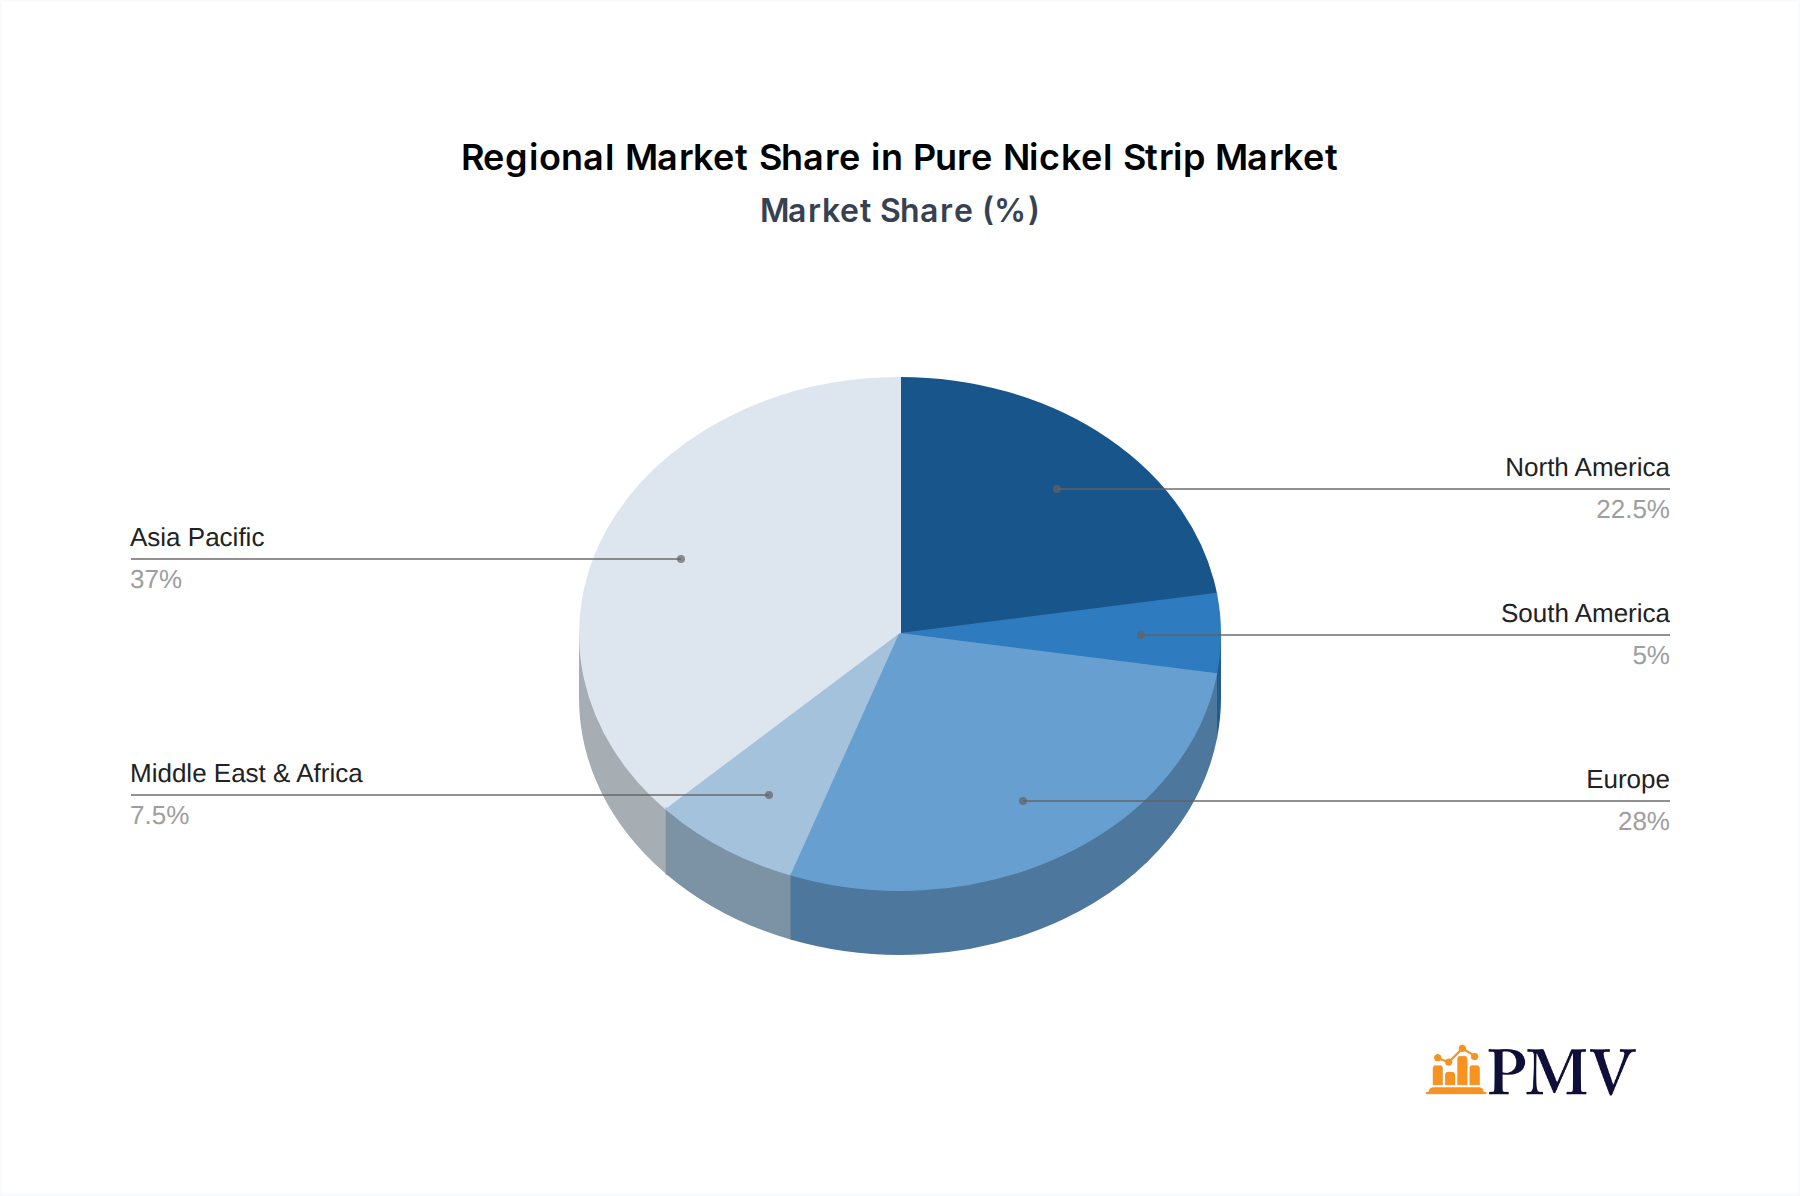
Pure Nickel Strip Regional Market Share
Geographic Coverage of Pure Nickel Strip
Pure Nickel Strip REPORT HIGHLIGHTS
| Aspects | Details |
|---|---|
| Study Period | 2020-2034 |
| Base Year | 2025 |
| Estimated Year | 2026 |
| Forecast Period | 2026-2034 |
| Historical Period | 2020-2025 |
| Growth Rate | CAGR of 4.9% from 2020-2034 |
| Segmentation |
|
Table of Contents
- 1. Introduction
- 1.1. Research Scope
- 1.2. Market Segmentation
- 1.3. Research Objective
- 1.4. Definitions and Assumptions
- 2. Executive Summary
- 2.1. Market Snapshot
- 3. Market Dynamics
- 3.1. Market Drivers
- 3.2. Market Restrains
- 3.3. Market Trends
- 3.4. Market Opportunities
- 4. Market Factor Analysis
- 4.1. Porters Five Forces
- 4.1.1. Bargaining Power of Suppliers
- 4.1.2. Bargaining Power of Buyers
- 4.1.3. Threat of New Entrants
- 4.1.4. Threat of Substitutes
- 4.1.5. Competitive Rivalry
- 4.2. PESTEL analysis
- 4.3. BCG Analysis
- 4.3.1. Stars (High Growth, High Market Share)
- 4.3.2. Cash Cows (Low Growth, High Market Share)
- 4.3.3. Question Mark (High Growth, Low Market Share)
- 4.3.4. Dogs (Low Growth, Low Market Share)
- 4.4. Ansoff Matrix Analysis
- 4.5. Supply Chain Analysis
- 4.6. Regulatory Landscape
- 4.7. Current Market Potential and Opportunity Assessment (TAM–SAM–SOM Framework)
- 4.8. PMV Analyst Note
- 4.1. Porters Five Forces
- 5. Market Analysis, Insights and Forecast 2021-2033
- 5.1. Market Analysis, Insights and Forecast - by Application
- 5.1.1. High Capacity Lithium
- 5.1.2. Lithium Polymer Battery
- 5.1.3. NiMh and NiCd Battery Pack Battery
- 5.1.4. Others
- 5.2. Market Analysis, Insights and Forecast - by Types
- 5.2.1. 0.1 mm-0.2 mm
- 5.2.2. 0.2 mm-0.3 mm
- 5.2.3. Others
- 5.3. Market Analysis, Insights and Forecast - by Region
- 5.3.1. North America
- 5.3.2. South America
- 5.3.3. Europe
- 5.3.4. Middle East & Africa
- 5.3.5. Asia Pacific
- 5.1. Market Analysis, Insights and Forecast - by Application
- 6. Global Pure Nickel Strip Analysis, Insights and Forecast, 2021-2033
- 6.1. Market Analysis, Insights and Forecast - by Application
- 6.1.1. High Capacity Lithium
- 6.1.2. Lithium Polymer Battery
- 6.1.3. NiMh and NiCd Battery Pack Battery
- 6.1.4. Others
- 6.2. Market Analysis, Insights and Forecast - by Types
- 6.2.1. 0.1 mm-0.2 mm
- 6.2.2. 0.2 mm-0.3 mm
- 6.2.3. Others
- 6.1. Market Analysis, Insights and Forecast - by Application
- 7. North America Pure Nickel Strip Analysis, Insights and Forecast, 2020-2032
- 7.1. Market Analysis, Insights and Forecast - by Application
- 7.1.1. High Capacity Lithium
- 7.1.2. Lithium Polymer Battery
- 7.1.3. NiMh and NiCd Battery Pack Battery
- 7.1.4. Others
- 7.2. Market Analysis, Insights and Forecast - by Types
- 7.2.1. 0.1 mm-0.2 mm
- 7.2.2. 0.2 mm-0.3 mm
- 7.2.3. Others
- 7.1. Market Analysis, Insights and Forecast - by Application
- 8. South America Pure Nickel Strip Analysis, Insights and Forecast, 2020-2032
- 8.1. Market Analysis, Insights and Forecast - by Application
- 8.1.1. High Capacity Lithium
- 8.1.2. Lithium Polymer Battery
- 8.1.3. NiMh and NiCd Battery Pack Battery
- 8.1.4. Others
- 8.2. Market Analysis, Insights and Forecast - by Types
- 8.2.1. 0.1 mm-0.2 mm
- 8.2.2. 0.2 mm-0.3 mm
- 8.2.3. Others
- 8.1. Market Analysis, Insights and Forecast - by Application
- 9. Europe Pure Nickel Strip Analysis, Insights and Forecast, 2020-2032
- 9.1. Market Analysis, Insights and Forecast - by Application
- 9.1.1. High Capacity Lithium
- 9.1.2. Lithium Polymer Battery
- 9.1.3. NiMh and NiCd Battery Pack Battery
- 9.1.4. Others
- 9.2. Market Analysis, Insights and Forecast - by Types
- 9.2.1. 0.1 mm-0.2 mm
- 9.2.2. 0.2 mm-0.3 mm
- 9.2.3. Others
- 9.1. Market Analysis, Insights and Forecast - by Application
- 10. Middle East & Africa Pure Nickel Strip Analysis, Insights and Forecast, 2020-2032
- 10.1. Market Analysis, Insights and Forecast - by Application
- 10.1.1. High Capacity Lithium
- 10.1.2. Lithium Polymer Battery
- 10.1.3. NiMh and NiCd Battery Pack Battery
- 10.1.4. Others
- 10.2. Market Analysis, Insights and Forecast - by Types
- 10.2.1. 0.1 mm-0.2 mm
- 10.2.2. 0.2 mm-0.3 mm
- 10.2.3. Others
- 10.1. Market Analysis, Insights and Forecast - by Application
- 11. Asia Pacific Pure Nickel Strip Analysis, Insights and Forecast, 2020-2032
- 11.1. Market Analysis, Insights and Forecast - by Application
- 11.1.1. High Capacity Lithium
- 11.1.2. Lithium Polymer Battery
- 11.1.3. NiMh and NiCd Battery Pack Battery
- 11.1.4. Others
- 11.2. Market Analysis, Insights and Forecast - by Types
- 11.2.1. 0.1 mm-0.2 mm
- 11.2.2. 0.2 mm-0.3 mm
- 11.2.3. Others
- 11.1. Market Analysis, Insights and Forecast - by Application
- 12. Competitive Analysis
- 12.1. Company Profiles
- 12.1.1 AOT Battery Technology
- 12.1.1.1. Company Overview
- 12.1.1.2. Products
- 12.1.1.3. Company Financials
- 12.1.1.4. SWOT Analysis
- 12.1.2 AMETEK Wallingford
- 12.1.2.1. Company Overview
- 12.1.2.2. Products
- 12.1.2.3. Company Financials
- 12.1.2.4. SWOT Analysis
- 12.1.3 Smiths Metal Centers
- 12.1.3.1. Company Overview
- 12.1.3.2. Products
- 12.1.3.3. Company Financials
- 12.1.3.4. SWOT Analysis
- 12.1.4 Technolloy
- 12.1.4.1. Company Overview
- 12.1.4.2. Products
- 12.1.4.3. Company Financials
- 12.1.4.4. SWOT Analysis
- 12.1.5 Shijiazhuang Chengyuan Alloy Material
- 12.1.5.1. Company Overview
- 12.1.5.2. Products
- 12.1.5.3. Company Financials
- 12.1.5.4. SWOT Analysis
- 12.1.6 Ulbrich Stainless Steels and Special Metals
- 12.1.6.1. Company Overview
- 12.1.6.2. Products
- 12.1.6.3. Company Financials
- 12.1.6.4. SWOT Analysis
- 12.1.7 Alloyed Sustainables
- 12.1.7.1. Company Overview
- 12.1.7.2. Products
- 12.1.7.3. Company Financials
- 12.1.7.4. SWOT Analysis
- 12.1.8 Jet Engineering
- 12.1.8.1. Company Overview
- 12.1.8.2. Products
- 12.1.8.3. Company Financials
- 12.1.8.4. SWOT Analysis
- 12.1.9 SK Enterprises
- 12.1.9.1. Company Overview
- 12.1.9.2. Products
- 12.1.9.3. Company Financials
- 12.1.9.4. SWOT Analysis
- 12.1.10 Wuxi Chiyue
- 12.1.10.1. Company Overview
- 12.1.10.2. Products
- 12.1.10.3. Company Financials
- 12.1.10.4. SWOT Analysis
- 12.1.11 Shanghai Tankii Alloy Material
- 12.1.11.1. Company Overview
- 12.1.11.2. Products
- 12.1.11.3. Company Financials
- 12.1.11.4. SWOT Analysis
- 12.1.12 Jiangsu Jiangneng New Material Technology
- 12.1.12.1. Company Overview
- 12.1.12.2. Products
- 12.1.12.3. Company Financials
- 12.1.12.4. SWOT Analysis
- 12.1.1 AOT Battery Technology
- 12.2. Market Entropy
- 12.2.1 Company's Key Areas Served
- 12.2.2 Recent Developments
- 12.3. Company Market Share Analysis 2025
- 12.3.1 Top 5 Companies Market Share Analysis
- 12.3.2 Top 3 Companies Market Share Analysis
- 12.4. List of Potential Customers
- 13. Research Methodology
List of Figures
- Figure 1: Global Pure Nickel Strip Revenue Breakdown (million, %) by Region 2025 & 2033
- Figure 2: North America Pure Nickel Strip Revenue (million), by Application 2025 & 2033
- Figure 3: North America Pure Nickel Strip Revenue Share (%), by Application 2025 & 2033
- Figure 4: North America Pure Nickel Strip Revenue (million), by Types 2025 & 2033
- Figure 5: North America Pure Nickel Strip Revenue Share (%), by Types 2025 & 2033
- Figure 6: North America Pure Nickel Strip Revenue (million), by Country 2025 & 2033
- Figure 7: North America Pure Nickel Strip Revenue Share (%), by Country 2025 & 2033
- Figure 8: South America Pure Nickel Strip Revenue (million), by Application 2025 & 2033
- Figure 9: South America Pure Nickel Strip Revenue Share (%), by Application 2025 & 2033
- Figure 10: South America Pure Nickel Strip Revenue (million), by Types 2025 & 2033
- Figure 11: South America Pure Nickel Strip Revenue Share (%), by Types 2025 & 2033
- Figure 12: South America Pure Nickel Strip Revenue (million), by Country 2025 & 2033
- Figure 13: South America Pure Nickel Strip Revenue Share (%), by Country 2025 & 2033
- Figure 14: Europe Pure Nickel Strip Revenue (million), by Application 2025 & 2033
- Figure 15: Europe Pure Nickel Strip Revenue Share (%), by Application 2025 & 2033
- Figure 16: Europe Pure Nickel Strip Revenue (million), by Types 2025 & 2033
- Figure 17: Europe Pure Nickel Strip Revenue Share (%), by Types 2025 & 2033
- Figure 18: Europe Pure Nickel Strip Revenue (million), by Country 2025 & 2033
- Figure 19: Europe Pure Nickel Strip Revenue Share (%), by Country 2025 & 2033
- Figure 20: Middle East & Africa Pure Nickel Strip Revenue (million), by Application 2025 & 2033
- Figure 21: Middle East & Africa Pure Nickel Strip Revenue Share (%), by Application 2025 & 2033
- Figure 22: Middle East & Africa Pure Nickel Strip Revenue (million), by Types 2025 & 2033
- Figure 23: Middle East & Africa Pure Nickel Strip Revenue Share (%), by Types 2025 & 2033
- Figure 24: Middle East & Africa Pure Nickel Strip Revenue (million), by Country 2025 & 2033
- Figure 25: Middle East & Africa Pure Nickel Strip Revenue Share (%), by Country 2025 & 2033
- Figure 26: Asia Pacific Pure Nickel Strip Revenue (million), by Application 2025 & 2033
- Figure 27: Asia Pacific Pure Nickel Strip Revenue Share (%), by Application 2025 & 2033
- Figure 28: Asia Pacific Pure Nickel Strip Revenue (million), by Types 2025 & 2033
- Figure 29: Asia Pacific Pure Nickel Strip Revenue Share (%), by Types 2025 & 2033
- Figure 30: Asia Pacific Pure Nickel Strip Revenue (million), by Country 2025 & 2033
- Figure 31: Asia Pacific Pure Nickel Strip Revenue Share (%), by Country 2025 & 2033
List of Tables
- Table 1: Global Pure Nickel Strip Revenue million Forecast, by Application 2020 & 2033
- Table 2: Global Pure Nickel Strip Revenue million Forecast, by Types 2020 & 2033
- Table 3: Global Pure Nickel Strip Revenue million Forecast, by Region 2020 & 2033
- Table 4: Global Pure Nickel Strip Revenue million Forecast, by Application 2020 & 2033
- Table 5: Global Pure Nickel Strip Revenue million Forecast, by Types 2020 & 2033
- Table 6: Global Pure Nickel Strip Revenue million Forecast, by Country 2020 & 2033
- Table 7: United States Pure Nickel Strip Revenue (million) Forecast, by Application 2020 & 2033
- Table 8: Canada Pure Nickel Strip Revenue (million) Forecast, by Application 2020 & 2033
- Table 9: Mexico Pure Nickel Strip Revenue (million) Forecast, by Application 2020 & 2033
- Table 10: Global Pure Nickel Strip Revenue million Forecast, by Application 2020 & 2033
- Table 11: Global Pure Nickel Strip Revenue million Forecast, by Types 2020 & 2033
- Table 12: Global Pure Nickel Strip Revenue million Forecast, by Country 2020 & 2033
- Table 13: Brazil Pure Nickel Strip Revenue (million) Forecast, by Application 2020 & 2033
- Table 14: Argentina Pure Nickel Strip Revenue (million) Forecast, by Application 2020 & 2033
- Table 15: Rest of South America Pure Nickel Strip Revenue (million) Forecast, by Application 2020 & 2033
- Table 16: Global Pure Nickel Strip Revenue million Forecast, by Application 2020 & 2033
- Table 17: Global Pure Nickel Strip Revenue million Forecast, by Types 2020 & 2033
- Table 18: Global Pure Nickel Strip Revenue million Forecast, by Country 2020 & 2033
- Table 19: United Kingdom Pure Nickel Strip Revenue (million) Forecast, by Application 2020 & 2033
- Table 20: Germany Pure Nickel Strip Revenue (million) Forecast, by Application 2020 & 2033
- Table 21: France Pure Nickel Strip Revenue (million) Forecast, by Application 2020 & 2033
- Table 22: Italy Pure Nickel Strip Revenue (million) Forecast, by Application 2020 & 2033
- Table 23: Spain Pure Nickel Strip Revenue (million) Forecast, by Application 2020 & 2033
- Table 24: Russia Pure Nickel Strip Revenue (million) Forecast, by Application 2020 & 2033
- Table 25: Benelux Pure Nickel Strip Revenue (million) Forecast, by Application 2020 & 2033
- Table 26: Nordics Pure Nickel Strip Revenue (million) Forecast, by Application 2020 & 2033
- Table 27: Rest of Europe Pure Nickel Strip Revenue (million) Forecast, by Application 2020 & 2033
- Table 28: Global Pure Nickel Strip Revenue million Forecast, by Application 2020 & 2033
- Table 29: Global Pure Nickel Strip Revenue million Forecast, by Types 2020 & 2033
- Table 30: Global Pure Nickel Strip Revenue million Forecast, by Country 2020 & 2033
- Table 31: Turkey Pure Nickel Strip Revenue (million) Forecast, by Application 2020 & 2033
- Table 32: Israel Pure Nickel Strip Revenue (million) Forecast, by Application 2020 & 2033
- Table 33: GCC Pure Nickel Strip Revenue (million) Forecast, by Application 2020 & 2033
- Table 34: North Africa Pure Nickel Strip Revenue (million) Forecast, by Application 2020 & 2033
- Table 35: South Africa Pure Nickel Strip Revenue (million) Forecast, by Application 2020 & 2033
- Table 36: Rest of Middle East & Africa Pure Nickel Strip Revenue (million) Forecast, by Application 2020 & 2033
- Table 37: Global Pure Nickel Strip Revenue million Forecast, by Application 2020 & 2033
- Table 38: Global Pure Nickel Strip Revenue million Forecast, by Types 2020 & 2033
- Table 39: Global Pure Nickel Strip Revenue million Forecast, by Country 2020 & 2033
- Table 40: China Pure Nickel Strip Revenue (million) Forecast, by Application 2020 & 2033
- Table 41: India Pure Nickel Strip Revenue (million) Forecast, by Application 2020 & 2033
- Table 42: Japan Pure Nickel Strip Revenue (million) Forecast, by Application 2020 & 2033
- Table 43: South Korea Pure Nickel Strip Revenue (million) Forecast, by Application 2020 & 2033
- Table 44: ASEAN Pure Nickel Strip Revenue (million) Forecast, by Application 2020 & 2033
- Table 45: Oceania Pure Nickel Strip Revenue (million) Forecast, by Application 2020 & 2033
- Table 46: Rest of Asia Pacific Pure Nickel Strip Revenue (million) Forecast, by Application 2020 & 2033
Frequently Asked Questions
1. What is the projected Compound Annual Growth Rate (CAGR) of the Pure Nickel Strip?
The projected CAGR is approximately 4.9%.
2. Which companies are prominent players in the Pure Nickel Strip?
Key companies in the market include AOT Battery Technology, AMETEK Wallingford, Smiths Metal Centers, Technolloy, Shijiazhuang Chengyuan Alloy Material, Ulbrich Stainless Steels and Special Metals, Alloyed Sustainables, Jet Engineering, SK Enterprises, Wuxi Chiyue, Shanghai Tankii Alloy Material, Jiangsu Jiangneng New Material Technology.
3. What are the main segments of the Pure Nickel Strip?
The market segments include Application, Types.
4. Can you provide details about the market size?
The market size is estimated to be USD 92 million as of 2022.
5. What are some drivers contributing to market growth?
N/A
6. What are the notable trends driving market growth?
N/A
7. Are there any restraints impacting market growth?
N/A
8. Can you provide examples of recent developments in the market?
N/A
9. What pricing options are available for accessing the report?
Pricing options include single-user, multi-user, and enterprise licenses priced at USD 4900.00, USD 7350.00, and USD 9800.00 respectively.
10. Is the market size provided in terms of value or volume?
The market size is provided in terms of value, measured in million.
11. Are there any specific market keywords associated with the report?
Yes, the market keyword associated with the report is "Pure Nickel Strip," which aids in identifying and referencing the specific market segment covered.
12. How do I determine which pricing option suits my needs best?
The pricing options vary based on user requirements and access needs. Individual users may opt for single-user licenses, while businesses requiring broader access may choose multi-user or enterprise licenses for cost-effective access to the report.
13. Are there any additional resources or data provided in the Pure Nickel Strip report?
While the report offers comprehensive insights, it's advisable to review the specific contents or supplementary materials provided to ascertain if additional resources or data are available.
14. How can I stay updated on further developments or reports in the Pure Nickel Strip?
To stay informed about further developments, trends, and reports in the Pure Nickel Strip, consider subscribing to industry newsletters, following relevant companies and organizations, or regularly checking reputable industry news sources and publications.
Methodology
Step 1 - Identification of Relevant Samples Size from Population Database


Step 2 - Approaches for Defining Global Market Size (Value, Volume* & Price*)

Note*: In applicable scenarios
Step 3 - Data Sources
Primary Research
- Web Analytics
- Survey Reports
- Research Institute
- Latest Research Reports
- Opinion Leaders
Secondary Research
- Annual Reports
- White Paper
- Latest Press Release
- Industry Association
- Paid Database
- Investor Presentations

Step 4 - Data Triangulation
Involves using different sources of information in order to increase the validity of a study
These sources are likely to be stakeholders in a program - participants, other researchers, program staff, other community members, and so on.
Then we put all data in single framework & apply various statistical tools to find out the dynamic on the market.
During the analysis stage, feedback from the stakeholder groups would be compared to determine areas of agreement as well as areas of divergence

