

Key Insights
The global pure gas market is poised for significant expansion, projected to reach 119.11 billion by 2025, driven by a Compound Annual Growth Rate (CAGR) of 4.4%. This growth is propelled by escalating demand across critical sectors, including electronics manufacturing, with particular emphasis on semiconductor production and the burgeoning electric vehicle industry. The medical and healthcare sector's increasing reliance on diagnostic and therapeutic applications, alongside advancements in metal production for high-performance materials, are also key drivers. The transition towards sustainable technologies, such as fuel cells and advanced energy storage, further stimulates market expansion. Innovations in gas purification and delivery systems, enhancing efficiency and reducing costs, also contribute to this positive trajectory. The Asia-Pacific region, led by China and India, is anticipated to be the dominant market due to rapid industrialization and expanding manufacturing capacities.
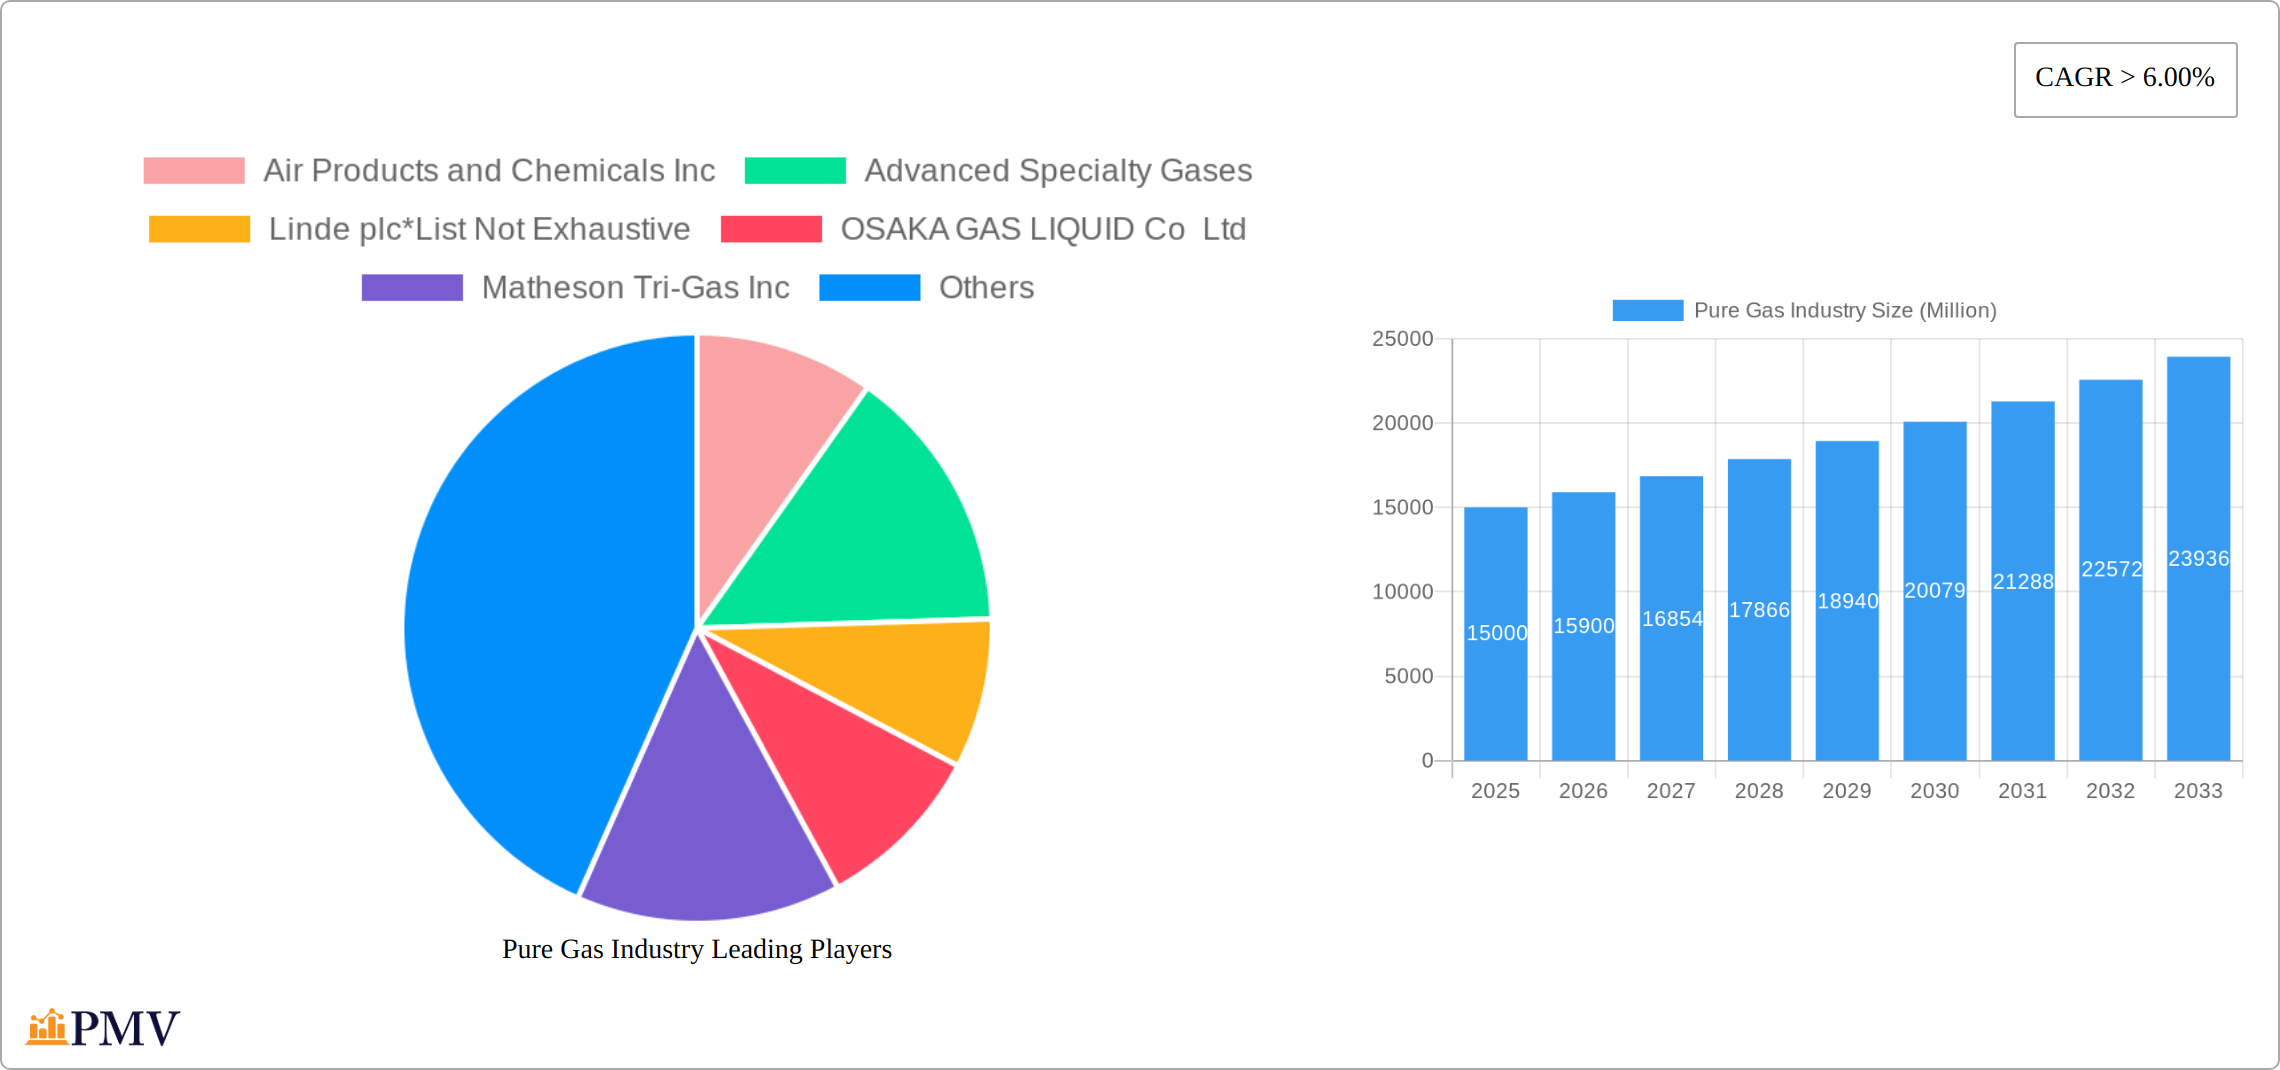
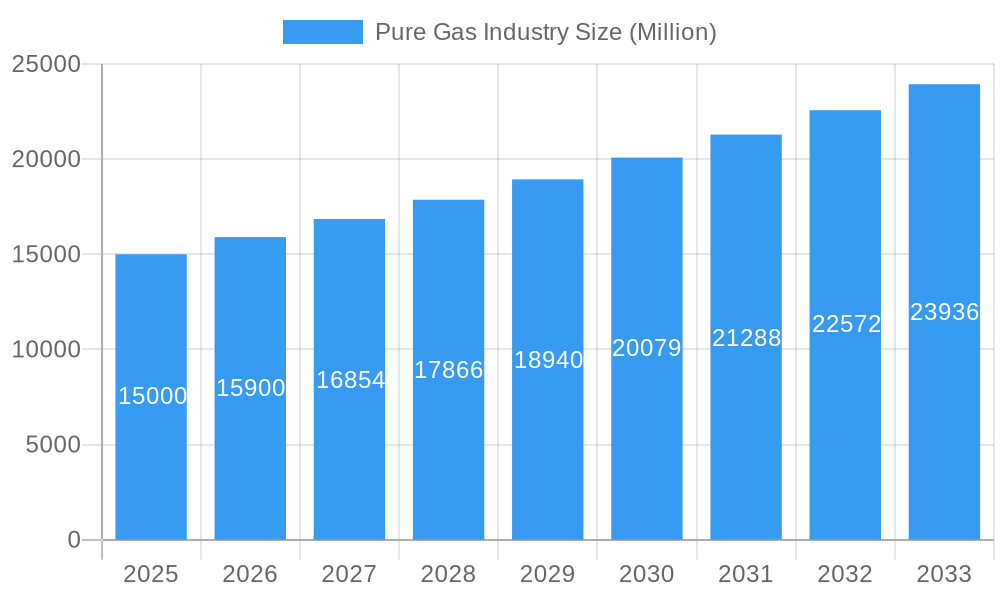
Pure Gas Industry Market Size (In Billion)
Despite positive growth prospects, the market faces certain constraints. Volatility in raw material and energy prices can impact production costs and profitability. Stringent environmental regulations and safety considerations associated with the handling and transport of industrial gases present ongoing challenges. Intensifying competition from established players and new market entrants adds to the dynamic landscape. Nevertheless, the pure gas industry's long-term outlook remains robust, supported by the sustained growth of its core end-use industries and continuous technological advancements that broaden applications and enhance operational efficiencies. Market segmentation by product type (e.g., high-purity atmospheric gases, noble gases, carbon gases) and application (e.g., insulation, lighting, coolant) offers granular insights into specific market dynamics and growth opportunities. Analysis of regional trends, including government initiatives supporting sustainability, will be crucial for strategic planning.
Pure Gas Industry Company Market Share
Pure Gas Industry Market Report: 2019-2033 Forecast
This comprehensive report provides a detailed analysis of the global Pure Gas market, offering invaluable insights for industry stakeholders. With a study period spanning 2019-2033, a base year of 2025, and an estimated and forecast period of 2025-2033, this report is your definitive guide to understanding the current landscape and future trajectory of this dynamic sector. The report leverages historical data (2019-2024) to provide accurate projections and actionable intelligence. The market size is projected to reach xx Million by 2033, exhibiting a CAGR of xx% during the forecast period.
Pure Gas Industry Market Structure & Competitive Dynamics
The pure gas industry's competitive landscape is moderately concentrated, shaped by key players such as Air Products and Chemicals Inc. (Air Products and Chemicals Inc), Linde plc (Linde plc), Air Liquide (Air Liquide), Messer Group, Matheson Tri-Gas Inc, Iwatani Corporation, Osaka Gas Liquid Co Ltd, and Airgas Inc. These companies hold significant market share, contributing to an estimated 2025 market value of [Insert Updated Market Value in Millions]. This competitive dynamic is further analyzed below:
- Market Concentration: A Herfindahl-Hirschman Index (HHI) of [Insert Updated HHI Value] suggests a moderately concentrated market, indicating a balance between competition and consolidation.
- Innovation Ecosystems: Robust R&D investments fuel continuous innovation in gas purification technologies and efficient delivery systems, enhancing product quality and expanding market applications.
- Regulatory Frameworks: Stringent safety and environmental regulations, while increasing operational costs, also drive innovation toward more sustainable and environmentally friendly production methods and technologies.
- Product Substitutes: While limited direct substitutes exist currently, the emergence of alternative technologies presents a potential long-term competitive threat, requiring ongoing adaptation and innovation within the industry.
- End-user Trends: The burgeoning demand for high-purity gases across diverse sectors, particularly electronics and healthcare, remains a primary driver of market growth, fueling ongoing expansion and specialization within the industry.
- Mergers & Acquisitions (M&A) Activities: The past five years have witnessed significant M&A activity, with total deal values exceeding [Insert Updated M&A Value in Millions]. [Insert Specific M&A deal examples if available; otherwise, state: Detailed information on recent M&A activity is available in the full report]. This consolidation trend is expected to continue shaping the competitive landscape.
Pure Gas Industry Industry Trends & Insights
The pure gas industry is experiencing robust growth, fueled by increasing demand from diverse end-use sectors. This growth is driven by technological advancements, evolving consumer preferences, and the expansion of key industries. Key trends shaping the market include:
- Growth Drivers: The electronics industry's rapid expansion, the healthcare sector's continued growth, and the rising demand for specialized gases in industrial processes are all significant contributors to market expansion.
- Technological Disruptions: Advancements in gas purification and separation techniques, coupled with innovations in delivery and storage systems, are transforming industry processes, enhancing efficiency, and creating new opportunities.
- Consumer Preferences: The increasing emphasis on high purity, reliable supply chains, and sustainable sourcing practices is influencing purchasing decisions and driving demand for environmentally conscious products and services.
- Competitive Dynamics: Intense competition among leading players fosters innovation and cost optimization, although price wars in some segments are observed. The market is projected to experience a Compound Annual Growth Rate (CAGR) of [Insert Updated CAGR Value]% from 2025 to 2033, reaching a value of [Insert Updated Market Value in Millions]. Specifically, market penetration of high-purity atmospheric gases in the electronics sector is expected to reach [Insert Updated Penetration Percentage]% by 2033.
Dominant Markets & Segments in Pure Gas Industry
The pure gas market exhibits regional and segmental variations in growth and dominance. Key market characteristics include:
- Leading Region: The Asia-Pacific region is poised for continued dominance, driven by robust economic growth and industrial expansion in major economies like China and India.
- Leading Country: China's substantial manufacturing base and ongoing infrastructure development solidify its position as the largest consumer of pure gases globally.
- Dominant Product Types: High-purity atmospheric gases (oxygen, nitrogen, argon) and noble gases (helium, neon) constitute a significant portion of the market share.
- Dominant Applications: The electronics and metal production industries are major consumers, utilizing pure gases extensively in processes such as etching, cooling, and inerting.
- Dominant End-user Industries: Electronics and metal production remain the dominant end-user industries due to their high consumption of pure gases across various applications.
- Key Drivers:
- Supportive Economic Policies: Government initiatives promoting industrial development and technological advancement stimulate market growth.
- Infrastructure Development: Ongoing infrastructure expansion in emerging economies creates significant growth opportunities.
- Technological Advancements: Innovations in gas purification and delivery technologies continually open new market opportunities and drive market expansion.
Pure Gas Industry Product Innovations
The pure gas industry is witnessing continuous innovation in purification technologies and delivery systems. Advancements in membrane separation, cryogenic distillation, and pressure swing adsorption are leading to higher purity levels and improved efficiency. New applications are constantly emerging, driven by technological advancements in sectors like semiconductor manufacturing and medical diagnostics. These innovations are creating competitive advantages for companies that can effectively leverage them to offer superior products and services.
Report Segmentation & Scope
This report provides a detailed segmentation of the pure gas market based on product type, application, and end-user industry. Each segment is analyzed in detail, offering insights into market size, growth projections, and competitive dynamics. For example:
- Product Type: High-Purity Atmospheric Gases, Noble Gases, Carbon Gases, Other Product Types, each have detailed analysis of market size and growth projections.
- Application: Insulation, Lighting, Coolant, Other Applications, each have specific market projections and competitive dynamics analyzed.
- End-user Industry: Electronics, Metal Production, Chemicals, Energy and Power, Medical and Healthcare, Food and Beverages, Other End-user Industries, each have their market sizes and growth rates detailed.
Key Drivers of Pure Gas Industry Growth
The pure gas industry's growth is driven by a combination of factors, including rapid industrialization, particularly in developing economies; the increasing demand for higher purity gases in various applications; stringent environmental regulations promoting cleaner production processes; and the widespread adoption of advanced technologies in healthcare and electronics. These factors collectively contribute to sustained market expansion and growth.
Challenges in the Pure Gas Industry Sector
The pure gas industry faces several challenges, including volatile raw material prices, stringent safety regulations impacting operational costs, and intense competition among established players. Supply chain disruptions, geopolitical instability, and the need for sustainable sourcing practices further add to the complexity of the market. These factors can significantly impact profitability and market growth.
Leading Players in the Pure Gas Industry Market
- Air Products and Chemicals Inc
- Advanced Specialty Gases
- Linde plc
- OSAKA GAS LIQUID Co Ltd
- Matheson Tri-Gas Inc
- Iwatani Corporation
- American Welding & Gas
- Messer Group
- Air Liquide
- Airgas Inc
Key Developments in Pure Gas Industry Sector
- [Month/Year]: [Specific development, e.g., Air Liquide announces new investment in a state-of-the-art gas purification facility].
- [Month/Year]: [Specific development, e.g., Linde plc launches a new line of high-purity gases for the semiconductor industry].
- [Month/Year]: [Specific development, e.g., A significant merger or acquisition takes place in the industry]. (Further key developments are detailed in the full report)
Strategic Pure Gas Industry Market Outlook
The pure gas industry is expected to maintain a trajectory of continued growth, propelled by technological advancements, expanding end-use applications, and increasing demand from emerging markets. Companies that focus on innovation, sustainable sourcing, and efficient supply chain management are well-positioned to capitalize on strategic opportunities. Further market consolidation is anticipated, with larger players likely acquiring smaller companies to expand their market share and product portfolios. The development of novel applications and specialized gas mixtures will play a significant role in driving future growth and shaping the industry's landscape.
Pure Gas Industry Segmentation
-
1. Product Type
- 1.1. High-Purity Atmospheric Gases
- 1.2. Noble Gases
- 1.3. Carbon Gases
- 1.4. Other Product Types
-
2. Application
- 2.1. Insulation
- 2.2. Lighting
- 2.3. Coolant
- 2.4. Other Applications
-
3. End-user Industry
- 3.1. Electronics
- 3.2. Metal Production
- 3.3. Chemicals
- 3.4. Energy and Power
- 3.5. Medical and Healthcare
- 3.6. Food and Beverages
- 3.7. Other End-user Industries
Pure Gas Industry Segmentation By Geography
-
1. Asia Pacific
- 1.1. China
- 1.2. India
- 1.3. Japan
- 1.4. South Korea
- 1.5. ASEAN Countries
- 1.6. Rest of Asia Pacific
-
2. North America
- 2.1. United States
- 2.2. Canada
- 2.3. Mexico
-
3. Europe
- 3.1. Germany
- 3.2. United Kingdom
- 3.3. Italy
- 3.4. France
- 3.5. Rest of Europe
-
4. South America
- 4.1. Brazil
- 4.2. Argentina
- 4.3. Rest of South America
-
5. Middle East and Africa
- 5.1. Saudi Arabia
- 5.2. South Africa
- 5.3. Rest of Middle East and Africa
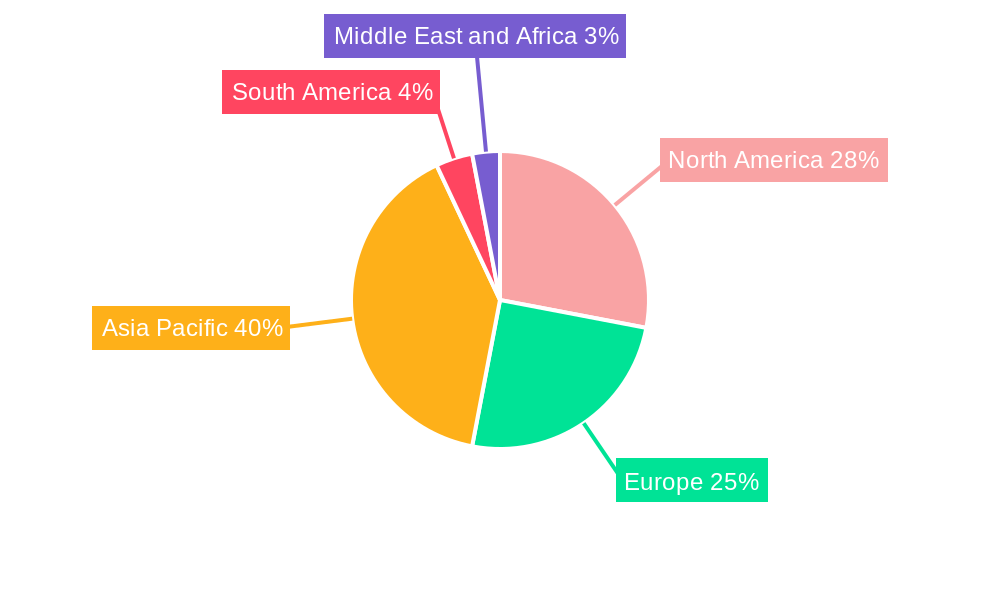
Pure Gas Industry Regional Market Share
Geographic Coverage of Pure Gas Industry
Pure Gas Industry REPORT HIGHLIGHTS
| Aspects | Details |
|---|---|
| Study Period | 2020-2034 |
| Base Year | 2025 |
| Estimated Year | 2026 |
| Forecast Period | 2026-2034 |
| Historical Period | 2020-2025 |
| Growth Rate | CAGR of 4.4% from 2020-2034 |
| Segmentation |
|
Table of Contents
- 1. Introduction
- 1.1. Research Scope
- 1.2. Market Segmentation
- 1.3. Research Objective
- 1.4. Definitions and Assumptions
- 2. Executive Summary
- 2.1. Market Snapshot
- 3. Market Dynamics
- 3.1. Market Drivers
- 3.2. Market Restrains
- 3.3. Market Trends
- 3.4. Market Opportunities
- 4. Market Factor Analysis
- 4.1. Porters Five Forces
- 4.1.1. Bargaining Power of Suppliers
- 4.1.2. Bargaining Power of Buyers
- 4.1.3. Threat of New Entrants
- 4.1.4. Threat of Substitutes
- 4.1.5. Competitive Rivalry
- 4.2. PESTEL analysis
- 4.3. BCG Analysis
- 4.3.1. Stars (High Growth, High Market Share)
- 4.3.2. Cash Cows (Low Growth, High Market Share)
- 4.3.3. Question Mark (High Growth, Low Market Share)
- 4.3.4. Dogs (Low Growth, Low Market Share)
- 4.4. Ansoff Matrix Analysis
- 4.5. Supply Chain Analysis
- 4.6. Regulatory Landscape
- 4.7. Current Market Potential and Opportunity Assessment (TAM–SAM–SOM Framework)
- 4.8. PMV Analyst Note
- 4.1. Porters Five Forces
- 5. Market Analysis, Insights and Forecast 2021-2033
- 5.1. Market Analysis, Insights and Forecast - by Product Type
- 5.1.1. High-Purity Atmospheric Gases
- 5.1.2. Noble Gases
- 5.1.3. Carbon Gases
- 5.1.4. Other Product Types
- 5.2. Market Analysis, Insights and Forecast - by Application
- 5.2.1. Insulation
- 5.2.2. Lighting
- 5.2.3. Coolant
- 5.2.4. Other Applications
- 5.3. Market Analysis, Insights and Forecast - by End-user Industry
- 5.3.1. Electronics
- 5.3.2. Metal Production
- 5.3.3. Chemicals
- 5.3.4. Energy and Power
- 5.3.5. Medical and Healthcare
- 5.3.6. Food and Beverages
- 5.3.7. Other End-user Industries
- 5.4. Market Analysis, Insights and Forecast - by Region
- 5.4.1. Asia Pacific
- 5.4.2. North America
- 5.4.3. Europe
- 5.4.4. South America
- 5.4.5. Middle East and Africa
- 5.1. Market Analysis, Insights and Forecast - by Product Type
- 6. Global Pure Gas Industry Analysis, Insights and Forecast, 2021-2033
- 6.1. Market Analysis, Insights and Forecast - by Product Type
- 6.1.1. High-Purity Atmospheric Gases
- 6.1.2. Noble Gases
- 6.1.3. Carbon Gases
- 6.1.4. Other Product Types
- 6.2. Market Analysis, Insights and Forecast - by Application
- 6.2.1. Insulation
- 6.2.2. Lighting
- 6.2.3. Coolant
- 6.2.4. Other Applications
- 6.3. Market Analysis, Insights and Forecast - by End-user Industry
- 6.3.1. Electronics
- 6.3.2. Metal Production
- 6.3.3. Chemicals
- 6.3.4. Energy and Power
- 6.3.5. Medical and Healthcare
- 6.3.6. Food and Beverages
- 6.3.7. Other End-user Industries
- 6.1. Market Analysis, Insights and Forecast - by Product Type
- 7. Asia Pacific Pure Gas Industry Analysis, Insights and Forecast, 2020-2032
- 7.1. Market Analysis, Insights and Forecast - by Product Type
- 7.1.1. High-Purity Atmospheric Gases
- 7.1.2. Noble Gases
- 7.1.3. Carbon Gases
- 7.1.4. Other Product Types
- 7.2. Market Analysis, Insights and Forecast - by Application
- 7.2.1. Insulation
- 7.2.2. Lighting
- 7.2.3. Coolant
- 7.2.4. Other Applications
- 7.3. Market Analysis, Insights and Forecast - by End-user Industry
- 7.3.1. Electronics
- 7.3.2. Metal Production
- 7.3.3. Chemicals
- 7.3.4. Energy and Power
- 7.3.5. Medical and Healthcare
- 7.3.6. Food and Beverages
- 7.3.7. Other End-user Industries
- 7.1. Market Analysis, Insights and Forecast - by Product Type
- 8. North America Pure Gas Industry Analysis, Insights and Forecast, 2020-2032
- 8.1. Market Analysis, Insights and Forecast - by Product Type
- 8.1.1. High-Purity Atmospheric Gases
- 8.1.2. Noble Gases
- 8.1.3. Carbon Gases
- 8.1.4. Other Product Types
- 8.2. Market Analysis, Insights and Forecast - by Application
- 8.2.1. Insulation
- 8.2.2. Lighting
- 8.2.3. Coolant
- 8.2.4. Other Applications
- 8.3. Market Analysis, Insights and Forecast - by End-user Industry
- 8.3.1. Electronics
- 8.3.2. Metal Production
- 8.3.3. Chemicals
- 8.3.4. Energy and Power
- 8.3.5. Medical and Healthcare
- 8.3.6. Food and Beverages
- 8.3.7. Other End-user Industries
- 8.1. Market Analysis, Insights and Forecast - by Product Type
- 9. Europe Pure Gas Industry Analysis, Insights and Forecast, 2020-2032
- 9.1. Market Analysis, Insights and Forecast - by Product Type
- 9.1.1. High-Purity Atmospheric Gases
- 9.1.2. Noble Gases
- 9.1.3. Carbon Gases
- 9.1.4. Other Product Types
- 9.2. Market Analysis, Insights and Forecast - by Application
- 9.2.1. Insulation
- 9.2.2. Lighting
- 9.2.3. Coolant
- 9.2.4. Other Applications
- 9.3. Market Analysis, Insights and Forecast - by End-user Industry
- 9.3.1. Electronics
- 9.3.2. Metal Production
- 9.3.3. Chemicals
- 9.3.4. Energy and Power
- 9.3.5. Medical and Healthcare
- 9.3.6. Food and Beverages
- 9.3.7. Other End-user Industries
- 9.1. Market Analysis, Insights and Forecast - by Product Type
- 10. South America Pure Gas Industry Analysis, Insights and Forecast, 2020-2032
- 10.1. Market Analysis, Insights and Forecast - by Product Type
- 10.1.1. High-Purity Atmospheric Gases
- 10.1.2. Noble Gases
- 10.1.3. Carbon Gases
- 10.1.4. Other Product Types
- 10.2. Market Analysis, Insights and Forecast - by Application
- 10.2.1. Insulation
- 10.2.2. Lighting
- 10.2.3. Coolant
- 10.2.4. Other Applications
- 10.3. Market Analysis, Insights and Forecast - by End-user Industry
- 10.3.1. Electronics
- 10.3.2. Metal Production
- 10.3.3. Chemicals
- 10.3.4. Energy and Power
- 10.3.5. Medical and Healthcare
- 10.3.6. Food and Beverages
- 10.3.7. Other End-user Industries
- 10.1. Market Analysis, Insights and Forecast - by Product Type
- 11. Middle East and Africa Pure Gas Industry Analysis, Insights and Forecast, 2020-2032
- 11.1. Market Analysis, Insights and Forecast - by Product Type
- 11.1.1. High-Purity Atmospheric Gases
- 11.1.2. Noble Gases
- 11.1.3. Carbon Gases
- 11.1.4. Other Product Types
- 11.2. Market Analysis, Insights and Forecast - by Application
- 11.2.1. Insulation
- 11.2.2. Lighting
- 11.2.3. Coolant
- 11.2.4. Other Applications
- 11.3. Market Analysis, Insights and Forecast - by End-user Industry
- 11.3.1. Electronics
- 11.3.2. Metal Production
- 11.3.3. Chemicals
- 11.3.4. Energy and Power
- 11.3.5. Medical and Healthcare
- 11.3.6. Food and Beverages
- 11.3.7. Other End-user Industries
- 11.1. Market Analysis, Insights and Forecast - by Product Type
- 12. Competitive Analysis
- 12.1. Company Profiles
- 12.1.1 Air Products and Chemicals Inc
- 12.1.1.1. Company Overview
- 12.1.1.2. Products
- 12.1.1.3. Company Financials
- 12.1.1.4. SWOT Analysis
- 12.1.2 Advanced Specialty Gases
- 12.1.2.1. Company Overview
- 12.1.2.2. Products
- 12.1.2.3. Company Financials
- 12.1.2.4. SWOT Analysis
- 12.1.3 Linde plc*List Not Exhaustive
- 12.1.3.1. Company Overview
- 12.1.3.2. Products
- 12.1.3.3. Company Financials
- 12.1.3.4. SWOT Analysis
- 12.1.4 OSAKA GAS LIQUID Co Ltd
- 12.1.4.1. Company Overview
- 12.1.4.2. Products
- 12.1.4.3. Company Financials
- 12.1.4.4. SWOT Analysis
- 12.1.5 Matheson Tri-Gas Inc
- 12.1.5.1. Company Overview
- 12.1.5.2. Products
- 12.1.5.3. Company Financials
- 12.1.5.4. SWOT Analysis
- 12.1.6 Iwatani Corporation
- 12.1.6.1. Company Overview
- 12.1.6.2. Products
- 12.1.6.3. Company Financials
- 12.1.6.4. SWOT Analysis
- 12.1.7 American Welding & Gas
- 12.1.7.1. Company Overview
- 12.1.7.2. Products
- 12.1.7.3. Company Financials
- 12.1.7.4. SWOT Analysis
- 12.1.8 Messer Group
- 12.1.8.1. Company Overview
- 12.1.8.2. Products
- 12.1.8.3. Company Financials
- 12.1.8.4. SWOT Analysis
- 12.1.9 Air Liquide
- 12.1.9.1. Company Overview
- 12.1.9.2. Products
- 12.1.9.3. Company Financials
- 12.1.9.4. SWOT Analysis
- 12.1.10 Airgas Inc
- 12.1.10.1. Company Overview
- 12.1.10.2. Products
- 12.1.10.3. Company Financials
- 12.1.10.4. SWOT Analysis
- 12.1.1 Air Products and Chemicals Inc
- 12.2. Market Entropy
- 12.2.1 Company's Key Areas Served
- 12.2.2 Recent Developments
- 12.3. Company Market Share Analysis 2025
- 12.3.1 Top 5 Companies Market Share Analysis
- 12.3.2 Top 3 Companies Market Share Analysis
- 12.4. List of Potential Customers
- 13. Research Methodology
List of Figures
- Figure 1: Global Pure Gas Industry Revenue Breakdown (billion, %) by Region 2025 & 2033
- Figure 2: Asia Pacific Pure Gas Industry Revenue (billion), by Product Type 2025 & 2033
- Figure 3: Asia Pacific Pure Gas Industry Revenue Share (%), by Product Type 2025 & 2033
- Figure 4: Asia Pacific Pure Gas Industry Revenue (billion), by Application 2025 & 2033
- Figure 5: Asia Pacific Pure Gas Industry Revenue Share (%), by Application 2025 & 2033
- Figure 6: Asia Pacific Pure Gas Industry Revenue (billion), by End-user Industry 2025 & 2033
- Figure 7: Asia Pacific Pure Gas Industry Revenue Share (%), by End-user Industry 2025 & 2033
- Figure 8: Asia Pacific Pure Gas Industry Revenue (billion), by Country 2025 & 2033
- Figure 9: Asia Pacific Pure Gas Industry Revenue Share (%), by Country 2025 & 2033
- Figure 10: North America Pure Gas Industry Revenue (billion), by Product Type 2025 & 2033
- Figure 11: North America Pure Gas Industry Revenue Share (%), by Product Type 2025 & 2033
- Figure 12: North America Pure Gas Industry Revenue (billion), by Application 2025 & 2033
- Figure 13: North America Pure Gas Industry Revenue Share (%), by Application 2025 & 2033
- Figure 14: North America Pure Gas Industry Revenue (billion), by End-user Industry 2025 & 2033
- Figure 15: North America Pure Gas Industry Revenue Share (%), by End-user Industry 2025 & 2033
- Figure 16: North America Pure Gas Industry Revenue (billion), by Country 2025 & 2033
- Figure 17: North America Pure Gas Industry Revenue Share (%), by Country 2025 & 2033
- Figure 18: Europe Pure Gas Industry Revenue (billion), by Product Type 2025 & 2033
- Figure 19: Europe Pure Gas Industry Revenue Share (%), by Product Type 2025 & 2033
- Figure 20: Europe Pure Gas Industry Revenue (billion), by Application 2025 & 2033
- Figure 21: Europe Pure Gas Industry Revenue Share (%), by Application 2025 & 2033
- Figure 22: Europe Pure Gas Industry Revenue (billion), by End-user Industry 2025 & 2033
- Figure 23: Europe Pure Gas Industry Revenue Share (%), by End-user Industry 2025 & 2033
- Figure 24: Europe Pure Gas Industry Revenue (billion), by Country 2025 & 2033
- Figure 25: Europe Pure Gas Industry Revenue Share (%), by Country 2025 & 2033
- Figure 26: South America Pure Gas Industry Revenue (billion), by Product Type 2025 & 2033
- Figure 27: South America Pure Gas Industry Revenue Share (%), by Product Type 2025 & 2033
- Figure 28: South America Pure Gas Industry Revenue (billion), by Application 2025 & 2033
- Figure 29: South America Pure Gas Industry Revenue Share (%), by Application 2025 & 2033
- Figure 30: South America Pure Gas Industry Revenue (billion), by End-user Industry 2025 & 2033
- Figure 31: South America Pure Gas Industry Revenue Share (%), by End-user Industry 2025 & 2033
- Figure 32: South America Pure Gas Industry Revenue (billion), by Country 2025 & 2033
- Figure 33: South America Pure Gas Industry Revenue Share (%), by Country 2025 & 2033
- Figure 34: Middle East and Africa Pure Gas Industry Revenue (billion), by Product Type 2025 & 2033
- Figure 35: Middle East and Africa Pure Gas Industry Revenue Share (%), by Product Type 2025 & 2033
- Figure 36: Middle East and Africa Pure Gas Industry Revenue (billion), by Application 2025 & 2033
- Figure 37: Middle East and Africa Pure Gas Industry Revenue Share (%), by Application 2025 & 2033
- Figure 38: Middle East and Africa Pure Gas Industry Revenue (billion), by End-user Industry 2025 & 2033
- Figure 39: Middle East and Africa Pure Gas Industry Revenue Share (%), by End-user Industry 2025 & 2033
- Figure 40: Middle East and Africa Pure Gas Industry Revenue (billion), by Country 2025 & 2033
- Figure 41: Middle East and Africa Pure Gas Industry Revenue Share (%), by Country 2025 & 2033
List of Tables
- Table 1: Global Pure Gas Industry Revenue billion Forecast, by Product Type 2020 & 2033
- Table 2: Global Pure Gas Industry Revenue billion Forecast, by Application 2020 & 2033
- Table 3: Global Pure Gas Industry Revenue billion Forecast, by End-user Industry 2020 & 2033
- Table 4: Global Pure Gas Industry Revenue billion Forecast, by Region 2020 & 2033
- Table 5: Global Pure Gas Industry Revenue billion Forecast, by Product Type 2020 & 2033
- Table 6: Global Pure Gas Industry Revenue billion Forecast, by Application 2020 & 2033
- Table 7: Global Pure Gas Industry Revenue billion Forecast, by End-user Industry 2020 & 2033
- Table 8: Global Pure Gas Industry Revenue billion Forecast, by Country 2020 & 2033
- Table 9: China Pure Gas Industry Revenue (billion) Forecast, by Application 2020 & 2033
- Table 10: India Pure Gas Industry Revenue (billion) Forecast, by Application 2020 & 2033
- Table 11: Japan Pure Gas Industry Revenue (billion) Forecast, by Application 2020 & 2033
- Table 12: South Korea Pure Gas Industry Revenue (billion) Forecast, by Application 2020 & 2033
- Table 13: ASEAN Countries Pure Gas Industry Revenue (billion) Forecast, by Application 2020 & 2033
- Table 14: Rest of Asia Pacific Pure Gas Industry Revenue (billion) Forecast, by Application 2020 & 2033
- Table 15: Global Pure Gas Industry Revenue billion Forecast, by Product Type 2020 & 2033
- Table 16: Global Pure Gas Industry Revenue billion Forecast, by Application 2020 & 2033
- Table 17: Global Pure Gas Industry Revenue billion Forecast, by End-user Industry 2020 & 2033
- Table 18: Global Pure Gas Industry Revenue billion Forecast, by Country 2020 & 2033
- Table 19: United States Pure Gas Industry Revenue (billion) Forecast, by Application 2020 & 2033
- Table 20: Canada Pure Gas Industry Revenue (billion) Forecast, by Application 2020 & 2033
- Table 21: Mexico Pure Gas Industry Revenue (billion) Forecast, by Application 2020 & 2033
- Table 22: Global Pure Gas Industry Revenue billion Forecast, by Product Type 2020 & 2033
- Table 23: Global Pure Gas Industry Revenue billion Forecast, by Application 2020 & 2033
- Table 24: Global Pure Gas Industry Revenue billion Forecast, by End-user Industry 2020 & 2033
- Table 25: Global Pure Gas Industry Revenue billion Forecast, by Country 2020 & 2033
- Table 26: Germany Pure Gas Industry Revenue (billion) Forecast, by Application 2020 & 2033
- Table 27: United Kingdom Pure Gas Industry Revenue (billion) Forecast, by Application 2020 & 2033
- Table 28: Italy Pure Gas Industry Revenue (billion) Forecast, by Application 2020 & 2033
- Table 29: France Pure Gas Industry Revenue (billion) Forecast, by Application 2020 & 2033
- Table 30: Rest of Europe Pure Gas Industry Revenue (billion) Forecast, by Application 2020 & 2033
- Table 31: Global Pure Gas Industry Revenue billion Forecast, by Product Type 2020 & 2033
- Table 32: Global Pure Gas Industry Revenue billion Forecast, by Application 2020 & 2033
- Table 33: Global Pure Gas Industry Revenue billion Forecast, by End-user Industry 2020 & 2033
- Table 34: Global Pure Gas Industry Revenue billion Forecast, by Country 2020 & 2033
- Table 35: Brazil Pure Gas Industry Revenue (billion) Forecast, by Application 2020 & 2033
- Table 36: Argentina Pure Gas Industry Revenue (billion) Forecast, by Application 2020 & 2033
- Table 37: Rest of South America Pure Gas Industry Revenue (billion) Forecast, by Application 2020 & 2033
- Table 38: Global Pure Gas Industry Revenue billion Forecast, by Product Type 2020 & 2033
- Table 39: Global Pure Gas Industry Revenue billion Forecast, by Application 2020 & 2033
- Table 40: Global Pure Gas Industry Revenue billion Forecast, by End-user Industry 2020 & 2033
- Table 41: Global Pure Gas Industry Revenue billion Forecast, by Country 2020 & 2033
- Table 42: Saudi Arabia Pure Gas Industry Revenue (billion) Forecast, by Application 2020 & 2033
- Table 43: South Africa Pure Gas Industry Revenue (billion) Forecast, by Application 2020 & 2033
- Table 44: Rest of Middle East and Africa Pure Gas Industry Revenue (billion) Forecast, by Application 2020 & 2033
Frequently Asked Questions
1. What is the projected Compound Annual Growth Rate (CAGR) of the Pure Gas Industry?
The projected CAGR is approximately 4.4%.
2. Which companies are prominent players in the Pure Gas Industry?
Key companies in the market include Air Products and Chemicals Inc, Advanced Specialty Gases, Linde plc*List Not Exhaustive, OSAKA GAS LIQUID Co Ltd, Matheson Tri-Gas Inc, Iwatani Corporation, American Welding & Gas, Messer Group, Air Liquide, Airgas Inc.
3. What are the main segments of the Pure Gas Industry?
The market segments include Product Type, Application, End-user Industry.
4. Can you provide details about the market size?
The market size is estimated to be USD 119.11 billion as of 2022.
5. What are some drivers contributing to market growth?
; Increasing Demand from Electronics Industry; Rising Demand for Solar PV Production.
6. What are the notable trends driving market growth?
Noble Gas Product Type to Dominate the Market.
7. Are there any restraints impacting market growth?
; High Cost of Indium Tin Oxide; Other Restraints.
8. Can you provide examples of recent developments in the market?
N/A
9. What pricing options are available for accessing the report?
Pricing options include single-user, multi-user, and enterprise licenses priced at USD 4750, USD 5250, and USD 8750 respectively.
10. Is the market size provided in terms of value or volume?
The market size is provided in terms of value, measured in billion.
11. Are there any specific market keywords associated with the report?
Yes, the market keyword associated with the report is "Pure Gas Industry," which aids in identifying and referencing the specific market segment covered.
12. How do I determine which pricing option suits my needs best?
The pricing options vary based on user requirements and access needs. Individual users may opt for single-user licenses, while businesses requiring broader access may choose multi-user or enterprise licenses for cost-effective access to the report.
13. Are there any additional resources or data provided in the Pure Gas Industry report?
While the report offers comprehensive insights, it's advisable to review the specific contents or supplementary materials provided to ascertain if additional resources or data are available.
14. How can I stay updated on further developments or reports in the Pure Gas Industry?
To stay informed about further developments, trends, and reports in the Pure Gas Industry, consider subscribing to industry newsletters, following relevant companies and organizations, or regularly checking reputable industry news sources and publications.
Methodology
Step 1 - Identification of Relevant Samples Size from Population Database


Step 2 - Approaches for Defining Global Market Size (Value, Volume* & Price*)

Note*: In applicable scenarios
Step 3 - Data Sources
Primary Research
- Web Analytics
- Survey Reports
- Research Institute
- Latest Research Reports
- Opinion Leaders
Secondary Research
- Annual Reports
- White Paper
- Latest Press Release
- Industry Association
- Paid Database
- Investor Presentations

Step 4 - Data Triangulation
Involves using different sources of information in order to increase the validity of a study
These sources are likely to be stakeholders in a program - participants, other researchers, program staff, other community members, and so on.
Then we put all data in single framework & apply various statistical tools to find out the dynamic on the market.
During the analysis stage, feedback from the stakeholder groups would be compared to determine areas of agreement as well as areas of divergence