
Key Insights
The global proppants market is experiencing robust growth, driven primarily by the sustained expansion of hydraulic fracturing operations in the oil and gas industry. The period between 2019 and 2024 witnessed considerable market fluctuations due to oil price volatility and pandemic-related disruptions. However, the market is projected to demonstrate a steady Compound Annual Growth Rate (CAGR) throughout the forecast period (2025-2033). This positive outlook is fueled by increasing global energy demand, ongoing exploration and production activities, and advancements in proppant technology leading to improved well productivity and enhanced oil recovery. The adoption of higher-strength proppants, such as ceramics and resin-coated sand, is further contributing to market growth, as these materials offer superior performance in challenging reservoir conditions. Major market players are focusing on strategic partnerships, acquisitions, and technological advancements to strengthen their market position and meet the growing demand.
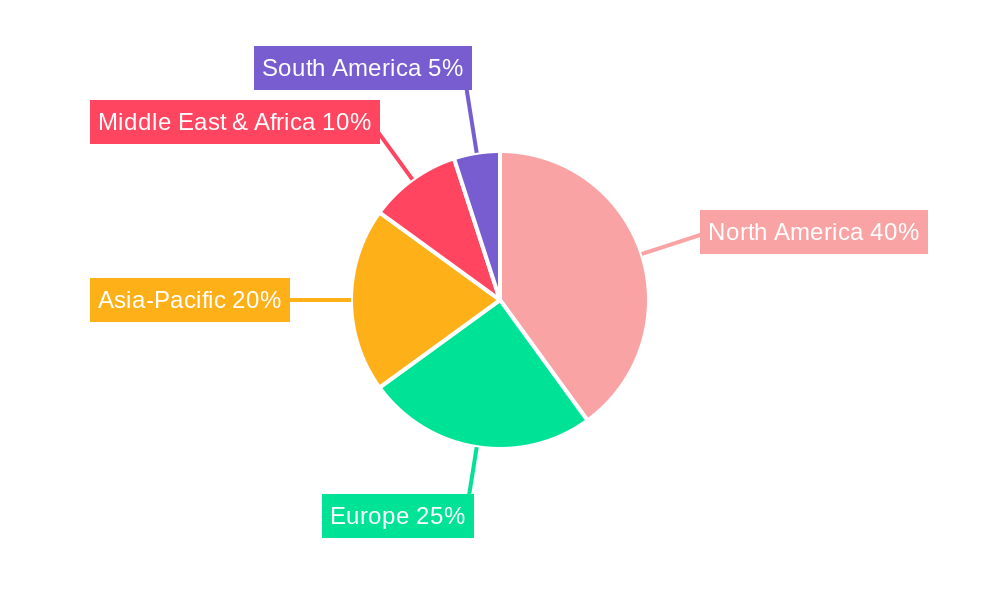
The market segmentation within the proppants industry is also a crucial factor influencing its growth trajectory. While sand proppants remain the dominant segment due to their cost-effectiveness, the demand for high-performance proppants like ceramics and resin-coated sand is escalating rapidly. This shift is driven by the need to optimize well stimulation in unconventional resource plays, requiring proppants with enhanced durability and conductivity. Furthermore, geographical variations in resource availability and regulatory frameworks influence regional market dynamics. North America currently holds a significant market share due to the prevalence of shale gas production, but regions like Asia-Pacific are projected to witness substantial growth in the coming years, fueled by rising energy consumption and increased investments in exploration and production activities. This growth will present lucrative opportunities for market participants willing to adapt to evolving technological demands and expanding global reach.
Proppants Industry Market Report: 2019-2033
This comprehensive report provides an in-depth analysis of the global proppants industry, offering invaluable insights for industry professionals, investors, and strategic decision-makers. With a study period spanning 2019-2033, a base year of 2025, and a forecast period of 2025-2033, this report leverages historical data (2019-2024) to project future market trends and opportunities within the $XX Billion proppants market.
Proppants Industry Market Structure & Competitive Dynamics
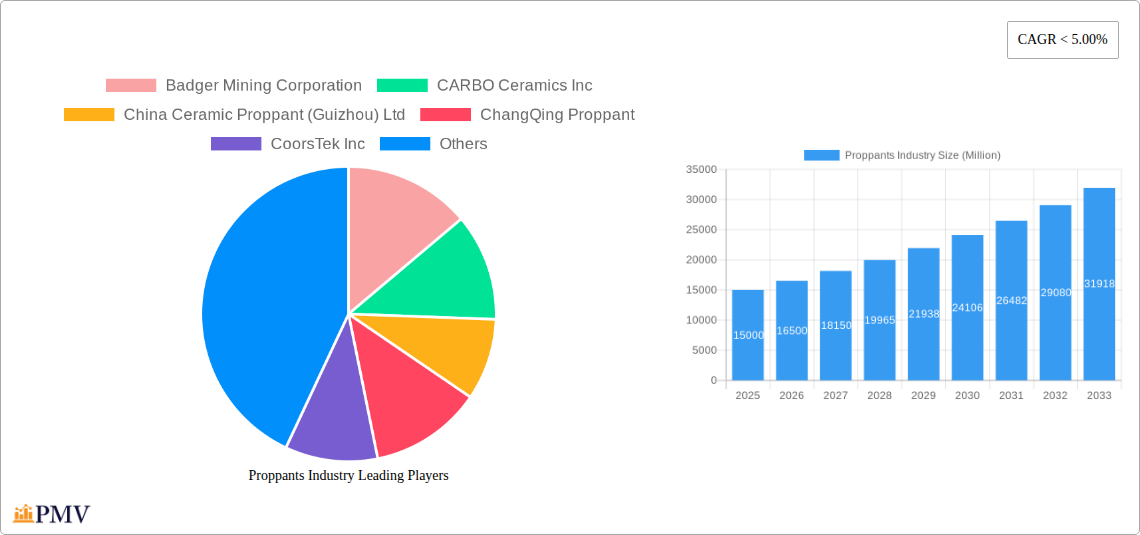
The proppants market is characterized by a moderately concentrated structure, with several key players holding significant market share. While exact figures fluctuate, companies like U.S. Silica, Hi-Crush Partners LP (now part of Covia Holdings), and others hold substantial positions, commanding a collective market share of approximately xx%. However, the presence of numerous smaller, regional players contributes to a competitive landscape.
Innovation ecosystems are crucial, with companies investing heavily in research and development to improve proppant efficiency and effectiveness. Regulatory frameworks, particularly concerning environmental impact and safety standards, significantly influence operations. The industry faces pressure from product substitutes, including alternative fracturing technologies, though these remain niche at present. End-user trends show a rising demand for higher-quality, high-strength proppants to optimize oil and gas extraction.
Mergers and acquisitions (M&A) play a significant role. For example, the May 2022 acquisition of Pinnacle Technologies Inc. by CARBO Ceramics Inc. exemplifies the strategic focus on enhancing service portfolios. While precise M&A deal values vary considerably, transactions often range from tens to hundreds of Millions of dollars, depending on the size and strategic importance of the target company.
Proppants Industry Trends & Insights
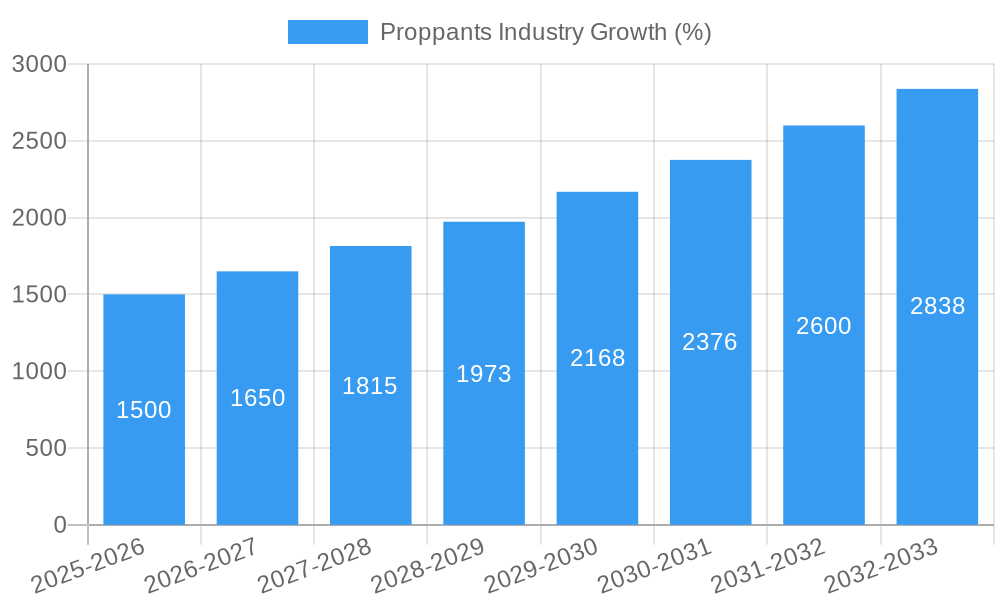
The global proppants market is projected to experience a Compound Annual Growth Rate (CAGR) of xx% during the forecast period (2025-2033). Several factors drive this growth. Increased oil and gas exploration and production activities globally, particularly in unconventional shale formations, are a primary driver. Technological advancements in hydraulic fracturing techniques continuously improve efficiency, boosting the demand for proppants. Consumer preference shifts towards higher-performance proppants with enhanced properties like strength, conductivity, and size consistency further fuel market expansion.
However, fluctuations in crude oil prices represent a significant challenge, influencing investment decisions in exploration and production. Furthermore, increased awareness of the environmental impact of hydraulic fracturing is leading to stricter regulations, impacting the industry's growth trajectory and necessitating the adoption of more sustainable practices. Competitive dynamics continue to evolve, with ongoing innovation, M&A activity, and the emergence of new technologies shaping the market landscape. Market penetration of specialized proppants, such as ceramic and resin-coated proppants, is increasing gradually, driven by their superior performance in challenging geological formations.
Dominant Markets & Segments in Proppants Industry
North America, particularly the United States, remains the dominant market for proppants due to substantial shale gas production and ongoing investment in oil and gas exploration.
Key Drivers for North American Dominance:
- Abundant shale gas reserves
- Established oil and gas infrastructure
- Supportive government policies (though subject to change)
- High levels of private investment in the energy sector
The dominance is further strengthened by the presence of major proppant producers like U.S. Silica and others within the region, and strong downstream integration into the oil and gas industry. While other regions, such as Asia-Pacific and parts of the Middle East, are demonstrating increasing growth in proppant demand, their current market share remains substantially smaller compared to North America.
Proppants Industry Product Innovations
Recent advancements in proppant technology focus on improving proppant strength, conductivity, and overall performance in harsh downhole environments. Innovations include resin-coated proppants offering enhanced durability and reduced fines generation, ceramic proppants providing superior strength and thermal resistance, and the development of precisely engineered proppant sizes to optimize fracture conductivity. These innovations address specific market needs, particularly in challenging formations and deep-water applications, giving producers a competitive edge by maximizing production efficiency and reducing operational costs.
Report Segmentation & Scope
This report segments the proppants market based on several key factors:
By Type: Silica Sand, Ceramic Proppants, Other (e.g., resin-coated proppants). Each segment exhibits distinct growth projections, reflecting varying demands based on specific applications.
By Application: Hydraulic Fracturing (dominant segment), other applications. Market size varies significantly across applications, with hydraulic fracturing dominating the demand.
By Region: North America, Europe, Asia-Pacific, Middle East & Africa, and South America. Regional variations in growth rates reflect differences in exploration and production activity, infrastructure, and government regulations.
Key Drivers of Proppants Industry Growth
Several factors drive growth in the proppants industry:
- The continuing expansion of unconventional oil and gas exploration, particularly shale gas production, significantly increases proppant demand.
- Technological advancements in hydraulic fracturing lead to increased efficiency, further driving demand.
- Government policies and incentives aimed at boosting domestic energy production influence industry growth.
Challenges in the Proppants Industry Sector
Significant challenges face the proppants industry:
- Fluctuations in crude oil prices directly impact exploration and production budgets, consequently influencing proppant demand.
- Stringent environmental regulations regarding waste management and hydraulic fracturing can impact operational costs and efficiency.
- Intense competition among proppant producers and related service providers creates pricing pressure.
Leading Players in the Proppants Industry Market
- Badger Mining Corporation
- CARBO Ceramics Inc
- China Ceramic Proppant (Guizhou) Ltd
- ChangQing Proppant
- CoorsTek Inc
- Covia Holdings LLC
- Eagle Materials Inc
- Emerge Energy Services (Superior Silica Sands)
- Epic Ceramic Proppants Inc
- Fores LTD
- General Electric (Baker Hughes Company)
- Gongyi Yuanyang Ceramsite Co Ltd
- Halliburton
- Henan Tianxiang New Materials Co Ltd
- Hexion
- Nika Petrotech
- Preferred Sands LLC
- Saint-Gobain
- Unimin Energy Solutions (Sibelco)
- U S Silica
- Wanli Proppant
Key Developments in Proppants Industry Sector
- May 2022: CARBO Ceramics Inc. acquired Pinnacle Technologies Inc., expanding its service offerings in fracture diagnostics, mapping, and simulation, enhancing its proppant market position.
Strategic Proppants Industry Market Outlook
The proppants market is poised for continued growth, driven by persistent demand from the oil and gas sector. Strategic opportunities lie in developing innovative, high-performance proppants, expanding into new geographical markets, and focusing on sustainable and environmentally friendly practices. Companies that effectively address the challenges of fluctuating oil prices, stringent regulations, and intensifying competition are best positioned to capitalize on the long-term growth potential of this vital industry.
Proppants Industry Segmentation
-
1. Product Type
- 1.1. Frac Sand
- 1.2. Resin Coated
- 1.3. Ceramics
Proppants Industry Segmentation By Geography
-
1. Asia Pacific
- 1.1. China
- 1.2. India
- 1.3. Indonesia
- 1.4. Malaysia
- 1.5. Thailand
- 1.6. Vietnam
- 1.7. Rest of Asia Pacific
-
2. North America
- 2.1. United States
- 2.2. Canada
- 2.3. Mexico
-
3. Europe
- 3.1. Germany
- 3.2. United Kingdom
- 3.3. Russia
- 3.4. Norway
- 3.5. Rest of Europe
-
4. South America
- 4.1. Brazil
- 4.2. Argentina
- 4.3. Rest of South America
-
5. Middle East and Africa
- 5.1. Saudi Arabia
- 5.2. South Africa
- 5.3. Rest of Middle East and Africa
Proppants Industry REPORT HIGHLIGHTS
| Aspects | Details |
|---|---|
| Study Period | 2019-2033 |
| Base Year | 2024 |
| Estimated Year | 2025 |
| Forecast Period | 2025-2033 |
| Historical Period | 2019-2024 |
| Growth Rate | CAGR of < 5.00% from 2019-2033 |
| Segmentation |
|
Table of Contents
- 1. Introduction
- 1.1. Research Scope
- 1.2. Market Segmentation
- 1.3. Research Methodology
- 1.4. Definitions and Assumptions
- 2. Executive Summary
- 2.1. Introduction
- 3. Market Dynamics
- 3.1. Introduction
- 3.2. Market Drivers
- 3.2.1. Improvements in Fracking Technology; Increasing Shale Gas Production Activities
- 3.3. Market Restrains
- 3.3.1. Improvements in Fracking Technology; Increasing Shale Gas Production Activities
- 3.4. Market Trends
- 3.4.1. Frac Sand Segment Expected to Dominate the Market
- 4. Market Factor Analysis
- 4.1. Porters Five Forces
- 4.2. Supply/Value Chain
- 4.3. PESTEL analysis
- 4.4. Market Entropy
- 4.5. Patent/Trademark Analysis
- 5. Global Proppants Industry Analysis, Insights and Forecast, 2019-2031
- 5.1. Market Analysis, Insights and Forecast - by Product Type
- 5.1.1. Frac Sand
- 5.1.2. Resin Coated
- 5.1.3. Ceramics
- 5.2. Market Analysis, Insights and Forecast - by Region
- 5.2.1. Asia Pacific
- 5.2.2. North America
- 5.2.3. Europe
- 5.2.4. South America
- 5.2.5. Middle East and Africa
- 5.1. Market Analysis, Insights and Forecast - by Product Type
- 6. Asia Pacific Proppants Industry Analysis, Insights and Forecast, 2019-2031
- 6.1. Market Analysis, Insights and Forecast - by Product Type
- 6.1.1. Frac Sand
- 6.1.2. Resin Coated
- 6.1.3. Ceramics
- 6.1. Market Analysis, Insights and Forecast - by Product Type
- 7. North America Proppants Industry Analysis, Insights and Forecast, 2019-2031
- 7.1. Market Analysis, Insights and Forecast - by Product Type
- 7.1.1. Frac Sand
- 7.1.2. Resin Coated
- 7.1.3. Ceramics
- 7.1. Market Analysis, Insights and Forecast - by Product Type
- 8. Europe Proppants Industry Analysis, Insights and Forecast, 2019-2031
- 8.1. Market Analysis, Insights and Forecast - by Product Type
- 8.1.1. Frac Sand
- 8.1.2. Resin Coated
- 8.1.3. Ceramics
- 8.1. Market Analysis, Insights and Forecast - by Product Type
- 9. South America Proppants Industry Analysis, Insights and Forecast, 2019-2031
- 9.1. Market Analysis, Insights and Forecast - by Product Type
- 9.1.1. Frac Sand
- 9.1.2. Resin Coated
- 9.1.3. Ceramics
- 9.1. Market Analysis, Insights and Forecast - by Product Type
- 10. Middle East and Africa Proppants Industry Analysis, Insights and Forecast, 2019-2031
- 10.1. Market Analysis, Insights and Forecast - by Product Type
- 10.1.1. Frac Sand
- 10.1.2. Resin Coated
- 10.1.3. Ceramics
- 10.1. Market Analysis, Insights and Forecast - by Product Type
- 11. Competitive Analysis
- 11.1. Global Market Share Analysis 2024
- 11.2. Company Profiles
- 11.2.1 Badger Mining Corporation
- 11.2.1.1. Overview
- 11.2.1.2. Products
- 11.2.1.3. SWOT Analysis
- 11.2.1.4. Recent Developments
- 11.2.1.5. Financials (Based on Availability)
- 11.2.2 CARBO Ceramics Inc
- 11.2.2.1. Overview
- 11.2.2.2. Products
- 11.2.2.3. SWOT Analysis
- 11.2.2.4. Recent Developments
- 11.2.2.5. Financials (Based on Availability)
- 11.2.3 China Ceramic Proppant (Guizhou) Ltd
- 11.2.3.1. Overview
- 11.2.3.2. Products
- 11.2.3.3. SWOT Analysis
- 11.2.3.4. Recent Developments
- 11.2.3.5. Financials (Based on Availability)
- 11.2.4 ChangQing Proppant
- 11.2.4.1. Overview
- 11.2.4.2. Products
- 11.2.4.3. SWOT Analysis
- 11.2.4.4. Recent Developments
- 11.2.4.5. Financials (Based on Availability)
- 11.2.5 CoorsTek Inc
- 11.2.5.1. Overview
- 11.2.5.2. Products
- 11.2.5.3. SWOT Analysis
- 11.2.5.4. Recent Developments
- 11.2.5.5. Financials (Based on Availability)
- 11.2.6 Covia Holdings LLC
- 11.2.6.1. Overview
- 11.2.6.2. Products
- 11.2.6.3. SWOT Analysis
- 11.2.6.4. Recent Developments
- 11.2.6.5. Financials (Based on Availability)
- 11.2.7 Eagle Materials Inc
- 11.2.7.1. Overview
- 11.2.7.2. Products
- 11.2.7.3. SWOT Analysis
- 11.2.7.4. Recent Developments
- 11.2.7.5. Financials (Based on Availability)
- 11.2.8 Emerge Energy Services (Superior Silica Sands)
- 11.2.8.1. Overview
- 11.2.8.2. Products
- 11.2.8.3. SWOT Analysis
- 11.2.8.4. Recent Developments
- 11.2.8.5. Financials (Based on Availability)
- 11.2.9 Epic Ceramic Proppants Inc
- 11.2.9.1. Overview
- 11.2.9.2. Products
- 11.2.9.3. SWOT Analysis
- 11.2.9.4. Recent Developments
- 11.2.9.5. Financials (Based on Availability)
- 11.2.10 Fores LTD
- 11.2.10.1. Overview
- 11.2.10.2. Products
- 11.2.10.3. SWOT Analysis
- 11.2.10.4. Recent Developments
- 11.2.10.5. Financials (Based on Availability)
- 11.2.11 General Electric (Baker Hughes Company)
- 11.2.11.1. Overview
- 11.2.11.2. Products
- 11.2.11.3. SWOT Analysis
- 11.2.11.4. Recent Developments
- 11.2.11.5. Financials (Based on Availability)
- 11.2.12 Gongyi Yuanyang Ceramsite Co Ltd
- 11.2.12.1. Overview
- 11.2.12.2. Products
- 11.2.12.3. SWOT Analysis
- 11.2.12.4. Recent Developments
- 11.2.12.5. Financials (Based on Availability)
- 11.2.13 Halliburton
- 11.2.13.1. Overview
- 11.2.13.2. Products
- 11.2.13.3. SWOT Analysis
- 11.2.13.4. Recent Developments
- 11.2.13.5. Financials (Based on Availability)
- 11.2.14 Henan Tianxiang New Materials Co Ltd
- 11.2.14.1. Overview
- 11.2.14.2. Products
- 11.2.14.3. SWOT Analysis
- 11.2.14.4. Recent Developments
- 11.2.14.5. Financials (Based on Availability)
- 11.2.15 Hexion
- 11.2.15.1. Overview
- 11.2.15.2. Products
- 11.2.15.3. SWOT Analysis
- 11.2.15.4. Recent Developments
- 11.2.15.5. Financials (Based on Availability)
- 11.2.16 Nika Petrotech
- 11.2.16.1. Overview
- 11.2.16.2. Products
- 11.2.16.3. SWOT Analysis
- 11.2.16.4. Recent Developments
- 11.2.16.5. Financials (Based on Availability)
- 11.2.17 Preferred Sands LLC
- 11.2.17.1. Overview
- 11.2.17.2. Products
- 11.2.17.3. SWOT Analysis
- 11.2.17.4. Recent Developments
- 11.2.17.5. Financials (Based on Availability)
- 11.2.18 Saint-Gobain
- 11.2.18.1. Overview
- 11.2.18.2. Products
- 11.2.18.3. SWOT Analysis
- 11.2.18.4. Recent Developments
- 11.2.18.5. Financials (Based on Availability)
- 11.2.19 Unimin Energy Solutions (Sibelco)
- 11.2.19.1. Overview
- 11.2.19.2. Products
- 11.2.19.3. SWOT Analysis
- 11.2.19.4. Recent Developments
- 11.2.19.5. Financials (Based on Availability)
- 11.2.20 U S Silica
- 11.2.20.1. Overview
- 11.2.20.2. Products
- 11.2.20.3. SWOT Analysis
- 11.2.20.4. Recent Developments
- 11.2.20.5. Financials (Based on Availability)
- 11.2.21 Wanli Proppant*List Not Exhaustive
- 11.2.21.1. Overview
- 11.2.21.2. Products
- 11.2.21.3. SWOT Analysis
- 11.2.21.4. Recent Developments
- 11.2.21.5. Financials (Based on Availability)
- 11.2.1 Badger Mining Corporation
List of Figures
- Figure 1: Global Proppants Industry Revenue Breakdown (Million, %) by Region 2024 & 2032
- Figure 2: Asia Pacific Proppants Industry Revenue (Million), by Product Type 2024 & 2032
- Figure 3: Asia Pacific Proppants Industry Revenue Share (%), by Product Type 2024 & 2032
- Figure 4: Asia Pacific Proppants Industry Revenue (Million), by Country 2024 & 2032
- Figure 5: Asia Pacific Proppants Industry Revenue Share (%), by Country 2024 & 2032
- Figure 6: North America Proppants Industry Revenue (Million), by Product Type 2024 & 2032
- Figure 7: North America Proppants Industry Revenue Share (%), by Product Type 2024 & 2032
- Figure 8: North America Proppants Industry Revenue (Million), by Country 2024 & 2032
- Figure 9: North America Proppants Industry Revenue Share (%), by Country 2024 & 2032
- Figure 10: Europe Proppants Industry Revenue (Million), by Product Type 2024 & 2032
- Figure 11: Europe Proppants Industry Revenue Share (%), by Product Type 2024 & 2032
- Figure 12: Europe Proppants Industry Revenue (Million), by Country 2024 & 2032
- Figure 13: Europe Proppants Industry Revenue Share (%), by Country 2024 & 2032
- Figure 14: South America Proppants Industry Revenue (Million), by Product Type 2024 & 2032
- Figure 15: South America Proppants Industry Revenue Share (%), by Product Type 2024 & 2032
- Figure 16: South America Proppants Industry Revenue (Million), by Country 2024 & 2032
- Figure 17: South America Proppants Industry Revenue Share (%), by Country 2024 & 2032
- Figure 18: Middle East and Africa Proppants Industry Revenue (Million), by Product Type 2024 & 2032
- Figure 19: Middle East and Africa Proppants Industry Revenue Share (%), by Product Type 2024 & 2032
- Figure 20: Middle East and Africa Proppants Industry Revenue (Million), by Country 2024 & 2032
- Figure 21: Middle East and Africa Proppants Industry Revenue Share (%), by Country 2024 & 2032
List of Tables
- Table 1: Global Proppants Industry Revenue Million Forecast, by Region 2019 & 2032
- Table 2: Global Proppants Industry Revenue Million Forecast, by Product Type 2019 & 2032
- Table 3: Global Proppants Industry Revenue Million Forecast, by Region 2019 & 2032
- Table 4: Global Proppants Industry Revenue Million Forecast, by Product Type 2019 & 2032
- Table 5: Global Proppants Industry Revenue Million Forecast, by Country 2019 & 2032
- Table 6: China Proppants Industry Revenue (Million) Forecast, by Application 2019 & 2032
- Table 7: India Proppants Industry Revenue (Million) Forecast, by Application 2019 & 2032
- Table 8: Indonesia Proppants Industry Revenue (Million) Forecast, by Application 2019 & 2032
- Table 9: Malaysia Proppants Industry Revenue (Million) Forecast, by Application 2019 & 2032
- Table 10: Thailand Proppants Industry Revenue (Million) Forecast, by Application 2019 & 2032
- Table 11: Vietnam Proppants Industry Revenue (Million) Forecast, by Application 2019 & 2032
- Table 12: Rest of Asia Pacific Proppants Industry Revenue (Million) Forecast, by Application 2019 & 2032
- Table 13: Global Proppants Industry Revenue Million Forecast, by Product Type 2019 & 2032
- Table 14: Global Proppants Industry Revenue Million Forecast, by Country 2019 & 2032
- Table 15: United States Proppants Industry Revenue (Million) Forecast, by Application 2019 & 2032
- Table 16: Canada Proppants Industry Revenue (Million) Forecast, by Application 2019 & 2032
- Table 17: Mexico Proppants Industry Revenue (Million) Forecast, by Application 2019 & 2032
- Table 18: Global Proppants Industry Revenue Million Forecast, by Product Type 2019 & 2032
- Table 19: Global Proppants Industry Revenue Million Forecast, by Country 2019 & 2032
- Table 20: Germany Proppants Industry Revenue (Million) Forecast, by Application 2019 & 2032
- Table 21: United Kingdom Proppants Industry Revenue (Million) Forecast, by Application 2019 & 2032
- Table 22: Russia Proppants Industry Revenue (Million) Forecast, by Application 2019 & 2032
- Table 23: Norway Proppants Industry Revenue (Million) Forecast, by Application 2019 & 2032
- Table 24: Rest of Europe Proppants Industry Revenue (Million) Forecast, by Application 2019 & 2032
- Table 25: Global Proppants Industry Revenue Million Forecast, by Product Type 2019 & 2032
- Table 26: Global Proppants Industry Revenue Million Forecast, by Country 2019 & 2032
- Table 27: Brazil Proppants Industry Revenue (Million) Forecast, by Application 2019 & 2032
- Table 28: Argentina Proppants Industry Revenue (Million) Forecast, by Application 2019 & 2032
- Table 29: Rest of South America Proppants Industry Revenue (Million) Forecast, by Application 2019 & 2032
- Table 30: Global Proppants Industry Revenue Million Forecast, by Product Type 2019 & 2032
- Table 31: Global Proppants Industry Revenue Million Forecast, by Country 2019 & 2032
- Table 32: Saudi Arabia Proppants Industry Revenue (Million) Forecast, by Application 2019 & 2032
- Table 33: South Africa Proppants Industry Revenue (Million) Forecast, by Application 2019 & 2032
- Table 34: Rest of Middle East and Africa Proppants Industry Revenue (Million) Forecast, by Application 2019 & 2032
Frequently Asked Questions
1. What is the projected Compound Annual Growth Rate (CAGR) of the Proppants Industry?
The projected CAGR is approximately < 5.00%.
2. Which companies are prominent players in the Proppants Industry?
Key companies in the market include Badger Mining Corporation, CARBO Ceramics Inc, China Ceramic Proppant (Guizhou) Ltd, ChangQing Proppant, CoorsTek Inc, Covia Holdings LLC, Eagle Materials Inc, Emerge Energy Services (Superior Silica Sands), Epic Ceramic Proppants Inc, Fores LTD, General Electric (Baker Hughes Company), Gongyi Yuanyang Ceramsite Co Ltd, Halliburton, Henan Tianxiang New Materials Co Ltd, Hexion, Nika Petrotech, Preferred Sands LLC, Saint-Gobain, Unimin Energy Solutions (Sibelco), U S Silica, Wanli Proppant*List Not Exhaustive.
3. What are the main segments of the Proppants Industry?
The market segments include Product Type.
4. Can you provide details about the market size?
The market size is estimated to be USD XX Million as of 2022.
5. What are some drivers contributing to market growth?
Improvements in Fracking Technology; Increasing Shale Gas Production Activities.
6. What are the notable trends driving market growth?
Frac Sand Segment Expected to Dominate the Market.
7. Are there any restraints impacting market growth?
Improvements in Fracking Technology; Increasing Shale Gas Production Activities.
8. Can you provide examples of recent developments in the market?
May 2022: CARBO Ceramics Inc. announced the acquisition of Pinnacle Technologies Inc., which provides fracture diagnostic services, fracture mapping services, and fracture simulation models. It will enhance the company's product portfolio for the proppants market.
9. What pricing options are available for accessing the report?
Pricing options include single-user, multi-user, and enterprise licenses priced at USD 4750, USD 5250, and USD 8750 respectively.
10. Is the market size provided in terms of value or volume?
The market size is provided in terms of value, measured in Million.
11. Are there any specific market keywords associated with the report?
Yes, the market keyword associated with the report is "Proppants Industry," which aids in identifying and referencing the specific market segment covered.
12. How do I determine which pricing option suits my needs best?
The pricing options vary based on user requirements and access needs. Individual users may opt for single-user licenses, while businesses requiring broader access may choose multi-user or enterprise licenses for cost-effective access to the report.
13. Are there any additional resources or data provided in the Proppants Industry report?
While the report offers comprehensive insights, it's advisable to review the specific contents or supplementary materials provided to ascertain if additional resources or data are available.
14. How can I stay updated on further developments or reports in the Proppants Industry?
To stay informed about further developments, trends, and reports in the Proppants Industry, consider subscribing to industry newsletters, following relevant companies and organizations, or regularly checking reputable industry news sources and publications.
Methodology
Step 1 - Identification of Relevant Samples Size from Population Database


Step 2 - Approaches for Defining Global Market Size (Value, Volume* & Price*)

Note*: In applicable scenarios
Step 3 - Data Sources
Primary Research
- Web Analytics
- Survey Reports
- Research Institute
- Latest Research Reports
- Opinion Leaders
Secondary Research
- Annual Reports
- White Paper
- Latest Press Release
- Industry Association
- Paid Database
- Investor Presentations

Step 4 - Data Triangulation
Involves using different sources of information in order to increase the validity of a study
These sources are likely to be stakeholders in a program - participants, other researchers, program staff, other community members, and so on.
Then we put all data in single framework & apply various statistical tools to find out the dynamic on the market.
During the analysis stage, feedback from the stakeholder groups would be compared to determine areas of agreement as well as areas of divergence


