
Key Insights
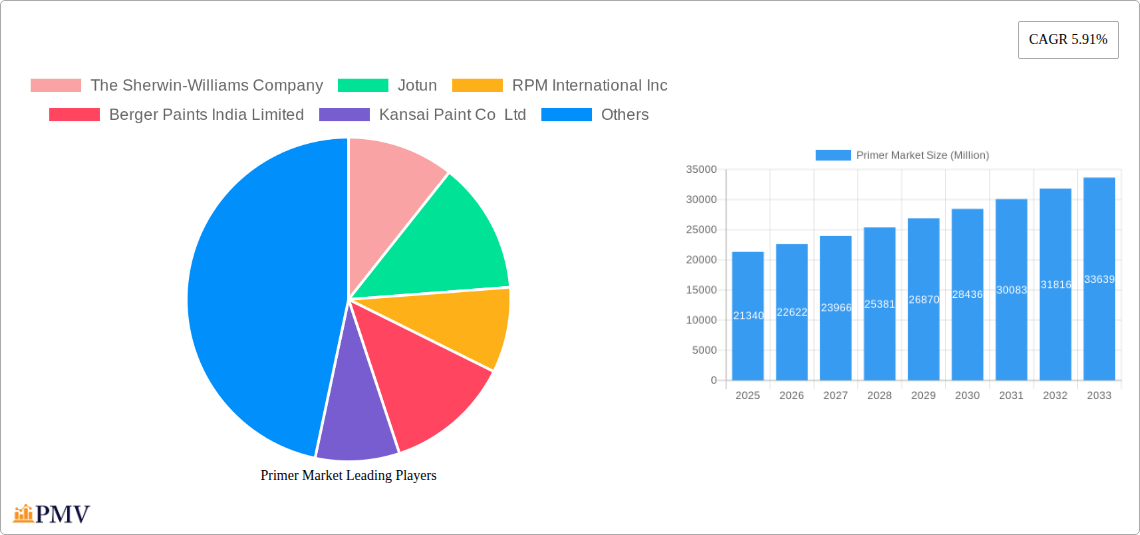
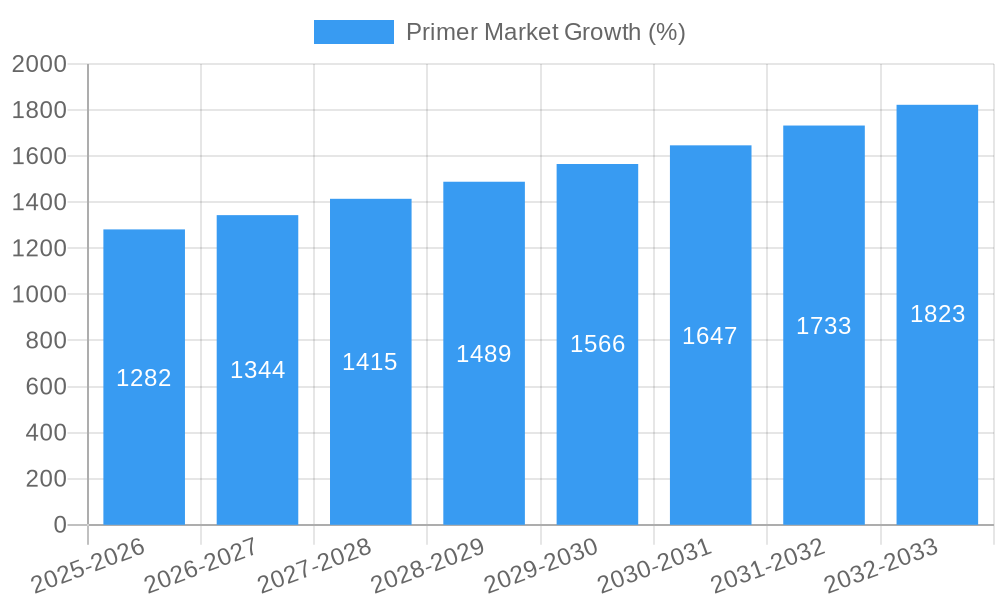
The global primer market, valued at $21.34 billion in 2025, is projected to experience robust growth, driven by a Compound Annual Growth Rate (CAGR) of 5.91% from 2025 to 2033. This expansion is fueled by several key factors. The burgeoning automotive industry, with its increasing demand for high-quality coatings, is a major contributor. Similarly, the construction sector's ongoing growth, particularly in developing economies, significantly boosts primer demand for both interior and exterior applications. The rising popularity of eco-friendly, water-based primers aligns with global sustainability initiatives, further driving market expansion. Technological advancements in primer formulations, leading to enhanced durability, corrosion resistance, and improved adhesion, are also key growth drivers. Segmentation analysis reveals that resin-based primers dominate the ingredient category, while the automotive and building & construction industries are the largest end-users. Competitive intensity is high, with major players like Sherwin-Williams, Jotun, and PPG Industries vying for market share through product innovation and strategic partnerships.
However, certain restraints could temper growth. Fluctuations in raw material prices, particularly for resins and solvents, pose a challenge to manufacturers. Stringent environmental regulations concerning volatile organic compounds (VOCs) in primers necessitate the adoption of more sustainable formulations, potentially increasing production costs. Economic downturns can also impact demand, particularly in sectors heavily reliant on construction and manufacturing. Nevertheless, the long-term outlook for the primer market remains positive, driven by continuous infrastructural development globally and the ongoing need for protective and aesthetically pleasing coatings across diverse industries. The market is expected to witness further consolidation, with larger players likely acquiring smaller companies to gain access to new technologies and expand their geographical reach. Innovation in areas such as self-healing primers and primers with antimicrobial properties will shape future market dynamics.
Primer Market: A Comprehensive Analysis & Forecast (2019-2033)
This detailed report provides a comprehensive analysis of the global Primer Market, offering invaluable insights for stakeholders across the value chain. The study covers the period from 2019 to 2033, with a focus on the forecast period from 2025 to 2033, utilizing 2025 as the base year. The report analyzes market dynamics, competitive landscapes, and future growth opportunities, providing actionable intelligence for strategic decision-making. The market size is estimated at xx Million in 2025 and is projected to reach xx Million by 2033, exhibiting a CAGR of xx% during the forecast period.
Primer Market Market Structure & Competitive Dynamics
The Primer Market is characterized by a moderately concentrated structure, with a few major players holding significant market share. Key players such as The Sherwin-Williams Company, Jotun, PPG Industries Inc., and BASF SE compete intensely, driving innovation and influencing pricing strategies. Market share analysis reveals that The Sherwin-Williams Company holds an estimated xx% market share in 2025, followed by Jotun with xx% and PPG Industries Inc. with xx%. The remaining market share is distributed among numerous regional and niche players.
Innovation ecosystems are dynamic, with ongoing research and development focused on enhancing primer performance, sustainability, and application methods. Regulatory frameworks, particularly concerning VOC emissions and hazardous substances, significantly impact product formulations and manufacturing processes. Product substitutes, such as alternative surface treatments, exert competitive pressure, necessitating continuous innovation. End-user trends, particularly in the automotive and building & construction sectors, drive demand for specialized primers with enhanced properties. Significant M&A activity has been observed, with deal values exceeding xx Million in the past five years, indicating consolidation within the industry. For instance, [hypothetical example] a merger between Company X and Company Y in 2024 valued at xx Million reshaped the competitive landscape of the North American market.
- Market Concentration: Moderately concentrated, dominated by a few major players.
- Innovation Ecosystems: Active R&D focusing on performance, sustainability, and application.
- Regulatory Frameworks: Strict regulations on VOCs and hazardous substances.
- Product Substitutes: Presence of alternative surface treatments creates competitive pressure.
- End-user Trends: Shifting demand driven by automotive and building & construction sectors.
- M&A Activity: Significant M&A activity with deal values exceeding xx Million.
Primer Market Industry Trends & Insights
The Primer Market is experiencing robust growth, driven by several key factors. The global construction boom, particularly in developing economies, fuels substantial demand for primers in building and construction projects. The automotive industry's continuous innovation and increased production also contribute significantly to market growth. Technological advancements, such as water-based and high-performance primers, are gaining traction due to their environmental benefits and enhanced durability. Consumer preferences are shifting towards eco-friendly and sustainable products, driving the adoption of low-VOC and bio-based primers. However, fluctuating raw material prices and economic downturns can temporarily impede market growth.
The market exhibits strong growth potential, with a projected CAGR of xx% during the forecast period. Market penetration rates are high in developed regions but still offer significant growth opportunities in emerging markets. Competitive dynamics are intensifying, with companies focusing on product differentiation, innovation, and strategic partnerships to gain market share.
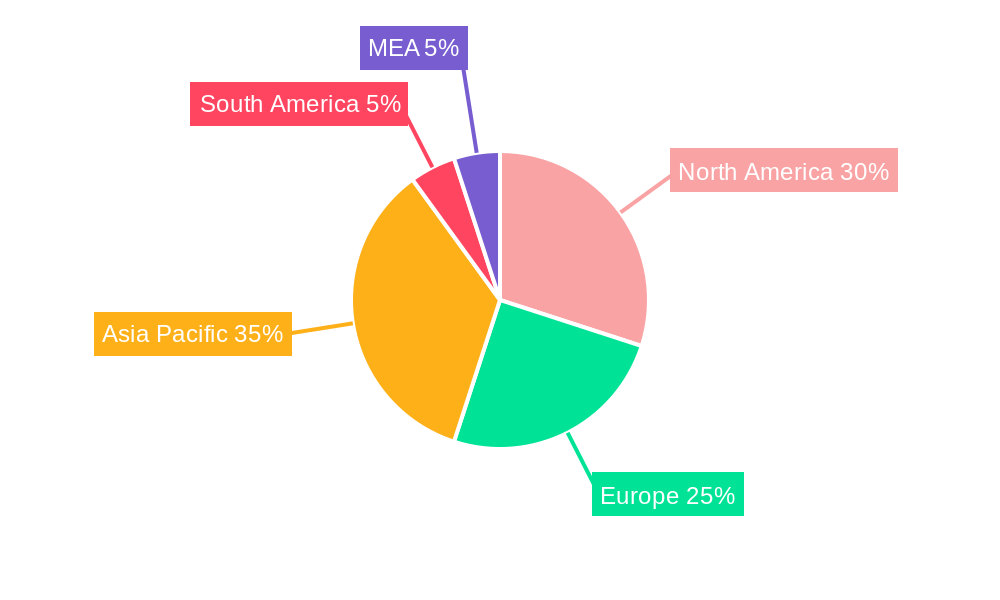
Dominant Markets & Segments in Primer Market
By Ingredient: The Resin segment holds the largest market share driven by its versatile properties and compatibility with various substrates. Other resins (maleic, polyester, polyamide, etc.) are gaining traction due to their specific application advantages. Additives such as rust inhibitors and emulsifiers are crucial for primer performance and enhance market growth. Other ingredients like pigments and solvents play a supporting role.
By End-user Industry: The Building and Construction sector accounts for the largest market share due to the vast scale of construction projects globally. The Automotive sector is also a significant end-user, with demand driven by rising vehicle production and the need for high-performance primers for corrosion protection. Other segments, such as Furniture, Industrial, and Packaging, exhibit steady growth, contributing to the overall market expansion.
Key Drivers (Bullet Points):
- Economic growth: Rising disposable incomes and increased construction activity drive demand.
- Infrastructure development: Large-scale infrastructure projects fuel primer consumption.
- Automotive industry growth: Increased vehicle production and stringent automotive regulations.
- Technological advancements: Development of high-performance and eco-friendly primers.
Primer Market Product Innovations
Recent years have witnessed significant innovations in primer technology, including the development of water-based primers that reduce VOC emissions and enhance sustainability. High-performance primers offering superior corrosion resistance and durability are gaining popularity. Manufacturers are focusing on developing primers with improved adhesion, faster drying times, and enhanced ease of application. These innovations aim to meet the evolving needs of diverse end-user industries and contribute to the overall market expansion.
Report Segmentation & Scope
This report segments the Primer Market by ingredient (Resin, Other Resins, Additives, Other Additives, Other Ingredients) and by end-user industry (Automotive, Building & Construction, Furniture, Industrial, Packaging, Other End-user Industries). Each segment is analyzed comprehensively, including growth projections, market size estimations, and competitive dynamics. The report provides a detailed analysis of each segment's growth drivers, restraints, and future outlook, offering a granular view of the Primer Market's structure and dynamics.
Key Drivers of Primer Market Growth
The Primer Market's growth is propelled by several factors: the booming construction industry, particularly in developing economies, the expanding automotive sector, and increasing demand for corrosion-resistant coatings. Technological advancements, such as the development of eco-friendly and high-performance primers, further stimulate market growth. Favorable government regulations promoting sustainable building materials also contribute to market expansion.
Challenges in the Primer Market Sector
The Primer Market faces challenges, including volatile raw material prices, stringent environmental regulations, and intense competition among established and emerging players. Supply chain disruptions, particularly during global crises, can impact production and availability. The need to continuously innovate to meet evolving end-user needs and stay ahead of competitive pressures also presents a significant hurdle. These factors can limit market growth if not effectively managed.
Leading Players in the Primer Market Market
- The Sherwin-Williams Company (Sherwin-Williams)
- Jotun (Jotun)
- RPM International Inc. (RPM International)
- Berger Paints India Limited (Berger Paints)
- Kansai Paint Co Ltd (Kansai Paint)
- PPG Industries Inc. (PPG Industries)
- Masco Corporation (Masco Corporation)
- Tikkurila (Tikkurila)
- BASF SE (BASF)
- Hempel A/S (Hempel)
- NIPSEA Group
- AkzoNobel NV (AkzoNobel)
- Axalta Coating Systems LLC (Axalta)
- Asian Paints (Asian Paints)
Key Developments in Primer Market Sector
- July 2022: BASF SE expanded its automotive refinish coatings production capacity in Jiangmen, China, boosting its supply and market share.
- March 2023: PPG Industries Inc. launched the PPG ENVIROCRON Primeron primer powder portfolio, enhancing its product offerings and competitiveness in the corrosion-resistant primer segment.
Strategic Primer Market Market Outlook
The Primer Market is poised for continued growth, driven by the ongoing expansion of the construction and automotive industries. Technological advancements in primer formulations and application methods will further fuel market expansion. Companies focusing on sustainability, innovation, and strategic partnerships are well-positioned to capitalize on future growth opportunities. The market presents attractive prospects for both established players and new entrants with differentiated offerings and a commitment to sustainable practices.
Primer Market Segmentation
-
1. Ingredient
-
1.1. Resin
- 1.1.1. Acrylic
- 1.1.2. Epoxy
- 1.1.3. Poly Vinyl Acetate
- 1.1.4. Alkyd
- 1.1.5. Other Resins (Maleic, Polyester, Polyamide, etc.)
-
1.2. By Additives
- 1.2.1. Dispersant
- 1.2.2. Biocides
- 1.2.3. Surface Modifier
- 1.2.4. Other Ad
- 1.3. Other Ingredients (Solvent, Pigments, etc.)
-
1.1. Resin
-
2. End-user Industry
- 2.1. Automotive
- 2.2. Building and Construction
- 2.3. Furniture
- 2.4. Industrial
- 2.5. Packaging
- 2.6. Other En
Primer Market Segmentation By Geography
-
1. Asia Pacific
- 1.1. China
- 1.2. India
- 1.3. Japan
- 1.4. South Korea
- 1.5. Malaysia
- 1.6. Thailand
- 1.7. Indonesia
- 1.8. Vietnam
- 1.9. Rest of Asia Pacific
-
2. North America
- 2.1. United States
- 2.2. Canada
- 2.3. Mexico
-
3. Europe
- 3.1. Germany
- 3.2. United Kingdom
- 3.3. Italy
- 3.4. France
- 3.5. Spain
- 3.6. NORDIC
- 3.7. Turkey
- 3.8. Russia
- 3.9. Rest of Europe
-
4. South America
- 4.1. Brazil
- 4.2. Argentina
- 4.3. Colombia
- 4.4. Rest of South America
-
5. Middle East and Africa
- 5.1. Saudi Arabia
- 5.2. South Africa
- 5.3. Nigeria
- 5.4. Qatar
- 5.5. Egypt
- 5.6. United Arab Emirates
- 5.7. Rest of Middle East and Africa
Primer Market REPORT HIGHLIGHTS
| Aspects | Details |
|---|---|
| Study Period | 2019-2033 |
| Base Year | 2024 |
| Estimated Year | 2025 |
| Forecast Period | 2025-2033 |
| Historical Period | 2019-2024 |
| Growth Rate | CAGR of 5.91% from 2019-2033 |
| Segmentation |
|
Table of Contents
- 1. Introduction
- 1.1. Research Scope
- 1.2. Market Segmentation
- 1.3. Research Methodology
- 1.4. Definitions and Assumptions
- 2. Executive Summary
- 2.1. Introduction
- 3. Market Dynamics
- 3.1. Introduction
- 3.2. Market Drivers
- 3.2.1. Increasing Construction Activities in the Asia-Pacific Region; Growing Automotive Industry; Other Drivers
- 3.3. Market Restrains
- 3.3.1. Stringent Environmental Regulations Regarding the Use of Primers; Other Restraints
- 3.4. Market Trends
- 3.4.1. Building and Construction Segment to Dominate the Market
- 4. Market Factor Analysis
- 4.1. Porters Five Forces
- 4.2. Supply/Value Chain
- 4.3. PESTEL analysis
- 4.4. Market Entropy
- 4.5. Patent/Trademark Analysis
- 5. Global Primer Market Analysis, Insights and Forecast, 2019-2031
- 5.1. Market Analysis, Insights and Forecast - by Ingredient
- 5.1.1. Resin
- 5.1.1.1. Acrylic
- 5.1.1.2. Epoxy
- 5.1.1.3. Poly Vinyl Acetate
- 5.1.1.4. Alkyd
- 5.1.1.5. Other Resins (Maleic, Polyester, Polyamide, etc.)
- 5.1.2. By Additives
- 5.1.2.1. Dispersant
- 5.1.2.2. Biocides
- 5.1.2.3. Surface Modifier
- 5.1.2.4. Other Ad
- 5.1.3. Other Ingredients (Solvent, Pigments, etc.)
- 5.1.1. Resin
- 5.2. Market Analysis, Insights and Forecast - by End-user Industry
- 5.2.1. Automotive
- 5.2.2. Building and Construction
- 5.2.3. Furniture
- 5.2.4. Industrial
- 5.2.5. Packaging
- 5.2.6. Other En
- 5.3. Market Analysis, Insights and Forecast - by Region
- 5.3.1. Asia Pacific
- 5.3.2. North America
- 5.3.3. Europe
- 5.3.4. South America
- 5.3.5. Middle East and Africa
- 5.1. Market Analysis, Insights and Forecast - by Ingredient
- 6. Asia Pacific Primer Market Analysis, Insights and Forecast, 2019-2031
- 6.1. Market Analysis, Insights and Forecast - by Ingredient
- 6.1.1. Resin
- 6.1.1.1. Acrylic
- 6.1.1.2. Epoxy
- 6.1.1.3. Poly Vinyl Acetate
- 6.1.1.4. Alkyd
- 6.1.1.5. Other Resins (Maleic, Polyester, Polyamide, etc.)
- 6.1.2. By Additives
- 6.1.2.1. Dispersant
- 6.1.2.2. Biocides
- 6.1.2.3. Surface Modifier
- 6.1.2.4. Other Ad
- 6.1.3. Other Ingredients (Solvent, Pigments, etc.)
- 6.1.1. Resin
- 6.2. Market Analysis, Insights and Forecast - by End-user Industry
- 6.2.1. Automotive
- 6.2.2. Building and Construction
- 6.2.3. Furniture
- 6.2.4. Industrial
- 6.2.5. Packaging
- 6.2.6. Other En
- 6.1. Market Analysis, Insights and Forecast - by Ingredient
- 7. North America Primer Market Analysis, Insights and Forecast, 2019-2031
- 7.1. Market Analysis, Insights and Forecast - by Ingredient
- 7.1.1. Resin
- 7.1.1.1. Acrylic
- 7.1.1.2. Epoxy
- 7.1.1.3. Poly Vinyl Acetate
- 7.1.1.4. Alkyd
- 7.1.1.5. Other Resins (Maleic, Polyester, Polyamide, etc.)
- 7.1.2. By Additives
- 7.1.2.1. Dispersant
- 7.1.2.2. Biocides
- 7.1.2.3. Surface Modifier
- 7.1.2.4. Other Ad
- 7.1.3. Other Ingredients (Solvent, Pigments, etc.)
- 7.1.1. Resin
- 7.2. Market Analysis, Insights and Forecast - by End-user Industry
- 7.2.1. Automotive
- 7.2.2. Building and Construction
- 7.2.3. Furniture
- 7.2.4. Industrial
- 7.2.5. Packaging
- 7.2.6. Other En
- 7.1. Market Analysis, Insights and Forecast - by Ingredient
- 8. Europe Primer Market Analysis, Insights and Forecast, 2019-2031
- 8.1. Market Analysis, Insights and Forecast - by Ingredient
- 8.1.1. Resin
- 8.1.1.1. Acrylic
- 8.1.1.2. Epoxy
- 8.1.1.3. Poly Vinyl Acetate
- 8.1.1.4. Alkyd
- 8.1.1.5. Other Resins (Maleic, Polyester, Polyamide, etc.)
- 8.1.2. By Additives
- 8.1.2.1. Dispersant
- 8.1.2.2. Biocides
- 8.1.2.3. Surface Modifier
- 8.1.2.4. Other Ad
- 8.1.3. Other Ingredients (Solvent, Pigments, etc.)
- 8.1.1. Resin
- 8.2. Market Analysis, Insights and Forecast - by End-user Industry
- 8.2.1. Automotive
- 8.2.2. Building and Construction
- 8.2.3. Furniture
- 8.2.4. Industrial
- 8.2.5. Packaging
- 8.2.6. Other En
- 8.1. Market Analysis, Insights and Forecast - by Ingredient
- 9. South America Primer Market Analysis, Insights and Forecast, 2019-2031
- 9.1. Market Analysis, Insights and Forecast - by Ingredient
- 9.1.1. Resin
- 9.1.1.1. Acrylic
- 9.1.1.2. Epoxy
- 9.1.1.3. Poly Vinyl Acetate
- 9.1.1.4. Alkyd
- 9.1.1.5. Other Resins (Maleic, Polyester, Polyamide, etc.)
- 9.1.2. By Additives
- 9.1.2.1. Dispersant
- 9.1.2.2. Biocides
- 9.1.2.3. Surface Modifier
- 9.1.2.4. Other Ad
- 9.1.3. Other Ingredients (Solvent, Pigments, etc.)
- 9.1.1. Resin
- 9.2. Market Analysis, Insights and Forecast - by End-user Industry
- 9.2.1. Automotive
- 9.2.2. Building and Construction
- 9.2.3. Furniture
- 9.2.4. Industrial
- 9.2.5. Packaging
- 9.2.6. Other En
- 9.1. Market Analysis, Insights and Forecast - by Ingredient
- 10. Middle East and Africa Primer Market Analysis, Insights and Forecast, 2019-2031
- 10.1. Market Analysis, Insights and Forecast - by Ingredient
- 10.1.1. Resin
- 10.1.1.1. Acrylic
- 10.1.1.2. Epoxy
- 10.1.1.3. Poly Vinyl Acetate
- 10.1.1.4. Alkyd
- 10.1.1.5. Other Resins (Maleic, Polyester, Polyamide, etc.)
- 10.1.2. By Additives
- 10.1.2.1. Dispersant
- 10.1.2.2. Biocides
- 10.1.2.3. Surface Modifier
- 10.1.2.4. Other Ad
- 10.1.3. Other Ingredients (Solvent, Pigments, etc.)
- 10.1.1. Resin
- 10.2. Market Analysis, Insights and Forecast - by End-user Industry
- 10.2.1. Automotive
- 10.2.2. Building and Construction
- 10.2.3. Furniture
- 10.2.4. Industrial
- 10.2.5. Packaging
- 10.2.6. Other En
- 10.1. Market Analysis, Insights and Forecast - by Ingredient
- 11. North America Primer Market Analysis, Insights and Forecast, 2019-2031
- 11.1. Market Analysis, Insights and Forecast - By Country/Sub-region
- 11.1.1 United States
- 11.1.2 Canada
- 11.1.3 Mexico
- 12. Europe Primer Market Analysis, Insights and Forecast, 2019-2031
- 12.1. Market Analysis, Insights and Forecast - By Country/Sub-region
- 12.1.1 Germany
- 12.1.2 France
- 12.1.3 Italy
- 12.1.4 United Kingdom
- 12.1.5 Netherlands
- 12.1.6 Rest of Europe
- 13. Asia Pacific Primer Market Analysis, Insights and Forecast, 2019-2031
- 13.1. Market Analysis, Insights and Forecast - By Country/Sub-region
- 13.1.1 China
- 13.1.2 Japan
- 13.1.3 India
- 13.1.4 South Korea
- 13.1.5 Taiwan
- 13.1.6 Australia
- 13.1.7 Rest of Asia-Pacific
- 14. South America Primer Market Analysis, Insights and Forecast, 2019-2031
- 14.1. Market Analysis, Insights and Forecast - By Country/Sub-region
- 14.1.1 Brazil
- 14.1.2 Argentina
- 14.1.3 Rest of South America
- 15. MEA Primer Market Analysis, Insights and Forecast, 2019-2031
- 15.1. Market Analysis, Insights and Forecast - By Country/Sub-region
- 15.1.1 Middle East
- 15.1.2 Africa
- 16. Competitive Analysis
- 16.1. Global Market Share Analysis 2024
- 16.2. Company Profiles
- 16.2.1 The Sherwin-Williams Company
- 16.2.1.1. Overview
- 16.2.1.2. Products
- 16.2.1.3. SWOT Analysis
- 16.2.1.4. Recent Developments
- 16.2.1.5. Financials (Based on Availability)
- 16.2.2 Jotun
- 16.2.2.1. Overview
- 16.2.2.2. Products
- 16.2.2.3. SWOT Analysis
- 16.2.2.4. Recent Developments
- 16.2.2.5. Financials (Based on Availability)
- 16.2.3 RPM International Inc
- 16.2.3.1. Overview
- 16.2.3.2. Products
- 16.2.3.3. SWOT Analysis
- 16.2.3.4. Recent Developments
- 16.2.3.5. Financials (Based on Availability)
- 16.2.4 Berger Paints India Limited
- 16.2.4.1. Overview
- 16.2.4.2. Products
- 16.2.4.3. SWOT Analysis
- 16.2.4.4. Recent Developments
- 16.2.4.5. Financials (Based on Availability)
- 16.2.5 Kansai Paint Co Ltd
- 16.2.5.1. Overview
- 16.2.5.2. Products
- 16.2.5.3. SWOT Analysis
- 16.2.5.4. Recent Developments
- 16.2.5.5. Financials (Based on Availability)
- 16.2.6 PPG Industries Inc
- 16.2.6.1. Overview
- 16.2.6.2. Products
- 16.2.6.3. SWOT Analysis
- 16.2.6.4. Recent Developments
- 16.2.6.5. Financials (Based on Availability)
- 16.2.7 Masco Corporation
- 16.2.7.1. Overview
- 16.2.7.2. Products
- 16.2.7.3. SWOT Analysis
- 16.2.7.4. Recent Developments
- 16.2.7.5. Financials (Based on Availability)
- 16.2.8 Tikkurila*List Not Exhaustive
- 16.2.8.1. Overview
- 16.2.8.2. Products
- 16.2.8.3. SWOT Analysis
- 16.2.8.4. Recent Developments
- 16.2.8.5. Financials (Based on Availability)
- 16.2.9 BASF SE
- 16.2.9.1. Overview
- 16.2.9.2. Products
- 16.2.9.3. SWOT Analysis
- 16.2.9.4. Recent Developments
- 16.2.9.5. Financials (Based on Availability)
- 16.2.10 Hempel A/S
- 16.2.10.1. Overview
- 16.2.10.2. Products
- 16.2.10.3. SWOT Analysis
- 16.2.10.4. Recent Developments
- 16.2.10.5. Financials (Based on Availability)
- 16.2.11 NIPSEA Group
- 16.2.11.1. Overview
- 16.2.11.2. Products
- 16.2.11.3. SWOT Analysis
- 16.2.11.4. Recent Developments
- 16.2.11.5. Financials (Based on Availability)
- 16.2.12 AkzoNobel NV
- 16.2.12.1. Overview
- 16.2.12.2. Products
- 16.2.12.3. SWOT Analysis
- 16.2.12.4. Recent Developments
- 16.2.12.5. Financials (Based on Availability)
- 16.2.13 Axalta Coating Systems LLC
- 16.2.13.1. Overview
- 16.2.13.2. Products
- 16.2.13.3. SWOT Analysis
- 16.2.13.4. Recent Developments
- 16.2.13.5. Financials (Based on Availability)
- 16.2.14 Asian Paints
- 16.2.14.1. Overview
- 16.2.14.2. Products
- 16.2.14.3. SWOT Analysis
- 16.2.14.4. Recent Developments
- 16.2.14.5. Financials (Based on Availability)
- 16.2.1 The Sherwin-Williams Company
List of Figures
- Figure 1: Global Primer Market Revenue Breakdown (Million, %) by Region 2024 & 2032
- Figure 2: Global Primer Market Volume Breakdown (K Tons, %) by Region 2024 & 2032
- Figure 3: North America Primer Market Revenue (Million), by Country 2024 & 2032
- Figure 4: North America Primer Market Volume (K Tons), by Country 2024 & 2032
- Figure 5: North America Primer Market Revenue Share (%), by Country 2024 & 2032
- Figure 6: North America Primer Market Volume Share (%), by Country 2024 & 2032
- Figure 7: Europe Primer Market Revenue (Million), by Country 2024 & 2032
- Figure 8: Europe Primer Market Volume (K Tons), by Country 2024 & 2032
- Figure 9: Europe Primer Market Revenue Share (%), by Country 2024 & 2032
- Figure 10: Europe Primer Market Volume Share (%), by Country 2024 & 2032
- Figure 11: Asia Pacific Primer Market Revenue (Million), by Country 2024 & 2032
- Figure 12: Asia Pacific Primer Market Volume (K Tons), by Country 2024 & 2032
- Figure 13: Asia Pacific Primer Market Revenue Share (%), by Country 2024 & 2032
- Figure 14: Asia Pacific Primer Market Volume Share (%), by Country 2024 & 2032
- Figure 15: South America Primer Market Revenue (Million), by Country 2024 & 2032
- Figure 16: South America Primer Market Volume (K Tons), by Country 2024 & 2032
- Figure 17: South America Primer Market Revenue Share (%), by Country 2024 & 2032
- Figure 18: South America Primer Market Volume Share (%), by Country 2024 & 2032
- Figure 19: MEA Primer Market Revenue (Million), by Country 2024 & 2032
- Figure 20: MEA Primer Market Volume (K Tons), by Country 2024 & 2032
- Figure 21: MEA Primer Market Revenue Share (%), by Country 2024 & 2032
- Figure 22: MEA Primer Market Volume Share (%), by Country 2024 & 2032
- Figure 23: Asia Pacific Primer Market Revenue (Million), by Ingredient 2024 & 2032
- Figure 24: Asia Pacific Primer Market Volume (K Tons), by Ingredient 2024 & 2032
- Figure 25: Asia Pacific Primer Market Revenue Share (%), by Ingredient 2024 & 2032
- Figure 26: Asia Pacific Primer Market Volume Share (%), by Ingredient 2024 & 2032
- Figure 27: Asia Pacific Primer Market Revenue (Million), by End-user Industry 2024 & 2032
- Figure 28: Asia Pacific Primer Market Volume (K Tons), by End-user Industry 2024 & 2032
- Figure 29: Asia Pacific Primer Market Revenue Share (%), by End-user Industry 2024 & 2032
- Figure 30: Asia Pacific Primer Market Volume Share (%), by End-user Industry 2024 & 2032
- Figure 31: Asia Pacific Primer Market Revenue (Million), by Country 2024 & 2032
- Figure 32: Asia Pacific Primer Market Volume (K Tons), by Country 2024 & 2032
- Figure 33: Asia Pacific Primer Market Revenue Share (%), by Country 2024 & 2032
- Figure 34: Asia Pacific Primer Market Volume Share (%), by Country 2024 & 2032
- Figure 35: North America Primer Market Revenue (Million), by Ingredient 2024 & 2032
- Figure 36: North America Primer Market Volume (K Tons), by Ingredient 2024 & 2032
- Figure 37: North America Primer Market Revenue Share (%), by Ingredient 2024 & 2032
- Figure 38: North America Primer Market Volume Share (%), by Ingredient 2024 & 2032
- Figure 39: North America Primer Market Revenue (Million), by End-user Industry 2024 & 2032
- Figure 40: North America Primer Market Volume (K Tons), by End-user Industry 2024 & 2032
- Figure 41: North America Primer Market Revenue Share (%), by End-user Industry 2024 & 2032
- Figure 42: North America Primer Market Volume Share (%), by End-user Industry 2024 & 2032
- Figure 43: North America Primer Market Revenue (Million), by Country 2024 & 2032
- Figure 44: North America Primer Market Volume (K Tons), by Country 2024 & 2032
- Figure 45: North America Primer Market Revenue Share (%), by Country 2024 & 2032
- Figure 46: North America Primer Market Volume Share (%), by Country 2024 & 2032
- Figure 47: Europe Primer Market Revenue (Million), by Ingredient 2024 & 2032
- Figure 48: Europe Primer Market Volume (K Tons), by Ingredient 2024 & 2032
- Figure 49: Europe Primer Market Revenue Share (%), by Ingredient 2024 & 2032
- Figure 50: Europe Primer Market Volume Share (%), by Ingredient 2024 & 2032
- Figure 51: Europe Primer Market Revenue (Million), by End-user Industry 2024 & 2032
- Figure 52: Europe Primer Market Volume (K Tons), by End-user Industry 2024 & 2032
- Figure 53: Europe Primer Market Revenue Share (%), by End-user Industry 2024 & 2032
- Figure 54: Europe Primer Market Volume Share (%), by End-user Industry 2024 & 2032
- Figure 55: Europe Primer Market Revenue (Million), by Country 2024 & 2032
- Figure 56: Europe Primer Market Volume (K Tons), by Country 2024 & 2032
- Figure 57: Europe Primer Market Revenue Share (%), by Country 2024 & 2032
- Figure 58: Europe Primer Market Volume Share (%), by Country 2024 & 2032
- Figure 59: South America Primer Market Revenue (Million), by Ingredient 2024 & 2032
- Figure 60: South America Primer Market Volume (K Tons), by Ingredient 2024 & 2032
- Figure 61: South America Primer Market Revenue Share (%), by Ingredient 2024 & 2032
- Figure 62: South America Primer Market Volume Share (%), by Ingredient 2024 & 2032
- Figure 63: South America Primer Market Revenue (Million), by End-user Industry 2024 & 2032
- Figure 64: South America Primer Market Volume (K Tons), by End-user Industry 2024 & 2032
- Figure 65: South America Primer Market Revenue Share (%), by End-user Industry 2024 & 2032
- Figure 66: South America Primer Market Volume Share (%), by End-user Industry 2024 & 2032
- Figure 67: South America Primer Market Revenue (Million), by Country 2024 & 2032
- Figure 68: South America Primer Market Volume (K Tons), by Country 2024 & 2032
- Figure 69: South America Primer Market Revenue Share (%), by Country 2024 & 2032
- Figure 70: South America Primer Market Volume Share (%), by Country 2024 & 2032
- Figure 71: Middle East and Africa Primer Market Revenue (Million), by Ingredient 2024 & 2032
- Figure 72: Middle East and Africa Primer Market Volume (K Tons), by Ingredient 2024 & 2032
- Figure 73: Middle East and Africa Primer Market Revenue Share (%), by Ingredient 2024 & 2032
- Figure 74: Middle East and Africa Primer Market Volume Share (%), by Ingredient 2024 & 2032
- Figure 75: Middle East and Africa Primer Market Revenue (Million), by End-user Industry 2024 & 2032
- Figure 76: Middle East and Africa Primer Market Volume (K Tons), by End-user Industry 2024 & 2032
- Figure 77: Middle East and Africa Primer Market Revenue Share (%), by End-user Industry 2024 & 2032
- Figure 78: Middle East and Africa Primer Market Volume Share (%), by End-user Industry 2024 & 2032
- Figure 79: Middle East and Africa Primer Market Revenue (Million), by Country 2024 & 2032
- Figure 80: Middle East and Africa Primer Market Volume (K Tons), by Country 2024 & 2032
- Figure 81: Middle East and Africa Primer Market Revenue Share (%), by Country 2024 & 2032
- Figure 82: Middle East and Africa Primer Market Volume Share (%), by Country 2024 & 2032
List of Tables
- Table 1: Global Primer Market Revenue Million Forecast, by Region 2019 & 2032
- Table 2: Global Primer Market Volume K Tons Forecast, by Region 2019 & 2032
- Table 3: Global Primer Market Revenue Million Forecast, by Ingredient 2019 & 2032
- Table 4: Global Primer Market Volume K Tons Forecast, by Ingredient 2019 & 2032
- Table 5: Global Primer Market Revenue Million Forecast, by End-user Industry 2019 & 2032
- Table 6: Global Primer Market Volume K Tons Forecast, by End-user Industry 2019 & 2032
- Table 7: Global Primer Market Revenue Million Forecast, by Region 2019 & 2032
- Table 8: Global Primer Market Volume K Tons Forecast, by Region 2019 & 2032
- Table 9: Global Primer Market Revenue Million Forecast, by Country 2019 & 2032
- Table 10: Global Primer Market Volume K Tons Forecast, by Country 2019 & 2032
- Table 11: United States Primer Market Revenue (Million) Forecast, by Application 2019 & 2032
- Table 12: United States Primer Market Volume (K Tons) Forecast, by Application 2019 & 2032
- Table 13: Canada Primer Market Revenue (Million) Forecast, by Application 2019 & 2032
- Table 14: Canada Primer Market Volume (K Tons) Forecast, by Application 2019 & 2032
- Table 15: Mexico Primer Market Revenue (Million) Forecast, by Application 2019 & 2032
- Table 16: Mexico Primer Market Volume (K Tons) Forecast, by Application 2019 & 2032
- Table 17: Global Primer Market Revenue Million Forecast, by Country 2019 & 2032
- Table 18: Global Primer Market Volume K Tons Forecast, by Country 2019 & 2032
- Table 19: Germany Primer Market Revenue (Million) Forecast, by Application 2019 & 2032
- Table 20: Germany Primer Market Volume (K Tons) Forecast, by Application 2019 & 2032
- Table 21: France Primer Market Revenue (Million) Forecast, by Application 2019 & 2032
- Table 22: France Primer Market Volume (K Tons) Forecast, by Application 2019 & 2032
- Table 23: Italy Primer Market Revenue (Million) Forecast, by Application 2019 & 2032
- Table 24: Italy Primer Market Volume (K Tons) Forecast, by Application 2019 & 2032
- Table 25: United Kingdom Primer Market Revenue (Million) Forecast, by Application 2019 & 2032
- Table 26: United Kingdom Primer Market Volume (K Tons) Forecast, by Application 2019 & 2032
- Table 27: Netherlands Primer Market Revenue (Million) Forecast, by Application 2019 & 2032
- Table 28: Netherlands Primer Market Volume (K Tons) Forecast, by Application 2019 & 2032
- Table 29: Rest of Europe Primer Market Revenue (Million) Forecast, by Application 2019 & 2032
- Table 30: Rest of Europe Primer Market Volume (K Tons) Forecast, by Application 2019 & 2032
- Table 31: Global Primer Market Revenue Million Forecast, by Country 2019 & 2032
- Table 32: Global Primer Market Volume K Tons Forecast, by Country 2019 & 2032
- Table 33: China Primer Market Revenue (Million) Forecast, by Application 2019 & 2032
- Table 34: China Primer Market Volume (K Tons) Forecast, by Application 2019 & 2032
- Table 35: Japan Primer Market Revenue (Million) Forecast, by Application 2019 & 2032
- Table 36: Japan Primer Market Volume (K Tons) Forecast, by Application 2019 & 2032
- Table 37: India Primer Market Revenue (Million) Forecast, by Application 2019 & 2032
- Table 38: India Primer Market Volume (K Tons) Forecast, by Application 2019 & 2032
- Table 39: South Korea Primer Market Revenue (Million) Forecast, by Application 2019 & 2032
- Table 40: South Korea Primer Market Volume (K Tons) Forecast, by Application 2019 & 2032
- Table 41: Taiwan Primer Market Revenue (Million) Forecast, by Application 2019 & 2032
- Table 42: Taiwan Primer Market Volume (K Tons) Forecast, by Application 2019 & 2032
- Table 43: Australia Primer Market Revenue (Million) Forecast, by Application 2019 & 2032
- Table 44: Australia Primer Market Volume (K Tons) Forecast, by Application 2019 & 2032
- Table 45: Rest of Asia-Pacific Primer Market Revenue (Million) Forecast, by Application 2019 & 2032
- Table 46: Rest of Asia-Pacific Primer Market Volume (K Tons) Forecast, by Application 2019 & 2032
- Table 47: Global Primer Market Revenue Million Forecast, by Country 2019 & 2032
- Table 48: Global Primer Market Volume K Tons Forecast, by Country 2019 & 2032
- Table 49: Brazil Primer Market Revenue (Million) Forecast, by Application 2019 & 2032
- Table 50: Brazil Primer Market Volume (K Tons) Forecast, by Application 2019 & 2032
- Table 51: Argentina Primer Market Revenue (Million) Forecast, by Application 2019 & 2032
- Table 52: Argentina Primer Market Volume (K Tons) Forecast, by Application 2019 & 2032
- Table 53: Rest of South America Primer Market Revenue (Million) Forecast, by Application 2019 & 2032
- Table 54: Rest of South America Primer Market Volume (K Tons) Forecast, by Application 2019 & 2032
- Table 55: Global Primer Market Revenue Million Forecast, by Country 2019 & 2032
- Table 56: Global Primer Market Volume K Tons Forecast, by Country 2019 & 2032
- Table 57: Middle East Primer Market Revenue (Million) Forecast, by Application 2019 & 2032
- Table 58: Middle East Primer Market Volume (K Tons) Forecast, by Application 2019 & 2032
- Table 59: Africa Primer Market Revenue (Million) Forecast, by Application 2019 & 2032
- Table 60: Africa Primer Market Volume (K Tons) Forecast, by Application 2019 & 2032
- Table 61: Global Primer Market Revenue Million Forecast, by Ingredient 2019 & 2032
- Table 62: Global Primer Market Volume K Tons Forecast, by Ingredient 2019 & 2032
- Table 63: Global Primer Market Revenue Million Forecast, by End-user Industry 2019 & 2032
- Table 64: Global Primer Market Volume K Tons Forecast, by End-user Industry 2019 & 2032
- Table 65: Global Primer Market Revenue Million Forecast, by Country 2019 & 2032
- Table 66: Global Primer Market Volume K Tons Forecast, by Country 2019 & 2032
- Table 67: China Primer Market Revenue (Million) Forecast, by Application 2019 & 2032
- Table 68: China Primer Market Volume (K Tons) Forecast, by Application 2019 & 2032
- Table 69: India Primer Market Revenue (Million) Forecast, by Application 2019 & 2032
- Table 70: India Primer Market Volume (K Tons) Forecast, by Application 2019 & 2032
- Table 71: Japan Primer Market Revenue (Million) Forecast, by Application 2019 & 2032
- Table 72: Japan Primer Market Volume (K Tons) Forecast, by Application 2019 & 2032
- Table 73: South Korea Primer Market Revenue (Million) Forecast, by Application 2019 & 2032
- Table 74: South Korea Primer Market Volume (K Tons) Forecast, by Application 2019 & 2032
- Table 75: Malaysia Primer Market Revenue (Million) Forecast, by Application 2019 & 2032
- Table 76: Malaysia Primer Market Volume (K Tons) Forecast, by Application 2019 & 2032
- Table 77: Thailand Primer Market Revenue (Million) Forecast, by Application 2019 & 2032
- Table 78: Thailand Primer Market Volume (K Tons) Forecast, by Application 2019 & 2032
- Table 79: Indonesia Primer Market Revenue (Million) Forecast, by Application 2019 & 2032
- Table 80: Indonesia Primer Market Volume (K Tons) Forecast, by Application 2019 & 2032
- Table 81: Vietnam Primer Market Revenue (Million) Forecast, by Application 2019 & 2032
- Table 82: Vietnam Primer Market Volume (K Tons) Forecast, by Application 2019 & 2032
- Table 83: Rest of Asia Pacific Primer Market Revenue (Million) Forecast, by Application 2019 & 2032
- Table 84: Rest of Asia Pacific Primer Market Volume (K Tons) Forecast, by Application 2019 & 2032
- Table 85: Global Primer Market Revenue Million Forecast, by Ingredient 2019 & 2032
- Table 86: Global Primer Market Volume K Tons Forecast, by Ingredient 2019 & 2032
- Table 87: Global Primer Market Revenue Million Forecast, by End-user Industry 2019 & 2032
- Table 88: Global Primer Market Volume K Tons Forecast, by End-user Industry 2019 & 2032
- Table 89: Global Primer Market Revenue Million Forecast, by Country 2019 & 2032
- Table 90: Global Primer Market Volume K Tons Forecast, by Country 2019 & 2032
- Table 91: United States Primer Market Revenue (Million) Forecast, by Application 2019 & 2032
- Table 92: United States Primer Market Volume (K Tons) Forecast, by Application 2019 & 2032
- Table 93: Canada Primer Market Revenue (Million) Forecast, by Application 2019 & 2032
- Table 94: Canada Primer Market Volume (K Tons) Forecast, by Application 2019 & 2032
- Table 95: Mexico Primer Market Revenue (Million) Forecast, by Application 2019 & 2032
- Table 96: Mexico Primer Market Volume (K Tons) Forecast, by Application 2019 & 2032
- Table 97: Global Primer Market Revenue Million Forecast, by Ingredient 2019 & 2032
- Table 98: Global Primer Market Volume K Tons Forecast, by Ingredient 2019 & 2032
- Table 99: Global Primer Market Revenue Million Forecast, by End-user Industry 2019 & 2032
- Table 100: Global Primer Market Volume K Tons Forecast, by End-user Industry 2019 & 2032
- Table 101: Global Primer Market Revenue Million Forecast, by Country 2019 & 2032
- Table 102: Global Primer Market Volume K Tons Forecast, by Country 2019 & 2032
- Table 103: Germany Primer Market Revenue (Million) Forecast, by Application 2019 & 2032
- Table 104: Germany Primer Market Volume (K Tons) Forecast, by Application 2019 & 2032
- Table 105: United Kingdom Primer Market Revenue (Million) Forecast, by Application 2019 & 2032
- Table 106: United Kingdom Primer Market Volume (K Tons) Forecast, by Application 2019 & 2032
- Table 107: Italy Primer Market Revenue (Million) Forecast, by Application 2019 & 2032
- Table 108: Italy Primer Market Volume (K Tons) Forecast, by Application 2019 & 2032
- Table 109: France Primer Market Revenue (Million) Forecast, by Application 2019 & 2032
- Table 110: France Primer Market Volume (K Tons) Forecast, by Application 2019 & 2032
- Table 111: Spain Primer Market Revenue (Million) Forecast, by Application 2019 & 2032
- Table 112: Spain Primer Market Volume (K Tons) Forecast, by Application 2019 & 2032
- Table 113: NORDIC Primer Market Revenue (Million) Forecast, by Application 2019 & 2032
- Table 114: NORDIC Primer Market Volume (K Tons) Forecast, by Application 2019 & 2032
- Table 115: Turkey Primer Market Revenue (Million) Forecast, by Application 2019 & 2032
- Table 116: Turkey Primer Market Volume (K Tons) Forecast, by Application 2019 & 2032
- Table 117: Russia Primer Market Revenue (Million) Forecast, by Application 2019 & 2032
- Table 118: Russia Primer Market Volume (K Tons) Forecast, by Application 2019 & 2032
- Table 119: Rest of Europe Primer Market Revenue (Million) Forecast, by Application 2019 & 2032
- Table 120: Rest of Europe Primer Market Volume (K Tons) Forecast, by Application 2019 & 2032
- Table 121: Global Primer Market Revenue Million Forecast, by Ingredient 2019 & 2032
- Table 122: Global Primer Market Volume K Tons Forecast, by Ingredient 2019 & 2032
- Table 123: Global Primer Market Revenue Million Forecast, by End-user Industry 2019 & 2032
- Table 124: Global Primer Market Volume K Tons Forecast, by End-user Industry 2019 & 2032
- Table 125: Global Primer Market Revenue Million Forecast, by Country 2019 & 2032
- Table 126: Global Primer Market Volume K Tons Forecast, by Country 2019 & 2032
- Table 127: Brazil Primer Market Revenue (Million) Forecast, by Application 2019 & 2032
- Table 128: Brazil Primer Market Volume (K Tons) Forecast, by Application 2019 & 2032
- Table 129: Argentina Primer Market Revenue (Million) Forecast, by Application 2019 & 2032
- Table 130: Argentina Primer Market Volume (K Tons) Forecast, by Application 2019 & 2032
- Table 131: Colombia Primer Market Revenue (Million) Forecast, by Application 2019 & 2032
- Table 132: Colombia Primer Market Volume (K Tons) Forecast, by Application 2019 & 2032
- Table 133: Rest of South America Primer Market Revenue (Million) Forecast, by Application 2019 & 2032
- Table 134: Rest of South America Primer Market Volume (K Tons) Forecast, by Application 2019 & 2032
- Table 135: Global Primer Market Revenue Million Forecast, by Ingredient 2019 & 2032
- Table 136: Global Primer Market Volume K Tons Forecast, by Ingredient 2019 & 2032
- Table 137: Global Primer Market Revenue Million Forecast, by End-user Industry 2019 & 2032
- Table 138: Global Primer Market Volume K Tons Forecast, by End-user Industry 2019 & 2032
- Table 139: Global Primer Market Revenue Million Forecast, by Country 2019 & 2032
- Table 140: Global Primer Market Volume K Tons Forecast, by Country 2019 & 2032
- Table 141: Saudi Arabia Primer Market Revenue (Million) Forecast, by Application 2019 & 2032
- Table 142: Saudi Arabia Primer Market Volume (K Tons) Forecast, by Application 2019 & 2032
- Table 143: South Africa Primer Market Revenue (Million) Forecast, by Application 2019 & 2032
- Table 144: South Africa Primer Market Volume (K Tons) Forecast, by Application 2019 & 2032
- Table 145: Nigeria Primer Market Revenue (Million) Forecast, by Application 2019 & 2032
- Table 146: Nigeria Primer Market Volume (K Tons) Forecast, by Application 2019 & 2032
- Table 147: Qatar Primer Market Revenue (Million) Forecast, by Application 2019 & 2032
- Table 148: Qatar Primer Market Volume (K Tons) Forecast, by Application 2019 & 2032
- Table 149: Egypt Primer Market Revenue (Million) Forecast, by Application 2019 & 2032
- Table 150: Egypt Primer Market Volume (K Tons) Forecast, by Application 2019 & 2032
- Table 151: United Arab Emirates Primer Market Revenue (Million) Forecast, by Application 2019 & 2032
- Table 152: United Arab Emirates Primer Market Volume (K Tons) Forecast, by Application 2019 & 2032
- Table 153: Rest of Middle East and Africa Primer Market Revenue (Million) Forecast, by Application 2019 & 2032
- Table 154: Rest of Middle East and Africa Primer Market Volume (K Tons) Forecast, by Application 2019 & 2032
Frequently Asked Questions
1. What is the projected Compound Annual Growth Rate (CAGR) of the Primer Market?
The projected CAGR is approximately 5.91%.
2. Which companies are prominent players in the Primer Market?
Key companies in the market include The Sherwin-Williams Company, Jotun, RPM International Inc, Berger Paints India Limited, Kansai Paint Co Ltd, PPG Industries Inc, Masco Corporation, Tikkurila*List Not Exhaustive, BASF SE, Hempel A/S, NIPSEA Group, AkzoNobel NV, Axalta Coating Systems LLC, Asian Paints.
3. What are the main segments of the Primer Market?
The market segments include Ingredient, End-user Industry.
4. Can you provide details about the market size?
The market size is estimated to be USD 21.34 Million as of 2022.
5. What are some drivers contributing to market growth?
Increasing Construction Activities in the Asia-Pacific Region; Growing Automotive Industry; Other Drivers.
6. What are the notable trends driving market growth?
Building and Construction Segment to Dominate the Market.
7. Are there any restraints impacting market growth?
Stringent Environmental Regulations Regarding the Use of Primers; Other Restraints.
8. Can you provide examples of recent developments in the market?
March 2023: PPG Industries Inc. launched the PPG ENVIROCRON Primeron primer powder portfolio, designed to provide high corrosion resistance for metal substrates, including steel, hot-dip galvanized steel, metalized steel, and aluminum.
9. What pricing options are available for accessing the report?
Pricing options include single-user, multi-user, and enterprise licenses priced at USD 3,950, USD 4,950, and USD 6,950 respectively.
10. Is the market size provided in terms of value or volume?
The market size is provided in terms of value, measured in Million and volume, measured in K Tons.
11. Are there any specific market keywords associated with the report?
Yes, the market keyword associated with the report is "Primer Market," which aids in identifying and referencing the specific market segment covered.
12. How do I determine which pricing option suits my needs best?
The pricing options vary based on user requirements and access needs. Individual users may opt for single-user licenses, while businesses requiring broader access may choose multi-user or enterprise licenses for cost-effective access to the report.
13. Are there any additional resources or data provided in the Primer Market report?
While the report offers comprehensive insights, it's advisable to review the specific contents or supplementary materials provided to ascertain if additional resources or data are available.
14. How can I stay updated on further developments or reports in the Primer Market?
To stay informed about further developments, trends, and reports in the Primer Market, consider subscribing to industry newsletters, following relevant companies and organizations, or regularly checking reputable industry news sources and publications.
Methodology
Step 1 - Identification of Relevant Samples Size from Population Database


Step 2 - Approaches for Defining Global Market Size (Value, Volume* & Price*)

Note*: In applicable scenarios
Step 3 - Data Sources
Primary Research
- Web Analytics
- Survey Reports
- Research Institute
- Latest Research Reports
- Opinion Leaders
Secondary Research
- Annual Reports
- White Paper
- Latest Press Release
- Industry Association
- Paid Database
- Investor Presentations

Step 4 - Data Triangulation
Involves using different sources of information in order to increase the validity of a study
These sources are likely to be stakeholders in a program - participants, other researchers, program staff, other community members, and so on.
Then we put all data in single framework & apply various statistical tools to find out the dynamic on the market.
During the analysis stage, feedback from the stakeholder groups would be compared to determine areas of agreement as well as areas of divergence


