
Key Insights
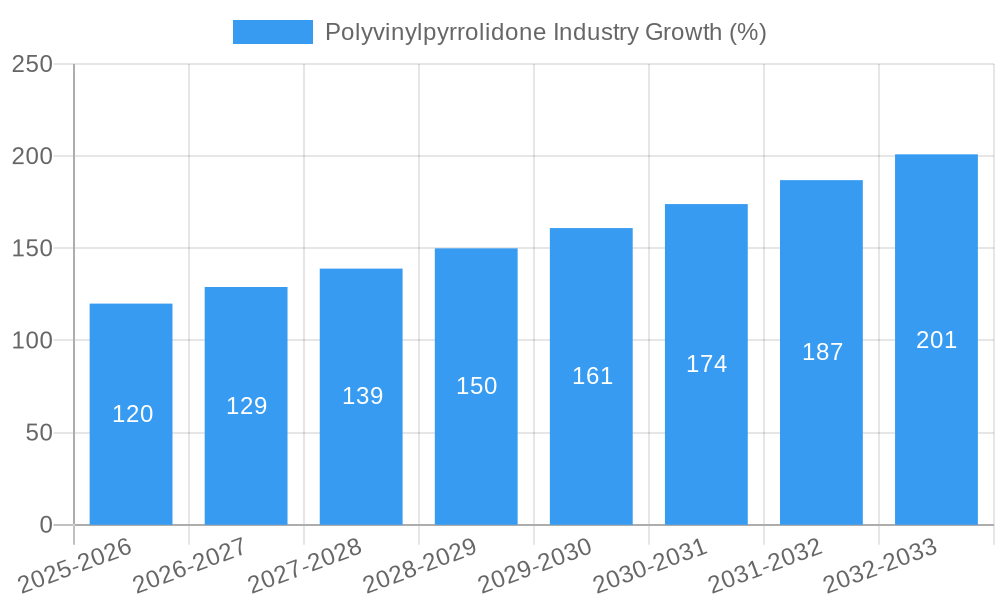
The global Polyvinylpyrrolidone (PVP) market, valued at approximately $1.5 billion in 2025, is projected to experience robust growth, exhibiting a Compound Annual Growth Rate (CAGR) exceeding 8% from 2025 to 2033. This expansion is driven by several key factors. The pharmaceutical industry's increasing demand for PVP as a binder, disintegrant, and film-forming agent in tablet formulations fuels significant market growth. Furthermore, the burgeoning cosmetics and personal care sector utilizes PVP for its film-forming, thickening, and viscosity-modifying properties in hairsprays, shampoos, and other products. The food and beverage industry also contributes to market expansion, leveraging PVP's properties as a stabilizer and thickener in various food applications. Technological advancements leading to improved PVP grades with enhanced properties, such as increased solubility and purity, further contribute to market growth. However, potential price fluctuations in raw materials and stringent regulatory approvals in certain regions pose challenges to market expansion. Competition among established players and emerging manufacturers also influences market dynamics.
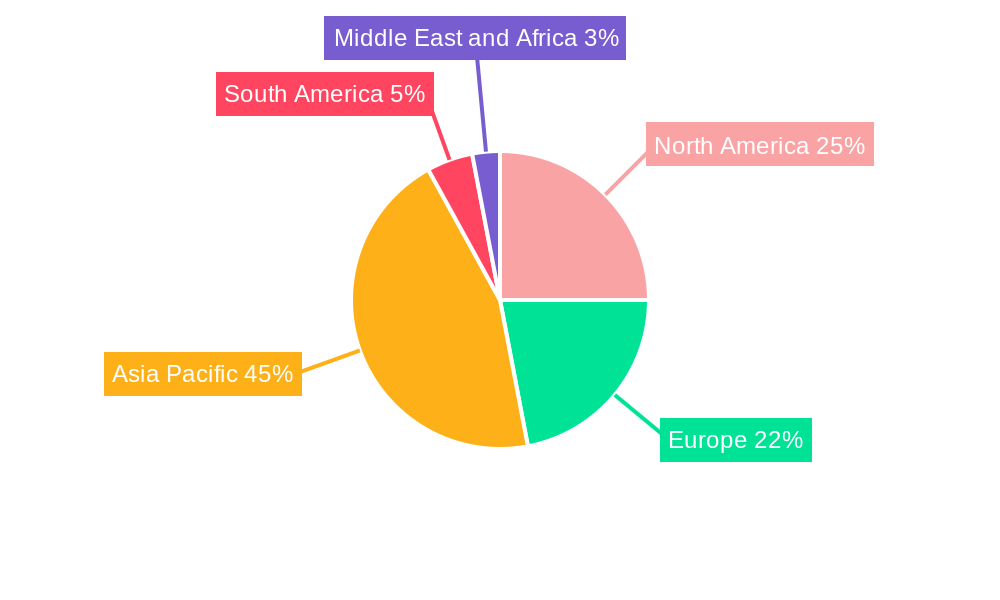
Geographic analysis reveals a diverse market landscape. The Asia Pacific region, particularly China and India, dominates the market due to substantial pharmaceutical and cosmetic manufacturing sectors. North America and Europe follow closely, driven by strong demand from established pharmaceutical and personal care industries. While South America and the Middle East and Africa show promising growth potential, their market share currently remains comparatively smaller. The market segmentation by form (powder and liquid) and application (pharmaceutical, food and beverage, cosmetics, adhesives, and others) highlights the versatility of PVP and contributes to its widespread usage across various industries. The market is characterized by a mix of large multinational corporations and smaller regional players, resulting in a competitive environment that drives innovation and efficiency improvements. Future market growth will likely be shaped by factors including the development of novel PVP applications, increased regulatory scrutiny, and the adoption of sustainable manufacturing practices.
Polyvinylpyrrolidone (PVP) Industry Market Report: 2019-2033
This comprehensive report provides an in-depth analysis of the global Polyvinylpyrrolidone (PVP) industry, offering valuable insights for stakeholders across the value chain. The study period covers 2019-2033, with 2025 as the base and estimated year. The report forecasts market trends from 2025 to 2033, leveraging data from the historical period (2019-2024). The global PVP market is expected to reach xx Million by 2033, exhibiting a CAGR of xx% during the forecast period.
Polyvinylpyrrolidone Industry Market Structure & Competitive Dynamics
The global Polyvinylpyrrolidone (PVP) market exhibits a moderately concentrated structure, with key players holding significant market share. Market concentration is influenced by factors such as economies of scale in manufacturing, R&D capabilities, and established distribution networks. The industry is characterized by intense competition, driven by product innovation, pricing strategies, and geographic expansion.
- Market Share: The top five players account for approximately xx% of the global market share in 2025. BASF SE and Ashland are expected to maintain their leading positions.
- Innovation Ecosystems: Significant investments in R&D by major players are fostering innovation in PVP formulations, applications, and production processes. This includes developing specialized PVP grades with enhanced properties tailored to specific applications.
- Regulatory Frameworks: The PVP industry is subject to various regulations concerning safety, quality, and environmental compliance, which vary across different regions. These regulations significantly impact production costs and product approvals.
- Product Substitutes: While PVP has unique properties, some substitute materials exist depending on the specific application. However, PVP’s superior performance in many areas limits the impact of substitutes.
- End-User Trends: The growing demand across diverse sectors, such as pharmaceuticals, cosmetics, and adhesives, is a key market driver. Demand shifts towards high-performance PVP grades with enhanced properties are also noteworthy.
- M&A Activities: The industry has witnessed several mergers and acquisitions (M&A) in recent years, driven by the need for expansion, technological integration, and diversification. Total M&A deal value in the period 2019-2024 reached an estimated xx Million, indicating a consolidated market trend.
Polyvinylpyrrolidone Industry Industry Trends & Insights
The global Polyvinylpyrrolidone (PVP) market is experiencing robust growth, fueled by several key trends. The increasing demand across various end-use industries, primarily driven by advancements in pharmaceuticals, cosmetics, and food & beverage sectors, serves as a major catalyst. Technological innovations focused on improving PVP's functionality and expanding its applications in niche markets further stimulate market growth.
The rising disposable incomes, coupled with escalating consumer awareness regarding personal care and hygiene, are key factors driving the demand for PVP in the cosmetics and personal care industries. Similarly, the rising pharmaceutical sector is boosting the demand for high-purity PVP in drug formulations. However, fluctuations in raw material prices and stringent regulatory requirements could pose challenges to market growth. The market is expected to witness a substantial increase in the adoption of bio-based PVP, driven by growing environmental concerns and a rising inclination toward sustainable alternatives. The CAGR for the forecast period (2025-2033) is projected at xx%, driven by technological advancements and expanding application areas. Market penetration in emerging economies, particularly in Asia Pacific, is expected to see significant growth.
Dominant Markets & Segments in Polyvinylpyrrolidone Industry
The Asia Pacific region dominates the global Polyvinylpyrrolidone market, driven by high population density, rapid economic growth, and increased industrial activity. China and India are major contributors to this regional dominance.
- Key Drivers for Asia Pacific Dominance:
- Rapid industrialization and infrastructure development.
- Expanding pharmaceutical and cosmetic industries.
- Favorable government policies promoting manufacturing.
- Growing disposable incomes driving consumer demand.
Segment Analysis:
- Form: The powder form of PVP holds a larger market share compared to liquid PVP due to its ease of handling, storage, and application in various industries.
- Application: The pharmaceutical sector is the largest consumer of PVP, due to its versatile applications in drug formulations, followed by the cosmetics and adhesives industries.
Polyvinylpyrrolidone Industry Product Innovations
Recent product innovations in the PVP market focus on developing specialized grades tailored to specific applications. This includes PVP with enhanced biocompatibility for pharmaceutical use, PVP with improved film-forming properties for cosmetics, and PVP with increased adhesive strength for industrial applications. These innovations provide competitive advantages by delivering superior performance and meeting evolving customer needs. Technological trends focus on improving manufacturing processes for higher purity and cost-efficiency, alongside exploring sustainable alternatives.
Report Segmentation & Scope
The report segments the PVP market based on form (powder, liquid) and application (pharmaceutical, food and beverage, cosmetics, adhesives, other). Each segment's market size, growth projections, and competitive dynamics are analyzed in detail. The pharmaceutical segment is expected to witness the highest growth rate due to increasing drug development and demand for high-quality excipients. The cosmetics segment shows steady growth, driven by increasing demand for effective and safe cosmetic products. The food and beverage segment demonstrates moderate growth due to its use as a stabilizer and binder. The adhesives segment also shows consistent growth, while "Other Applications" encompasses a range of niche applications, exhibiting variable growth patterns.
Key Drivers of Polyvinylpyrrolidone Industry Growth
Several factors drive the growth of the PVP industry:
- Technological Advancements: Continuous innovation leads to enhanced PVP properties, broadening its applications.
- Increasing Demand from End-Use Sectors: Growth in pharmaceutical, cosmetic, and industrial sectors fuels PVP consumption.
- Rising Disposable Incomes: Increased purchasing power boosts demand for consumer products containing PVP.
- Favorable Government Regulations: Supportive policies and regulations promote industrial growth.
Challenges in the Polyvinylpyrrolidone Industry Sector
The PVP industry faces challenges like:
- Fluctuations in Raw Material Prices: Price volatility impacts production costs and profitability.
- Stringent Regulatory Requirements: Meeting compliance standards increases operational complexity.
- Intense Competition: The presence of numerous players creates a competitive environment.
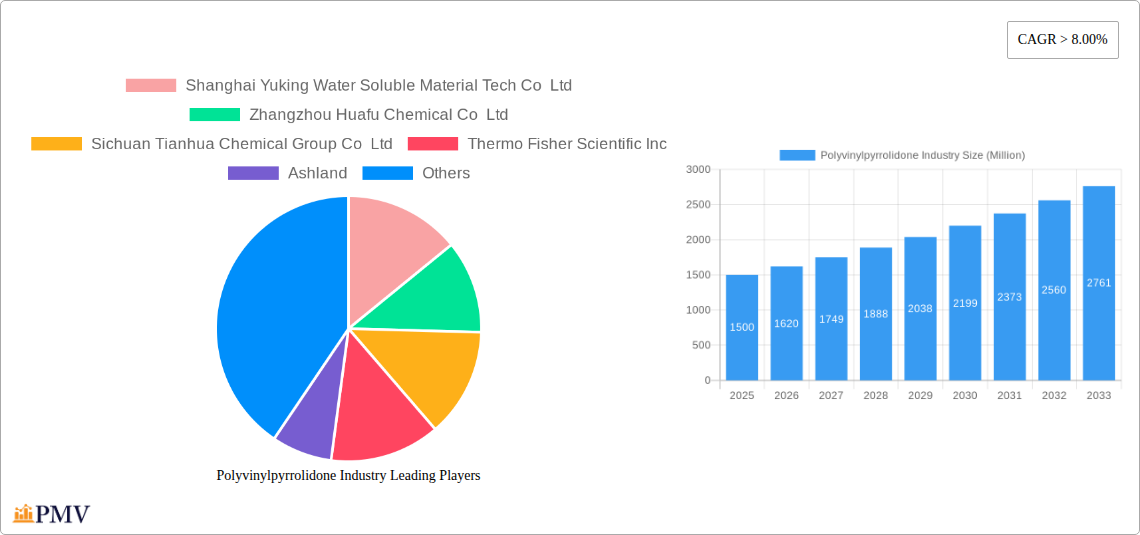
Leading Players in the Polyvinylpyrrolidone Industry Market
- BASF SE
- Ashland
- Shanghai Yuking Water Soluble Material Tech Co Ltd
- Zhangzhou Huafu Chemical Co Ltd
- Sichuan Tianhua Chemical Group Co Ltd
- Glide Chem Private Limited
- Hangzhou Motto Science & Technology Co Ltd
- Boai NKY Pharmaceuticals Ltd
- JH Nanhang Life Sciences Co Ltd
- Nippon Shokubai Co Ltd
- Shanghai Qifuqing Material Technology Co Ltd
- Thermo Fisher Scientific Inc
Key Developments in Polyvinylpyrrolidone Industry Sector
- June 2022: Univar announced its distribution partnership with Boai Nky Pharmaceuticals to expand its European polymer products business, including various PVP and PVP/VI polymers. This move is expected to boost Boai Nky Pharmaceuticals' presence in the European detergent market.
Strategic Polyvinylpyrrolidone Industry Market Outlook
The future of the Polyvinylpyrrolidone industry looks promising, with continued growth driven by technological advancements, expanding applications, and increasing demand across various sectors. Strategic opportunities exist in developing sustainable PVP alternatives, exploring niche applications, and expanding into emerging markets. Companies focusing on innovation, sustainability, and strategic partnerships are poised to gain a competitive edge in this growing market.
Polyvinylpyrrolidone Industry Segmentation
-
1. Form
- 1.1. Powder
- 1.2. Liquid
-
2. Application
- 2.1. Pharmaceutical
- 2.2. Food and Beverage
- 2.3. Cosmetics
- 2.4. Adhesives
- 2.5. Other Applications
Polyvinylpyrrolidone Industry Segmentation By Geography
-
1. Asia Pacific
- 1.1. China
- 1.2. India
- 1.3. Japan
- 1.4. South Korea
- 1.5. Southeast Asia
- 1.6. Australia
- 1.7. Rest of Asia Pacific
-
2. North America
- 2.1. United States
- 2.2. Canada
- 2.3. Mexico
-
3. Europe
- 3.1. Germany
- 3.2. United Kingdom
- 3.3. Italy
- 3.4. France
- 3.5. Spain
- 3.6. Rest of Europe
-
4. South America
- 4.1. Brazil
- 4.2. Argentina
- 4.3. Rest of South America
-
5. Middle East and Africa
- 5.1. Saudi Arabia
- 5.2. South Africa
- 5.3. UAE
- 5.4. Nigeria
- 5.5. Rest of MEA
Polyvinylpyrrolidone Industry REPORT HIGHLIGHTS
| Aspects | Details |
|---|---|
| Study Period | 2019-2033 |
| Base Year | 2024 |
| Estimated Year | 2025 |
| Forecast Period | 2025-2033 |
| Historical Period | 2019-2024 |
| Growth Rate | CAGR of > 8.00% from 2019-2033 |
| Segmentation |
|
Table of Contents
- 1. Introduction
- 1.1. Research Scope
- 1.2. Market Segmentation
- 1.3. Research Methodology
- 1.4. Definitions and Assumptions
- 2. Executive Summary
- 2.1. Introduction
- 3. Market Dynamics
- 3.1. Introduction
- 3.2. Market Drivers
- 3.2.1. Rising Demand in the Pharmaceutical Industry; Growing Application as Adhesives in the Construction Industry
- 3.3. Market Restrains
- 3.3.1. Presence of Substitutes
- 3.4. Market Trends
- 3.4.1. Rising Demand in the Pharmaceutical Industry
- 4. Market Factor Analysis
- 4.1. Porters Five Forces
- 4.2. Supply/Value Chain
- 4.3. PESTEL analysis
- 4.4. Market Entropy
- 4.5. Patent/Trademark Analysis
- 5. Global Polyvinylpyrrolidone Industry Analysis, Insights and Forecast, 2019-2031
- 5.1. Market Analysis, Insights and Forecast - by Form
- 5.1.1. Powder
- 5.1.2. Liquid
- 5.2. Market Analysis, Insights and Forecast - by Application
- 5.2.1. Pharmaceutical
- 5.2.2. Food and Beverage
- 5.2.3. Cosmetics
- 5.2.4. Adhesives
- 5.2.5. Other Applications
- 5.3. Market Analysis, Insights and Forecast - by Region
- 5.3.1. Asia Pacific
- 5.3.2. North America
- 5.3.3. Europe
- 5.3.4. South America
- 5.3.5. Middle East and Africa
- 5.1. Market Analysis, Insights and Forecast - by Form
- 6. Asia Pacific Polyvinylpyrrolidone Industry Analysis, Insights and Forecast, 2019-2031
- 6.1. Market Analysis, Insights and Forecast - by Form
- 6.1.1. Powder
- 6.1.2. Liquid
- 6.2. Market Analysis, Insights and Forecast - by Application
- 6.2.1. Pharmaceutical
- 6.2.2. Food and Beverage
- 6.2.3. Cosmetics
- 6.2.4. Adhesives
- 6.2.5. Other Applications
- 6.1. Market Analysis, Insights and Forecast - by Form
- 7. North America Polyvinylpyrrolidone Industry Analysis, Insights and Forecast, 2019-2031
- 7.1. Market Analysis, Insights and Forecast - by Form
- 7.1.1. Powder
- 7.1.2. Liquid
- 7.2. Market Analysis, Insights and Forecast - by Application
- 7.2.1. Pharmaceutical
- 7.2.2. Food and Beverage
- 7.2.3. Cosmetics
- 7.2.4. Adhesives
- 7.2.5. Other Applications
- 7.1. Market Analysis, Insights and Forecast - by Form
- 8. Europe Polyvinylpyrrolidone Industry Analysis, Insights and Forecast, 2019-2031
- 8.1. Market Analysis, Insights and Forecast - by Form
- 8.1.1. Powder
- 8.1.2. Liquid
- 8.2. Market Analysis, Insights and Forecast - by Application
- 8.2.1. Pharmaceutical
- 8.2.2. Food and Beverage
- 8.2.3. Cosmetics
- 8.2.4. Adhesives
- 8.2.5. Other Applications
- 8.1. Market Analysis, Insights and Forecast - by Form
- 9. South America Polyvinylpyrrolidone Industry Analysis, Insights and Forecast, 2019-2031
- 9.1. Market Analysis, Insights and Forecast - by Form
- 9.1.1. Powder
- 9.1.2. Liquid
- 9.2. Market Analysis, Insights and Forecast - by Application
- 9.2.1. Pharmaceutical
- 9.2.2. Food and Beverage
- 9.2.3. Cosmetics
- 9.2.4. Adhesives
- 9.2.5. Other Applications
- 9.1. Market Analysis, Insights and Forecast - by Form
- 10. Middle East and Africa Polyvinylpyrrolidone Industry Analysis, Insights and Forecast, 2019-2031
- 10.1. Market Analysis, Insights and Forecast - by Form
- 10.1.1. Powder
- 10.1.2. Liquid
- 10.2. Market Analysis, Insights and Forecast - by Application
- 10.2.1. Pharmaceutical
- 10.2.2. Food and Beverage
- 10.2.3. Cosmetics
- 10.2.4. Adhesives
- 10.2.5. Other Applications
- 10.1. Market Analysis, Insights and Forecast - by Form
- 11. Asia Pacific Polyvinylpyrrolidone Industry Analysis, Insights and Forecast, 2019-2031
- 11.1. Market Analysis, Insights and Forecast - By Country/Sub-region
- 11.1.1 China
- 11.1.2 India
- 11.1.3 Japan
- 11.1.4 Rest of Asia Pacific
- 12. North America Polyvinylpyrrolidone Industry Analysis, Insights and Forecast, 2019-2031
- 12.1. Market Analysis, Insights and Forecast - By Country/Sub-region
- 12.1.1 United States
- 12.1.2 Canada
- 12.1.3 Mexico
- 13. Europe Polyvinylpyrrolidone Industry Analysis, Insights and Forecast, 2019-2031
- 13.1. Market Analysis, Insights and Forecast - By Country/Sub-region
- 13.1.1 Germany
- 13.1.2 United Kingdom
- 13.1.3 Italy
- 13.1.4 France
- 13.1.5 Rest of Europe
- 14. South America Polyvinylpyrrolidone Industry Analysis, Insights and Forecast, 2019-2031
- 14.1. Market Analysis, Insights and Forecast - By Country/Sub-region
- 14.1.1 Brazil
- 14.1.2 Argentina
- 14.1.3 Rest of South America
- 15. Middle East and Africa Polyvinylpyrrolidone Industry Analysis, Insights and Forecast, 2019-2031
- 15.1. Market Analysis, Insights and Forecast - By Country/Sub-region
- 15.1.1 Saudi Arabia
- 15.1.2 South Africa
- 15.1.3 Rest of Middle East and Africa
- 16. Competitive Analysis
- 16.1. Global Market Share Analysis 2024
- 16.2. Company Profiles
- 16.2.1 Shanghai Yuking Water Soluble Material Tech Co Ltd
- 16.2.1.1. Overview
- 16.2.1.2. Products
- 16.2.1.3. SWOT Analysis
- 16.2.1.4. Recent Developments
- 16.2.1.5. Financials (Based on Availability)
- 16.2.2 Zhangzhou Huafu Chemical Co Ltd
- 16.2.2.1. Overview
- 16.2.2.2. Products
- 16.2.2.3. SWOT Analysis
- 16.2.2.4. Recent Developments
- 16.2.2.5. Financials (Based on Availability)
- 16.2.3 Sichuan Tianhua Chemical Group Co Ltd
- 16.2.3.1. Overview
- 16.2.3.2. Products
- 16.2.3.3. SWOT Analysis
- 16.2.3.4. Recent Developments
- 16.2.3.5. Financials (Based on Availability)
- 16.2.4 Thermo Fisher Scientific Inc
- 16.2.4.1. Overview
- 16.2.4.2. Products
- 16.2.4.3. SWOT Analysis
- 16.2.4.4. Recent Developments
- 16.2.4.5. Financials (Based on Availability)
- 16.2.5 Ashland
- 16.2.5.1. Overview
- 16.2.5.2. Products
- 16.2.5.3. SWOT Analysis
- 16.2.5.4. Recent Developments
- 16.2.5.5. Financials (Based on Availability)
- 16.2.6 Glide Chem Private Limited
- 16.2.6.1. Overview
- 16.2.6.2. Products
- 16.2.6.3. SWOT Analysis
- 16.2.6.4. Recent Developments
- 16.2.6.5. Financials (Based on Availability)
- 16.2.7 BASF SE
- 16.2.7.1. Overview
- 16.2.7.2. Products
- 16.2.7.3. SWOT Analysis
- 16.2.7.4. Recent Developments
- 16.2.7.5. Financials (Based on Availability)
- 16.2.8 Hangzhou Motto Science & Technology Co Ltd
- 16.2.8.1. Overview
- 16.2.8.2. Products
- 16.2.8.3. SWOT Analysis
- 16.2.8.4. Recent Developments
- 16.2.8.5. Financials (Based on Availability)
- 16.2.9 Boai NKY Pharmaceuticals Ltd
- 16.2.9.1. Overview
- 16.2.9.2. Products
- 16.2.9.3. SWOT Analysis
- 16.2.9.4. Recent Developments
- 16.2.9.5. Financials (Based on Availability)
- 16.2.10 JH Nanhang Life Sciences Co Ltd
- 16.2.10.1. Overview
- 16.2.10.2. Products
- 16.2.10.3. SWOT Analysis
- 16.2.10.4. Recent Developments
- 16.2.10.5. Financials (Based on Availability)
- 16.2.11 Nippon Shokubai Co Ltd
- 16.2.11.1. Overview
- 16.2.11.2. Products
- 16.2.11.3. SWOT Analysis
- 16.2.11.4. Recent Developments
- 16.2.11.5. Financials (Based on Availability)
- 16.2.12 Shanghai Qifuqing Material Technology Co Ltd
- 16.2.12.1. Overview
- 16.2.12.2. Products
- 16.2.12.3. SWOT Analysis
- 16.2.12.4. Recent Developments
- 16.2.12.5. Financials (Based on Availability)
- 16.2.1 Shanghai Yuking Water Soluble Material Tech Co Ltd
List of Figures
- Figure 1: Global Polyvinylpyrrolidone Industry Revenue Breakdown (Million, %) by Region 2024 & 2032
- Figure 2: Global Polyvinylpyrrolidone Industry Volume Breakdown (K Tons, %) by Region 2024 & 2032
- Figure 3: Asia Pacific Polyvinylpyrrolidone Industry Revenue (Million), by Country 2024 & 2032
- Figure 4: Asia Pacific Polyvinylpyrrolidone Industry Volume (K Tons), by Country 2024 & 2032
- Figure 5: Asia Pacific Polyvinylpyrrolidone Industry Revenue Share (%), by Country 2024 & 2032
- Figure 6: Asia Pacific Polyvinylpyrrolidone Industry Volume Share (%), by Country 2024 & 2032
- Figure 7: North America Polyvinylpyrrolidone Industry Revenue (Million), by Country 2024 & 2032
- Figure 8: North America Polyvinylpyrrolidone Industry Volume (K Tons), by Country 2024 & 2032
- Figure 9: North America Polyvinylpyrrolidone Industry Revenue Share (%), by Country 2024 & 2032
- Figure 10: North America Polyvinylpyrrolidone Industry Volume Share (%), by Country 2024 & 2032
- Figure 11: Europe Polyvinylpyrrolidone Industry Revenue (Million), by Country 2024 & 2032
- Figure 12: Europe Polyvinylpyrrolidone Industry Volume (K Tons), by Country 2024 & 2032
- Figure 13: Europe Polyvinylpyrrolidone Industry Revenue Share (%), by Country 2024 & 2032
- Figure 14: Europe Polyvinylpyrrolidone Industry Volume Share (%), by Country 2024 & 2032
- Figure 15: South America Polyvinylpyrrolidone Industry Revenue (Million), by Country 2024 & 2032
- Figure 16: South America Polyvinylpyrrolidone Industry Volume (K Tons), by Country 2024 & 2032
- Figure 17: South America Polyvinylpyrrolidone Industry Revenue Share (%), by Country 2024 & 2032
- Figure 18: South America Polyvinylpyrrolidone Industry Volume Share (%), by Country 2024 & 2032
- Figure 19: Middle East and Africa Polyvinylpyrrolidone Industry Revenue (Million), by Country 2024 & 2032
- Figure 20: Middle East and Africa Polyvinylpyrrolidone Industry Volume (K Tons), by Country 2024 & 2032
- Figure 21: Middle East and Africa Polyvinylpyrrolidone Industry Revenue Share (%), by Country 2024 & 2032
- Figure 22: Middle East and Africa Polyvinylpyrrolidone Industry Volume Share (%), by Country 2024 & 2032
- Figure 23: Asia Pacific Polyvinylpyrrolidone Industry Revenue (Million), by Form 2024 & 2032
- Figure 24: Asia Pacific Polyvinylpyrrolidone Industry Volume (K Tons), by Form 2024 & 2032
- Figure 25: Asia Pacific Polyvinylpyrrolidone Industry Revenue Share (%), by Form 2024 & 2032
- Figure 26: Asia Pacific Polyvinylpyrrolidone Industry Volume Share (%), by Form 2024 & 2032
- Figure 27: Asia Pacific Polyvinylpyrrolidone Industry Revenue (Million), by Application 2024 & 2032
- Figure 28: Asia Pacific Polyvinylpyrrolidone Industry Volume (K Tons), by Application 2024 & 2032
- Figure 29: Asia Pacific Polyvinylpyrrolidone Industry Revenue Share (%), by Application 2024 & 2032
- Figure 30: Asia Pacific Polyvinylpyrrolidone Industry Volume Share (%), by Application 2024 & 2032
- Figure 31: Asia Pacific Polyvinylpyrrolidone Industry Revenue (Million), by Country 2024 & 2032
- Figure 32: Asia Pacific Polyvinylpyrrolidone Industry Volume (K Tons), by Country 2024 & 2032
- Figure 33: Asia Pacific Polyvinylpyrrolidone Industry Revenue Share (%), by Country 2024 & 2032
- Figure 34: Asia Pacific Polyvinylpyrrolidone Industry Volume Share (%), by Country 2024 & 2032
- Figure 35: North America Polyvinylpyrrolidone Industry Revenue (Million), by Form 2024 & 2032
- Figure 36: North America Polyvinylpyrrolidone Industry Volume (K Tons), by Form 2024 & 2032
- Figure 37: North America Polyvinylpyrrolidone Industry Revenue Share (%), by Form 2024 & 2032
- Figure 38: North America Polyvinylpyrrolidone Industry Volume Share (%), by Form 2024 & 2032
- Figure 39: North America Polyvinylpyrrolidone Industry Revenue (Million), by Application 2024 & 2032
- Figure 40: North America Polyvinylpyrrolidone Industry Volume (K Tons), by Application 2024 & 2032
- Figure 41: North America Polyvinylpyrrolidone Industry Revenue Share (%), by Application 2024 & 2032
- Figure 42: North America Polyvinylpyrrolidone Industry Volume Share (%), by Application 2024 & 2032
- Figure 43: North America Polyvinylpyrrolidone Industry Revenue (Million), by Country 2024 & 2032
- Figure 44: North America Polyvinylpyrrolidone Industry Volume (K Tons), by Country 2024 & 2032
- Figure 45: North America Polyvinylpyrrolidone Industry Revenue Share (%), by Country 2024 & 2032
- Figure 46: North America Polyvinylpyrrolidone Industry Volume Share (%), by Country 2024 & 2032
- Figure 47: Europe Polyvinylpyrrolidone Industry Revenue (Million), by Form 2024 & 2032
- Figure 48: Europe Polyvinylpyrrolidone Industry Volume (K Tons), by Form 2024 & 2032
- Figure 49: Europe Polyvinylpyrrolidone Industry Revenue Share (%), by Form 2024 & 2032
- Figure 50: Europe Polyvinylpyrrolidone Industry Volume Share (%), by Form 2024 & 2032
- Figure 51: Europe Polyvinylpyrrolidone Industry Revenue (Million), by Application 2024 & 2032
- Figure 52: Europe Polyvinylpyrrolidone Industry Volume (K Tons), by Application 2024 & 2032
- Figure 53: Europe Polyvinylpyrrolidone Industry Revenue Share (%), by Application 2024 & 2032
- Figure 54: Europe Polyvinylpyrrolidone Industry Volume Share (%), by Application 2024 & 2032
- Figure 55: Europe Polyvinylpyrrolidone Industry Revenue (Million), by Country 2024 & 2032
- Figure 56: Europe Polyvinylpyrrolidone Industry Volume (K Tons), by Country 2024 & 2032
- Figure 57: Europe Polyvinylpyrrolidone Industry Revenue Share (%), by Country 2024 & 2032
- Figure 58: Europe Polyvinylpyrrolidone Industry Volume Share (%), by Country 2024 & 2032
- Figure 59: South America Polyvinylpyrrolidone Industry Revenue (Million), by Form 2024 & 2032
- Figure 60: South America Polyvinylpyrrolidone Industry Volume (K Tons), by Form 2024 & 2032
- Figure 61: South America Polyvinylpyrrolidone Industry Revenue Share (%), by Form 2024 & 2032
- Figure 62: South America Polyvinylpyrrolidone Industry Volume Share (%), by Form 2024 & 2032
- Figure 63: South America Polyvinylpyrrolidone Industry Revenue (Million), by Application 2024 & 2032
- Figure 64: South America Polyvinylpyrrolidone Industry Volume (K Tons), by Application 2024 & 2032
- Figure 65: South America Polyvinylpyrrolidone Industry Revenue Share (%), by Application 2024 & 2032
- Figure 66: South America Polyvinylpyrrolidone Industry Volume Share (%), by Application 2024 & 2032
- Figure 67: South America Polyvinylpyrrolidone Industry Revenue (Million), by Country 2024 & 2032
- Figure 68: South America Polyvinylpyrrolidone Industry Volume (K Tons), by Country 2024 & 2032
- Figure 69: South America Polyvinylpyrrolidone Industry Revenue Share (%), by Country 2024 & 2032
- Figure 70: South America Polyvinylpyrrolidone Industry Volume Share (%), by Country 2024 & 2032
- Figure 71: Middle East and Africa Polyvinylpyrrolidone Industry Revenue (Million), by Form 2024 & 2032
- Figure 72: Middle East and Africa Polyvinylpyrrolidone Industry Volume (K Tons), by Form 2024 & 2032
- Figure 73: Middle East and Africa Polyvinylpyrrolidone Industry Revenue Share (%), by Form 2024 & 2032
- Figure 74: Middle East and Africa Polyvinylpyrrolidone Industry Volume Share (%), by Form 2024 & 2032
- Figure 75: Middle East and Africa Polyvinylpyrrolidone Industry Revenue (Million), by Application 2024 & 2032
- Figure 76: Middle East and Africa Polyvinylpyrrolidone Industry Volume (K Tons), by Application 2024 & 2032
- Figure 77: Middle East and Africa Polyvinylpyrrolidone Industry Revenue Share (%), by Application 2024 & 2032
- Figure 78: Middle East and Africa Polyvinylpyrrolidone Industry Volume Share (%), by Application 2024 & 2032
- Figure 79: Middle East and Africa Polyvinylpyrrolidone Industry Revenue (Million), by Country 2024 & 2032
- Figure 80: Middle East and Africa Polyvinylpyrrolidone Industry Volume (K Tons), by Country 2024 & 2032
- Figure 81: Middle East and Africa Polyvinylpyrrolidone Industry Revenue Share (%), by Country 2024 & 2032
- Figure 82: Middle East and Africa Polyvinylpyrrolidone Industry Volume Share (%), by Country 2024 & 2032
List of Tables
- Table 1: Global Polyvinylpyrrolidone Industry Revenue Million Forecast, by Region 2019 & 2032
- Table 2: Global Polyvinylpyrrolidone Industry Volume K Tons Forecast, by Region 2019 & 2032
- Table 3: Global Polyvinylpyrrolidone Industry Revenue Million Forecast, by Form 2019 & 2032
- Table 4: Global Polyvinylpyrrolidone Industry Volume K Tons Forecast, by Form 2019 & 2032
- Table 5: Global Polyvinylpyrrolidone Industry Revenue Million Forecast, by Application 2019 & 2032
- Table 6: Global Polyvinylpyrrolidone Industry Volume K Tons Forecast, by Application 2019 & 2032
- Table 7: Global Polyvinylpyrrolidone Industry Revenue Million Forecast, by Region 2019 & 2032
- Table 8: Global Polyvinylpyrrolidone Industry Volume K Tons Forecast, by Region 2019 & 2032
- Table 9: Global Polyvinylpyrrolidone Industry Revenue Million Forecast, by Country 2019 & 2032
- Table 10: Global Polyvinylpyrrolidone Industry Volume K Tons Forecast, by Country 2019 & 2032
- Table 11: China Polyvinylpyrrolidone Industry Revenue (Million) Forecast, by Application 2019 & 2032
- Table 12: China Polyvinylpyrrolidone Industry Volume (K Tons) Forecast, by Application 2019 & 2032
- Table 13: India Polyvinylpyrrolidone Industry Revenue (Million) Forecast, by Application 2019 & 2032
- Table 14: India Polyvinylpyrrolidone Industry Volume (K Tons) Forecast, by Application 2019 & 2032
- Table 15: Japan Polyvinylpyrrolidone Industry Revenue (Million) Forecast, by Application 2019 & 2032
- Table 16: Japan Polyvinylpyrrolidone Industry Volume (K Tons) Forecast, by Application 2019 & 2032
- Table 17: Rest of Asia Pacific Polyvinylpyrrolidone Industry Revenue (Million) Forecast, by Application 2019 & 2032
- Table 18: Rest of Asia Pacific Polyvinylpyrrolidone Industry Volume (K Tons) Forecast, by Application 2019 & 2032
- Table 19: Global Polyvinylpyrrolidone Industry Revenue Million Forecast, by Country 2019 & 2032
- Table 20: Global Polyvinylpyrrolidone Industry Volume K Tons Forecast, by Country 2019 & 2032
- Table 21: United States Polyvinylpyrrolidone Industry Revenue (Million) Forecast, by Application 2019 & 2032
- Table 22: United States Polyvinylpyrrolidone Industry Volume (K Tons) Forecast, by Application 2019 & 2032
- Table 23: Canada Polyvinylpyrrolidone Industry Revenue (Million) Forecast, by Application 2019 & 2032
- Table 24: Canada Polyvinylpyrrolidone Industry Volume (K Tons) Forecast, by Application 2019 & 2032
- Table 25: Mexico Polyvinylpyrrolidone Industry Revenue (Million) Forecast, by Application 2019 & 2032
- Table 26: Mexico Polyvinylpyrrolidone Industry Volume (K Tons) Forecast, by Application 2019 & 2032
- Table 27: Global Polyvinylpyrrolidone Industry Revenue Million Forecast, by Country 2019 & 2032
- Table 28: Global Polyvinylpyrrolidone Industry Volume K Tons Forecast, by Country 2019 & 2032
- Table 29: Germany Polyvinylpyrrolidone Industry Revenue (Million) Forecast, by Application 2019 & 2032
- Table 30: Germany Polyvinylpyrrolidone Industry Volume (K Tons) Forecast, by Application 2019 & 2032
- Table 31: United Kingdom Polyvinylpyrrolidone Industry Revenue (Million) Forecast, by Application 2019 & 2032
- Table 32: United Kingdom Polyvinylpyrrolidone Industry Volume (K Tons) Forecast, by Application 2019 & 2032
- Table 33: Italy Polyvinylpyrrolidone Industry Revenue (Million) Forecast, by Application 2019 & 2032
- Table 34: Italy Polyvinylpyrrolidone Industry Volume (K Tons) Forecast, by Application 2019 & 2032
- Table 35: France Polyvinylpyrrolidone Industry Revenue (Million) Forecast, by Application 2019 & 2032
- Table 36: France Polyvinylpyrrolidone Industry Volume (K Tons) Forecast, by Application 2019 & 2032
- Table 37: Rest of Europe Polyvinylpyrrolidone Industry Revenue (Million) Forecast, by Application 2019 & 2032
- Table 38: Rest of Europe Polyvinylpyrrolidone Industry Volume (K Tons) Forecast, by Application 2019 & 2032
- Table 39: Global Polyvinylpyrrolidone Industry Revenue Million Forecast, by Country 2019 & 2032
- Table 40: Global Polyvinylpyrrolidone Industry Volume K Tons Forecast, by Country 2019 & 2032
- Table 41: Brazil Polyvinylpyrrolidone Industry Revenue (Million) Forecast, by Application 2019 & 2032
- Table 42: Brazil Polyvinylpyrrolidone Industry Volume (K Tons) Forecast, by Application 2019 & 2032
- Table 43: Argentina Polyvinylpyrrolidone Industry Revenue (Million) Forecast, by Application 2019 & 2032
- Table 44: Argentina Polyvinylpyrrolidone Industry Volume (K Tons) Forecast, by Application 2019 & 2032
- Table 45: Rest of South America Polyvinylpyrrolidone Industry Revenue (Million) Forecast, by Application 2019 & 2032
- Table 46: Rest of South America Polyvinylpyrrolidone Industry Volume (K Tons) Forecast, by Application 2019 & 2032
- Table 47: Global Polyvinylpyrrolidone Industry Revenue Million Forecast, by Country 2019 & 2032
- Table 48: Global Polyvinylpyrrolidone Industry Volume K Tons Forecast, by Country 2019 & 2032
- Table 49: Saudi Arabia Polyvinylpyrrolidone Industry Revenue (Million) Forecast, by Application 2019 & 2032
- Table 50: Saudi Arabia Polyvinylpyrrolidone Industry Volume (K Tons) Forecast, by Application 2019 & 2032
- Table 51: South Africa Polyvinylpyrrolidone Industry Revenue (Million) Forecast, by Application 2019 & 2032
- Table 52: South Africa Polyvinylpyrrolidone Industry Volume (K Tons) Forecast, by Application 2019 & 2032
- Table 53: Rest of Middle East and Africa Polyvinylpyrrolidone Industry Revenue (Million) Forecast, by Application 2019 & 2032
- Table 54: Rest of Middle East and Africa Polyvinylpyrrolidone Industry Volume (K Tons) Forecast, by Application 2019 & 2032
- Table 55: Global Polyvinylpyrrolidone Industry Revenue Million Forecast, by Form 2019 & 2032
- Table 56: Global Polyvinylpyrrolidone Industry Volume K Tons Forecast, by Form 2019 & 2032
- Table 57: Global Polyvinylpyrrolidone Industry Revenue Million Forecast, by Application 2019 & 2032
- Table 58: Global Polyvinylpyrrolidone Industry Volume K Tons Forecast, by Application 2019 & 2032
- Table 59: Global Polyvinylpyrrolidone Industry Revenue Million Forecast, by Country 2019 & 2032
- Table 60: Global Polyvinylpyrrolidone Industry Volume K Tons Forecast, by Country 2019 & 2032
- Table 61: China Polyvinylpyrrolidone Industry Revenue (Million) Forecast, by Application 2019 & 2032
- Table 62: China Polyvinylpyrrolidone Industry Volume (K Tons) Forecast, by Application 2019 & 2032
- Table 63: India Polyvinylpyrrolidone Industry Revenue (Million) Forecast, by Application 2019 & 2032
- Table 64: India Polyvinylpyrrolidone Industry Volume (K Tons) Forecast, by Application 2019 & 2032
- Table 65: Japan Polyvinylpyrrolidone Industry Revenue (Million) Forecast, by Application 2019 & 2032
- Table 66: Japan Polyvinylpyrrolidone Industry Volume (K Tons) Forecast, by Application 2019 & 2032
- Table 67: South Korea Polyvinylpyrrolidone Industry Revenue (Million) Forecast, by Application 2019 & 2032
- Table 68: South Korea Polyvinylpyrrolidone Industry Volume (K Tons) Forecast, by Application 2019 & 2032
- Table 69: Southeast Asia Polyvinylpyrrolidone Industry Revenue (Million) Forecast, by Application 2019 & 2032
- Table 70: Southeast Asia Polyvinylpyrrolidone Industry Volume (K Tons) Forecast, by Application 2019 & 2032
- Table 71: Australia Polyvinylpyrrolidone Industry Revenue (Million) Forecast, by Application 2019 & 2032
- Table 72: Australia Polyvinylpyrrolidone Industry Volume (K Tons) Forecast, by Application 2019 & 2032
- Table 73: Rest of Asia Pacific Polyvinylpyrrolidone Industry Revenue (Million) Forecast, by Application 2019 & 2032
- Table 74: Rest of Asia Pacific Polyvinylpyrrolidone Industry Volume (K Tons) Forecast, by Application 2019 & 2032
- Table 75: Global Polyvinylpyrrolidone Industry Revenue Million Forecast, by Form 2019 & 2032
- Table 76: Global Polyvinylpyrrolidone Industry Volume K Tons Forecast, by Form 2019 & 2032
- Table 77: Global Polyvinylpyrrolidone Industry Revenue Million Forecast, by Application 2019 & 2032
- Table 78: Global Polyvinylpyrrolidone Industry Volume K Tons Forecast, by Application 2019 & 2032
- Table 79: Global Polyvinylpyrrolidone Industry Revenue Million Forecast, by Country 2019 & 2032
- Table 80: Global Polyvinylpyrrolidone Industry Volume K Tons Forecast, by Country 2019 & 2032
- Table 81: United States Polyvinylpyrrolidone Industry Revenue (Million) Forecast, by Application 2019 & 2032
- Table 82: United States Polyvinylpyrrolidone Industry Volume (K Tons) Forecast, by Application 2019 & 2032
- Table 83: Canada Polyvinylpyrrolidone Industry Revenue (Million) Forecast, by Application 2019 & 2032
- Table 84: Canada Polyvinylpyrrolidone Industry Volume (K Tons) Forecast, by Application 2019 & 2032
- Table 85: Mexico Polyvinylpyrrolidone Industry Revenue (Million) Forecast, by Application 2019 & 2032
- Table 86: Mexico Polyvinylpyrrolidone Industry Volume (K Tons) Forecast, by Application 2019 & 2032
- Table 87: Global Polyvinylpyrrolidone Industry Revenue Million Forecast, by Form 2019 & 2032
- Table 88: Global Polyvinylpyrrolidone Industry Volume K Tons Forecast, by Form 2019 & 2032
- Table 89: Global Polyvinylpyrrolidone Industry Revenue Million Forecast, by Application 2019 & 2032
- Table 90: Global Polyvinylpyrrolidone Industry Volume K Tons Forecast, by Application 2019 & 2032
- Table 91: Global Polyvinylpyrrolidone Industry Revenue Million Forecast, by Country 2019 & 2032
- Table 92: Global Polyvinylpyrrolidone Industry Volume K Tons Forecast, by Country 2019 & 2032
- Table 93: Germany Polyvinylpyrrolidone Industry Revenue (Million) Forecast, by Application 2019 & 2032
- Table 94: Germany Polyvinylpyrrolidone Industry Volume (K Tons) Forecast, by Application 2019 & 2032
- Table 95: United Kingdom Polyvinylpyrrolidone Industry Revenue (Million) Forecast, by Application 2019 & 2032
- Table 96: United Kingdom Polyvinylpyrrolidone Industry Volume (K Tons) Forecast, by Application 2019 & 2032
- Table 97: Italy Polyvinylpyrrolidone Industry Revenue (Million) Forecast, by Application 2019 & 2032
- Table 98: Italy Polyvinylpyrrolidone Industry Volume (K Tons) Forecast, by Application 2019 & 2032
- Table 99: France Polyvinylpyrrolidone Industry Revenue (Million) Forecast, by Application 2019 & 2032
- Table 100: France Polyvinylpyrrolidone Industry Volume (K Tons) Forecast, by Application 2019 & 2032
- Table 101: Spain Polyvinylpyrrolidone Industry Revenue (Million) Forecast, by Application 2019 & 2032
- Table 102: Spain Polyvinylpyrrolidone Industry Volume (K Tons) Forecast, by Application 2019 & 2032
- Table 103: Rest of Europe Polyvinylpyrrolidone Industry Revenue (Million) Forecast, by Application 2019 & 2032
- Table 104: Rest of Europe Polyvinylpyrrolidone Industry Volume (K Tons) Forecast, by Application 2019 & 2032
- Table 105: Global Polyvinylpyrrolidone Industry Revenue Million Forecast, by Form 2019 & 2032
- Table 106: Global Polyvinylpyrrolidone Industry Volume K Tons Forecast, by Form 2019 & 2032
- Table 107: Global Polyvinylpyrrolidone Industry Revenue Million Forecast, by Application 2019 & 2032
- Table 108: Global Polyvinylpyrrolidone Industry Volume K Tons Forecast, by Application 2019 & 2032
- Table 109: Global Polyvinylpyrrolidone Industry Revenue Million Forecast, by Country 2019 & 2032
- Table 110: Global Polyvinylpyrrolidone Industry Volume K Tons Forecast, by Country 2019 & 2032
- Table 111: Brazil Polyvinylpyrrolidone Industry Revenue (Million) Forecast, by Application 2019 & 2032
- Table 112: Brazil Polyvinylpyrrolidone Industry Volume (K Tons) Forecast, by Application 2019 & 2032
- Table 113: Argentina Polyvinylpyrrolidone Industry Revenue (Million) Forecast, by Application 2019 & 2032
- Table 114: Argentina Polyvinylpyrrolidone Industry Volume (K Tons) Forecast, by Application 2019 & 2032
- Table 115: Rest of South America Polyvinylpyrrolidone Industry Revenue (Million) Forecast, by Application 2019 & 2032
- Table 116: Rest of South America Polyvinylpyrrolidone Industry Volume (K Tons) Forecast, by Application 2019 & 2032
- Table 117: Global Polyvinylpyrrolidone Industry Revenue Million Forecast, by Form 2019 & 2032
- Table 118: Global Polyvinylpyrrolidone Industry Volume K Tons Forecast, by Form 2019 & 2032
- Table 119: Global Polyvinylpyrrolidone Industry Revenue Million Forecast, by Application 2019 & 2032
- Table 120: Global Polyvinylpyrrolidone Industry Volume K Tons Forecast, by Application 2019 & 2032
- Table 121: Global Polyvinylpyrrolidone Industry Revenue Million Forecast, by Country 2019 & 2032
- Table 122: Global Polyvinylpyrrolidone Industry Volume K Tons Forecast, by Country 2019 & 2032
- Table 123: Saudi Arabia Polyvinylpyrrolidone Industry Revenue (Million) Forecast, by Application 2019 & 2032
- Table 124: Saudi Arabia Polyvinylpyrrolidone Industry Volume (K Tons) Forecast, by Application 2019 & 2032
- Table 125: South Africa Polyvinylpyrrolidone Industry Revenue (Million) Forecast, by Application 2019 & 2032
- Table 126: South Africa Polyvinylpyrrolidone Industry Volume (K Tons) Forecast, by Application 2019 & 2032
- Table 127: UAE Polyvinylpyrrolidone Industry Revenue (Million) Forecast, by Application 2019 & 2032
- Table 128: UAE Polyvinylpyrrolidone Industry Volume (K Tons) Forecast, by Application 2019 & 2032
- Table 129: Nigeria Polyvinylpyrrolidone Industry Revenue (Million) Forecast, by Application 2019 & 2032
- Table 130: Nigeria Polyvinylpyrrolidone Industry Volume (K Tons) Forecast, by Application 2019 & 2032
- Table 131: Rest of MEA Polyvinylpyrrolidone Industry Revenue (Million) Forecast, by Application 2019 & 2032
- Table 132: Rest of MEA Polyvinylpyrrolidone Industry Volume (K Tons) Forecast, by Application 2019 & 2032
Frequently Asked Questions
1. What is the projected Compound Annual Growth Rate (CAGR) of the Polyvinylpyrrolidone Industry?
The projected CAGR is approximately > 8.00%.
2. Which companies are prominent players in the Polyvinylpyrrolidone Industry?
Key companies in the market include Shanghai Yuking Water Soluble Material Tech Co Ltd, Zhangzhou Huafu Chemical Co Ltd, Sichuan Tianhua Chemical Group Co Ltd, Thermo Fisher Scientific Inc, Ashland, Glide Chem Private Limited, BASF SE, Hangzhou Motto Science & Technology Co Ltd, Boai NKY Pharmaceuticals Ltd, JH Nanhang Life Sciences Co Ltd, Nippon Shokubai Co Ltd, Shanghai Qifuqing Material Technology Co Ltd.
3. What are the main segments of the Polyvinylpyrrolidone Industry?
The market segments include Form, Application.
4. Can you provide details about the market size?
The market size is estimated to be USD XX Million as of 2022.
5. What are some drivers contributing to market growth?
Rising Demand in the Pharmaceutical Industry; Growing Application as Adhesives in the Construction Industry.
6. What are the notable trends driving market growth?
Rising Demand in the Pharmaceutical Industry.
7. Are there any restraints impacting market growth?
Presence of Substitutes.
8. Can you provide examples of recent developments in the market?
June 2022: Univar announced its distribution partnership with Boai Nky Pharmaceuticals in a bid to expand its European polymer products business, which includes various PVP and PVP/VI polymers, among others. With this move, Boai Nky Pharmaceuticals was expected to help assist customers with formulation development in the detergent segment.
9. What pricing options are available for accessing the report?
Pricing options include single-user, multi-user, and enterprise licenses priced at USD 4750, USD 5250, and USD 8750 respectively.
10. Is the market size provided in terms of value or volume?
The market size is provided in terms of value, measured in Million and volume, measured in K Tons.
11. Are there any specific market keywords associated with the report?
Yes, the market keyword associated with the report is "Polyvinylpyrrolidone Industry," which aids in identifying and referencing the specific market segment covered.
12. How do I determine which pricing option suits my needs best?
The pricing options vary based on user requirements and access needs. Individual users may opt for single-user licenses, while businesses requiring broader access may choose multi-user or enterprise licenses for cost-effective access to the report.
13. Are there any additional resources or data provided in the Polyvinylpyrrolidone Industry report?
While the report offers comprehensive insights, it's advisable to review the specific contents or supplementary materials provided to ascertain if additional resources or data are available.
14. How can I stay updated on further developments or reports in the Polyvinylpyrrolidone Industry?
To stay informed about further developments, trends, and reports in the Polyvinylpyrrolidone Industry, consider subscribing to industry newsletters, following relevant companies and organizations, or regularly checking reputable industry news sources and publications.
Methodology
Step 1 - Identification of Relevant Samples Size from Population Database


Step 2 - Approaches for Defining Global Market Size (Value, Volume* & Price*)

Note*: In applicable scenarios
Step 3 - Data Sources
Primary Research
- Web Analytics
- Survey Reports
- Research Institute
- Latest Research Reports
- Opinion Leaders
Secondary Research
- Annual Reports
- White Paper
- Latest Press Release
- Industry Association
- Paid Database
- Investor Presentations

Step 4 - Data Triangulation
Involves using different sources of information in order to increase the validity of a study
These sources are likely to be stakeholders in a program - participants, other researchers, program staff, other community members, and so on.
Then we put all data in single framework & apply various statistical tools to find out the dynamic on the market.
During the analysis stage, feedback from the stakeholder groups would be compared to determine areas of agreement as well as areas of divergence


