
Key Insights
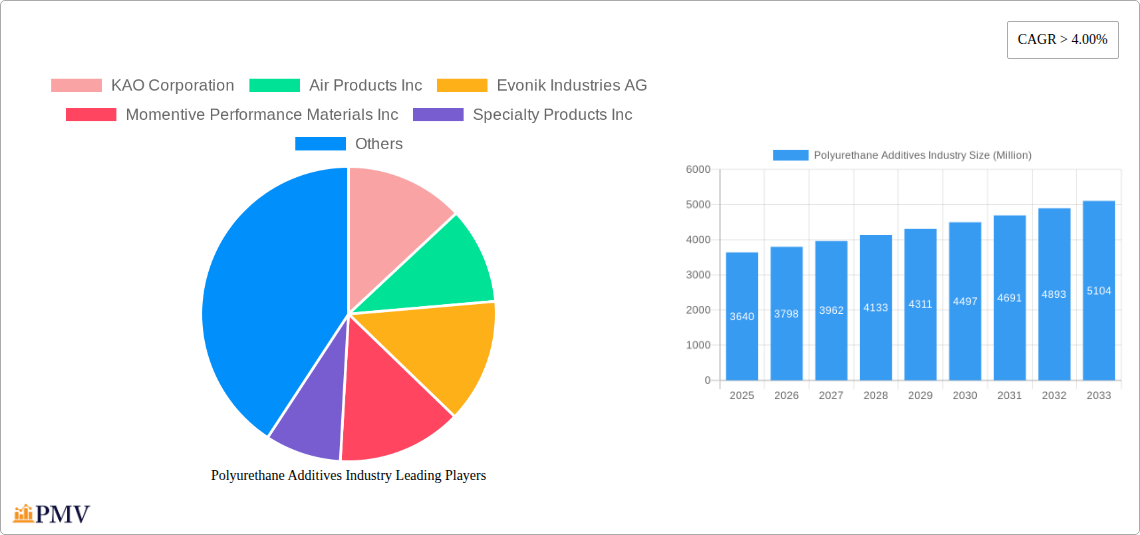
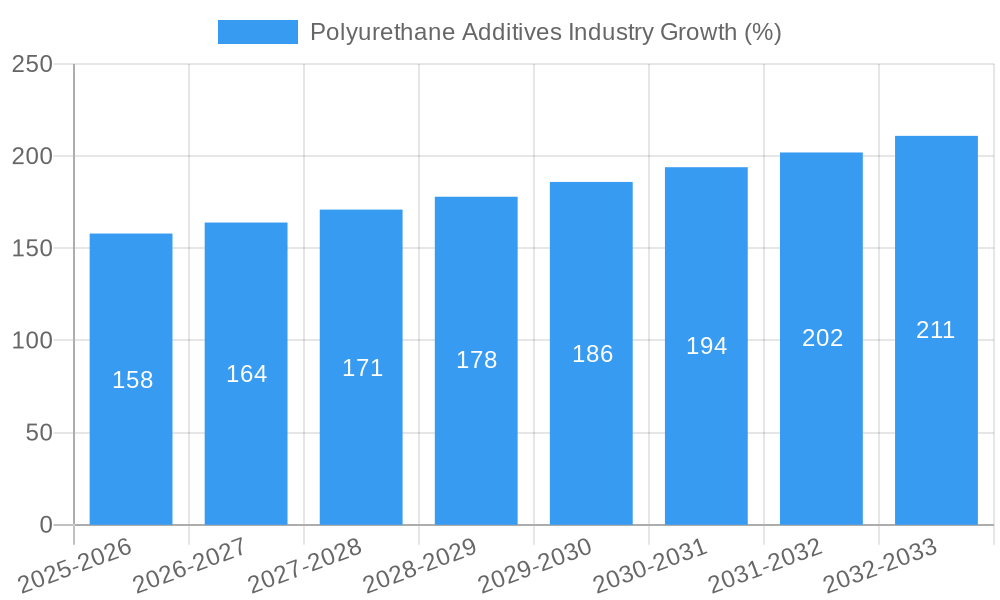
The global polyurethane additives market, valued at $3.64 billion in 2025, is projected to experience robust growth, exceeding a 4% compound annual growth rate (CAGR) through 2033. This expansion is driven by several key factors. The burgeoning construction industry, fueled by infrastructure development and rising urbanization globally, significantly boosts demand for polyurethane foams in insulation and construction applications. Simultaneously, the automotive sector's increasing adoption of lightweight materials, including polyurethane components, further fuels market growth. Advancements in polyurethane technology, leading to the development of more sustainable and high-performance additives, also contribute to market expansion. Specifically, the rising demand for flame-retardant additives driven by stringent safety regulations in various industries is a major growth catalyst. Furthermore, the growing focus on energy efficiency, particularly in building insulation, is stimulating the adoption of polyurethane-based solutions. The increasing demand for flexible molded foams in various applications, including bedding and furniture, also presents significant growth opportunities.
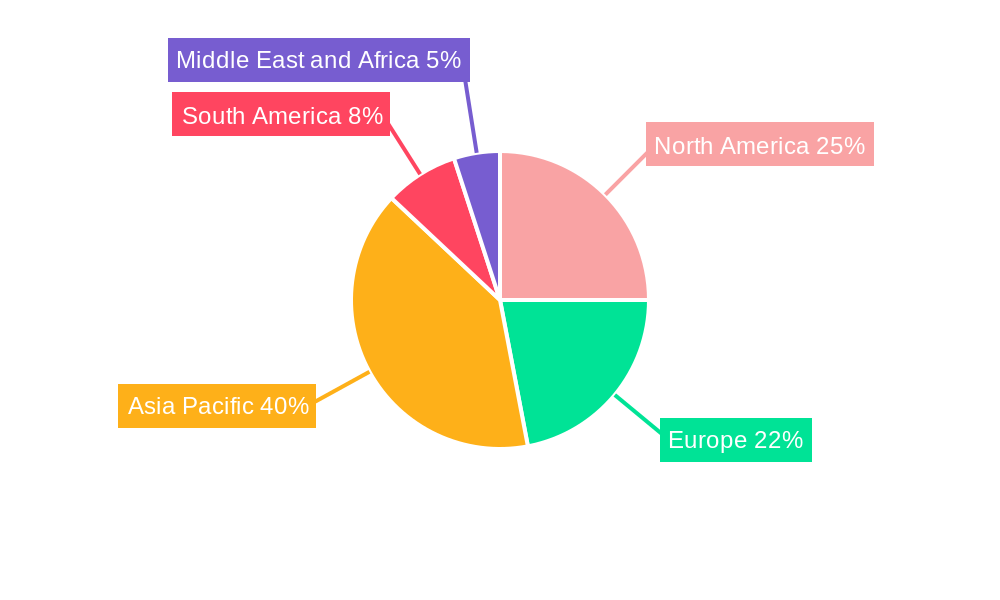
Regional variations exist, with the Asia-Pacific region, particularly China and India, expected to dominate the market due to rapid industrialization and urbanization. However, North America and Europe remain significant markets, driven by established manufacturing bases and stringent environmental regulations. Market segmentation reveals that blowing agents constitute a substantial portion of the market share, followed by catalysts and flame retardants. The adhesives and sealants application segment also enjoys significant growth due to its wide-ranging applications in construction, automotive, and other industries. Competitive dynamics are shaped by the presence of major players like BASF, Dow, and Huntsman, among others, who continuously invest in research and development to innovate and expand their product portfolios. Despite challenges such as fluctuating raw material prices and environmental concerns surrounding some polyurethane additives, the overall market outlook remains positive, propelled by the aforementioned growth drivers.
Polyurethane Additives Industry Market Report: 2019-2033
This comprehensive report provides a detailed analysis of the Polyurethane Additives market, offering invaluable insights for industry stakeholders, investors, and researchers. Covering the period 2019-2033, with a base year of 2025 and a forecast period of 2025-2033, this report unveils the market's structure, competitive dynamics, dominant segments, and future growth potential. The global market size in 2025 is estimated at xx Million, and is projected to reach xx Million by 2033, exhibiting a CAGR of xx%.
Polyurethane Additives Industry Market Structure & Competitive Dynamics
The polyurethane additives market is characterized by a moderately concentrated structure, with several multinational corporations holding significant market share. Key players such as BASF SE, Dow, Huntsman International LLC, and Covestro AG compete intensely, driving innovation and influencing pricing strategies. The market exhibits a dynamic competitive landscape shaped by mergers and acquisitions (M&A) activity, strategic partnerships, and the ongoing development of innovative additives. For instance, the July 2023 acquisition of Specialty Products Inc. by Everchem Specialty Chemicals highlights the consolidation trend within the industry. The deal value for this acquisition was xx Million, signaling a significant investment in expanding the polyurethane additive market. This dynamic landscape influences market share, with the top 5 players holding an estimated xx% of the global market in 2025. Regulatory frameworks, particularly concerning environmental regulations and safety standards for chemical additives, significantly impact market dynamics and product development. The industry is also witnessing increasing pressure to adopt sustainable practices, pushing companies to develop bio-based and recycled alternatives. Substitute materials, such as alternative foaming agents and cross-linking technologies, pose a competitive threat, while end-user trends toward lightweighting and high-performance materials are driving innovation.
- Market Concentration: Moderately concentrated, with top 5 players holding approximately xx% market share in 2025.
- Innovation Ecosystems: Strong collaboration between chemical manufacturers and end-users drives innovation.
- Regulatory Frameworks: Stringent environmental regulations and safety standards influence product development.
- Product Substitutes: Alternative foaming agents and cross-linking technologies present competitive challenges.
- End-User Trends: Demand for lightweight and high-performance materials drives market growth.
- M&A Activity: Significant M&A activity observed, with deals valuing xx Million shaping the market landscape.
Polyurethane Additives Industry Trends & Insights
The polyurethane additives market is experiencing robust growth, driven by factors including the increasing demand for polyurethane-based products across diverse end-use industries. The automotive industry's drive towards lightweighting, fueled by stringent fuel efficiency standards, is a key driver, along with construction and furniture sectors. Technological advancements, such as the development of bio-based additives and the adoption of advanced manufacturing processes, are boosting innovation and performance. Consumer preferences for sustainable and high-performance products influence the demand for eco-friendly polyurethane additives. Competitive dynamics, characterized by M&A activities and strategic alliances, further shape the market landscape. The global market is expected to witness significant expansion, driven by a rising CAGR of xx% over the forecast period, with substantial market penetration anticipated in developing economies. The rise of flexible polyurethane foams in applications like bedding and automotive interiors is also a substantial contributor to overall growth. Further, the increasing use of rigid polyurethane foams in construction and insulation is fueling demand for suitable additives. However, fluctuating raw material prices and environmental concerns regarding certain additives are potential market restraints.
Dominant Markets & Segments in Polyurethane Additives Industry
The polyurethane additives market is segmented by application (adhesives and sealants, coatings, flexible molded foams, rigid foams, other applications) and by type (blowing agents, catalysts, flame retardants, surfactants, other additives). Geographically, Asia Pacific is currently the dominant region, owing to its robust manufacturing sector and rising consumption of polyurethane-based products. Within the application segments, flexible molded foams hold significant market share due to its use in various consumer goods, while the rigid foam segment is experiencing growth due to its prevalence in construction and insulation materials. Among additive types, blowing agents currently capture the largest market share, followed by catalysts and flame retardants.
Key Drivers:
- Asia Pacific: Strong manufacturing base and rising demand for polyurethane products.
- Flexible Molded Foams: High demand from consumer goods and automotive sectors.
- Rigid Foams: Growth driven by increasing construction and insulation applications.
- Blowing Agents: Largest market share driven by the need for foam production.
Dominance Analysis:
The Asia Pacific region dominates due to its large manufacturing base and high growth in end-use industries. The flexible molded foam application segment maintains a strong position due to its diverse applications and continued innovation. Blowing agents remain the leading additive type, driven by their essential role in polyurethane foam production.
Polyurethane Additives Industry Product Innovations
Recent innovations in polyurethane additives focus on enhancing performance, sustainability, and processing efficiency. Manufacturers are developing bio-based additives to reduce environmental impact, while advancements in catalyst technology are improving processing speed and energy efficiency. The focus on creating lightweight materials, particularly in automotive and aerospace applications, is driving the development of additives that contribute to lower density foams while maintaining structural integrity. New flame retardants are emerging to meet stricter safety regulations. These innovations contribute to a competitive advantage by offering enhanced product performance, cost savings, and environmental benefits.
Report Segmentation & Scope
The report segments the polyurethane additives market by application: Adhesives and Sealants (xx Million in 2025, expected to reach xx Million by 2033, CAGR of xx%), Coatings (xx Million in 2025, expected to reach xx Million by 2033, CAGR of xx%), Flexible Molded Foams (xx Million in 2025, expected to reach xx Million by 2033, CAGR of xx%), Rigid Foams (xx Million in 2025, expected to reach xx Million by 2033, CAGR of xx%), and Other Applications (xx Million in 2025, expected to reach xx Million by 2033, CAGR of xx%). The market is further segmented by type: Blowing Agents (xx Million in 2025, expected to reach xx Million by 2033, CAGR of xx%), Catalysts (xx Million in 2025, expected to reach xx Million by 2033, CAGR of xx%), Flame Retardants (xx Million in 2025, expected to reach xx Million by 2033, CAGR of xx%), Surfactants (xx Million in 2025, expected to reach xx Million by 2033, CAGR of xx%), and Other Additives (xx Million in 2025, expected to reach xx Million by 2033, CAGR of xx%). Each segment's competitive dynamics are analyzed, along with individual growth projections and market size estimates.
Key Drivers of Polyurethane Additives Industry Growth
The polyurethane additives market growth is fueled by several key factors: the increasing demand for polyurethane-based products across various industries (automotive, construction, furniture); stringent fuel efficiency standards driving lightweighting in the automotive industry; the growing need for energy-efficient buildings and insulation materials increasing the demand for rigid foams; technological advancements in additive chemistry leading to improved performance and sustainability; and the ongoing development of bio-based and recycled alternatives contributing to the industry’s shift toward environmentally friendly practices. Government initiatives promoting sustainable materials further stimulate market expansion.
Challenges in the Polyurethane Additives Industry Sector
The polyurethane additives industry faces challenges including fluctuations in raw material prices impacting production costs; stringent environmental regulations and safety standards requiring investments in compliance measures and R&D; increasing competition from alternative materials and technologies, potentially hindering market share; and supply chain disruptions potentially leading to production delays and cost increases. The industry also faces pressure to reduce its carbon footprint and adopt more sustainable manufacturing practices. These factors may negatively impact market growth by xx% in certain scenarios.
Leading Players in the Polyurethane Additives Industry Market
- KAO Corporation
- Air Products Inc
- Evonik Industries AG
- Momentive Performance Materials Inc
- Specialty Products Inc
- BASF SE
- Huntsman International LLC
- GEO Specialty Chemicals Inc
- Dow
- Eastman Chemical Company
- Covestro AG
- Tosoh Corporation
Key Developments in Polyurethane Additives Industry Sector
- July 2023: Everchem Specialty Chemicals acquired Specialty Products Inc., expanding its presence in the polyurethane additives market.
- August 2023: Marelli and Covestro AG jointly developed a new lightweight polyurethane foam for automotive applications.
- September 2022: LANXESS launched bio-based raw materials for its LF urethane prepolymer range, promoting sustainability.
Strategic Polyurethane Additives Industry Market Outlook
The polyurethane additives market presents significant growth opportunities driven by the rising demand for polyurethane-based products across various sectors, technological advancements fostering innovation, and increasing focus on sustainable solutions. Strategic investments in research and development, particularly focusing on bio-based and recycled materials, will be crucial for companies to maintain a competitive edge. Expansion into emerging markets and strategic partnerships offer substantial growth potential. The overall outlook is positive, anticipating sustained market expansion over the forecast period.
Polyurethane Additives Industry Segmentation
-
1. Type
- 1.1. Blowing Agents
- 1.2. Catalysts
- 1.3. Flame Retardants
- 1.4. Surfactants
- 1.5. Other Ad
-
2. Application
- 2.1. Adhesives and Sealants
- 2.2. Coatings
- 2.3. Flexible Molded Foams
- 2.4. Rigid Foams
- 2.5. Other Ap
Polyurethane Additives Industry Segmentation By Geography
-
1. Asia Pacific
- 1.1. China
- 1.2. India
- 1.3. Japan
- 1.4. South Korea
- 1.5. ASEAN Countries
- 1.6. Rest of Asia Pacific
-
2. North America
- 2.1. United States
- 2.2. Canada
- 2.3. Mexico
-
3. Europe
- 3.1. Germany
- 3.2. United Kingdom
- 3.3. Italy
- 3.4. France
- 3.5. Rest of Europe
-
4. South America
- 4.1. Brazil
- 4.2. Argentina
- 4.3. Rest of South America
-
5. Middle East and Africa
- 5.1. Saudi Arabia
- 5.2. South Africa
- 5.3. Rest of Middle East and Africa
Polyurethane Additives Industry REPORT HIGHLIGHTS
| Aspects | Details |
|---|---|
| Study Period | 2019-2033 |
| Base Year | 2024 |
| Estimated Year | 2025 |
| Forecast Period | 2025-2033 |
| Historical Period | 2019-2024 |
| Growth Rate | CAGR of > 4.00% from 2019-2033 |
| Segmentation |
|
Table of Contents
- 1. Introduction
- 1.1. Research Scope
- 1.2. Market Segmentation
- 1.3. Research Methodology
- 1.4. Definitions and Assumptions
- 2. Executive Summary
- 2.1. Introduction
- 3. Market Dynamics
- 3.1. Introduction
- 3.2. Market Drivers
- 3.2.1. Rising Demand for Polyurethane in the Construction Industry; Increasing Demand from the Automotive Industry; Growing demand for sustainable Polyurethane products
- 3.3. Market Restrains
- 3.3.1. Availability of Alternative Additives; Stringent Government Regulations
- 3.4. Market Trends
- 3.4.1. Increasing Demand from the Automotive Industry
- 4. Market Factor Analysis
- 4.1. Porters Five Forces
- 4.2. Supply/Value Chain
- 4.3. PESTEL analysis
- 4.4. Market Entropy
- 4.5. Patent/Trademark Analysis
- 5. Global Polyurethane Additives Industry Analysis, Insights and Forecast, 2019-2031
- 5.1. Market Analysis, Insights and Forecast - by Type
- 5.1.1. Blowing Agents
- 5.1.2. Catalysts
- 5.1.3. Flame Retardants
- 5.1.4. Surfactants
- 5.1.5. Other Ad
- 5.2. Market Analysis, Insights and Forecast - by Application
- 5.2.1. Adhesives and Sealants
- 5.2.2. Coatings
- 5.2.3. Flexible Molded Foams
- 5.2.4. Rigid Foams
- 5.2.5. Other Ap
- 5.3. Market Analysis, Insights and Forecast - by Region
- 5.3.1. Asia Pacific
- 5.3.2. North America
- 5.3.3. Europe
- 5.3.4. South America
- 5.3.5. Middle East and Africa
- 5.1. Market Analysis, Insights and Forecast - by Type
- 6. Asia Pacific Polyurethane Additives Industry Analysis, Insights and Forecast, 2019-2031
- 6.1. Market Analysis, Insights and Forecast - by Type
- 6.1.1. Blowing Agents
- 6.1.2. Catalysts
- 6.1.3. Flame Retardants
- 6.1.4. Surfactants
- 6.1.5. Other Ad
- 6.2. Market Analysis, Insights and Forecast - by Application
- 6.2.1. Adhesives and Sealants
- 6.2.2. Coatings
- 6.2.3. Flexible Molded Foams
- 6.2.4. Rigid Foams
- 6.2.5. Other Ap
- 6.1. Market Analysis, Insights and Forecast - by Type
- 7. North America Polyurethane Additives Industry Analysis, Insights and Forecast, 2019-2031
- 7.1. Market Analysis, Insights and Forecast - by Type
- 7.1.1. Blowing Agents
- 7.1.2. Catalysts
- 7.1.3. Flame Retardants
- 7.1.4. Surfactants
- 7.1.5. Other Ad
- 7.2. Market Analysis, Insights and Forecast - by Application
- 7.2.1. Adhesives and Sealants
- 7.2.2. Coatings
- 7.2.3. Flexible Molded Foams
- 7.2.4. Rigid Foams
- 7.2.5. Other Ap
- 7.1. Market Analysis, Insights and Forecast - by Type
- 8. Europe Polyurethane Additives Industry Analysis, Insights and Forecast, 2019-2031
- 8.1. Market Analysis, Insights and Forecast - by Type
- 8.1.1. Blowing Agents
- 8.1.2. Catalysts
- 8.1.3. Flame Retardants
- 8.1.4. Surfactants
- 8.1.5. Other Ad
- 8.2. Market Analysis, Insights and Forecast - by Application
- 8.2.1. Adhesives and Sealants
- 8.2.2. Coatings
- 8.2.3. Flexible Molded Foams
- 8.2.4. Rigid Foams
- 8.2.5. Other Ap
- 8.1. Market Analysis, Insights and Forecast - by Type
- 9. South America Polyurethane Additives Industry Analysis, Insights and Forecast, 2019-2031
- 9.1. Market Analysis, Insights and Forecast - by Type
- 9.1.1. Blowing Agents
- 9.1.2. Catalysts
- 9.1.3. Flame Retardants
- 9.1.4. Surfactants
- 9.1.5. Other Ad
- 9.2. Market Analysis, Insights and Forecast - by Application
- 9.2.1. Adhesives and Sealants
- 9.2.2. Coatings
- 9.2.3. Flexible Molded Foams
- 9.2.4. Rigid Foams
- 9.2.5. Other Ap
- 9.1. Market Analysis, Insights and Forecast - by Type
- 10. Middle East and Africa Polyurethane Additives Industry Analysis, Insights and Forecast, 2019-2031
- 10.1. Market Analysis, Insights and Forecast - by Type
- 10.1.1. Blowing Agents
- 10.1.2. Catalysts
- 10.1.3. Flame Retardants
- 10.1.4. Surfactants
- 10.1.5. Other Ad
- 10.2. Market Analysis, Insights and Forecast - by Application
- 10.2.1. Adhesives and Sealants
- 10.2.2. Coatings
- 10.2.3. Flexible Molded Foams
- 10.2.4. Rigid Foams
- 10.2.5. Other Ap
- 10.1. Market Analysis, Insights and Forecast - by Type
- 11. Asia Pacific Polyurethane Additives Industry Analysis, Insights and Forecast, 2019-2031
- 11.1. Market Analysis, Insights and Forecast - By Country/Sub-region
- 11.1.1 China
- 11.1.2 India
- 11.1.3 Japan
- 11.1.4 South Korea
- 11.1.5 ASEAN Countries
- 11.1.6 Rest of Asia Pacific
- 12. North America Polyurethane Additives Industry Analysis, Insights and Forecast, 2019-2031
- 12.1. Market Analysis, Insights and Forecast - By Country/Sub-region
- 12.1.1 United States
- 12.1.2 Canada
- 12.1.3 Mexico
- 13. Europe Polyurethane Additives Industry Analysis, Insights and Forecast, 2019-2031
- 13.1. Market Analysis, Insights and Forecast - By Country/Sub-region
- 13.1.1 Germany
- 13.1.2 United Kingdom
- 13.1.3 Italy
- 13.1.4 France
- 13.1.5 Rest of Europe
- 14. South America Polyurethane Additives Industry Analysis, Insights and Forecast, 2019-2031
- 14.1. Market Analysis, Insights and Forecast - By Country/Sub-region
- 14.1.1 Brazil
- 14.1.2 Argentina
- 14.1.3 Rest of South America
- 15. Middle East and Africa Polyurethane Additives Industry Analysis, Insights and Forecast, 2019-2031
- 15.1. Market Analysis, Insights and Forecast - By Country/Sub-region
- 15.1.1 Saudi Arabia
- 15.1.2 South Africa
- 15.1.3 Rest of Middle East and Africa
- 16. Competitive Analysis
- 16.1. Global Market Share Analysis 2024
- 16.2. Company Profiles
- 16.2.1 KAO Corporation
- 16.2.1.1. Overview
- 16.2.1.2. Products
- 16.2.1.3. SWOT Analysis
- 16.2.1.4. Recent Developments
- 16.2.1.5. Financials (Based on Availability)
- 16.2.2 Air Products Inc
- 16.2.2.1. Overview
- 16.2.2.2. Products
- 16.2.2.3. SWOT Analysis
- 16.2.2.4. Recent Developments
- 16.2.2.5. Financials (Based on Availability)
- 16.2.3 Evonik Industries AG
- 16.2.3.1. Overview
- 16.2.3.2. Products
- 16.2.3.3. SWOT Analysis
- 16.2.3.4. Recent Developments
- 16.2.3.5. Financials (Based on Availability)
- 16.2.4 Momentive Performance Materials Inc
- 16.2.4.1. Overview
- 16.2.4.2. Products
- 16.2.4.3. SWOT Analysis
- 16.2.4.4. Recent Developments
- 16.2.4.5. Financials (Based on Availability)
- 16.2.5 Specialty Products Inc
- 16.2.5.1. Overview
- 16.2.5.2. Products
- 16.2.5.3. SWOT Analysis
- 16.2.5.4. Recent Developments
- 16.2.5.5. Financials (Based on Availability)
- 16.2.6 BASF SE
- 16.2.6.1. Overview
- 16.2.6.2. Products
- 16.2.6.3. SWOT Analysis
- 16.2.6.4. Recent Developments
- 16.2.6.5. Financials (Based on Availability)
- 16.2.7 Huntsman International LLC
- 16.2.7.1. Overview
- 16.2.7.2. Products
- 16.2.7.3. SWOT Analysis
- 16.2.7.4. Recent Developments
- 16.2.7.5. Financials (Based on Availability)
- 16.2.8 GEO Specialty Chemicals Inc
- 16.2.8.1. Overview
- 16.2.8.2. Products
- 16.2.8.3. SWOT Analysis
- 16.2.8.4. Recent Developments
- 16.2.8.5. Financials (Based on Availability)
- 16.2.9 Dow
- 16.2.9.1. Overview
- 16.2.9.2. Products
- 16.2.9.3. SWOT Analysis
- 16.2.9.4. Recent Developments
- 16.2.9.5. Financials (Based on Availability)
- 16.2.10 Eastman Chemical Company
- 16.2.10.1. Overview
- 16.2.10.2. Products
- 16.2.10.3. SWOT Analysis
- 16.2.10.4. Recent Developments
- 16.2.10.5. Financials (Based on Availability)
- 16.2.11 Covestro AG
- 16.2.11.1. Overview
- 16.2.11.2. Products
- 16.2.11.3. SWOT Analysis
- 16.2.11.4. Recent Developments
- 16.2.11.5. Financials (Based on Availability)
- 16.2.12 Tosoh Corporation*List Not Exhaustive
- 16.2.12.1. Overview
- 16.2.12.2. Products
- 16.2.12.3. SWOT Analysis
- 16.2.12.4. Recent Developments
- 16.2.12.5. Financials (Based on Availability)
- 16.2.1 KAO Corporation
List of Figures
- Figure 1: Global Polyurethane Additives Industry Revenue Breakdown (Million, %) by Region 2024 & 2032
- Figure 2: Global Polyurethane Additives Industry Volume Breakdown (K Tons, %) by Region 2024 & 2032
- Figure 3: Asia Pacific Polyurethane Additives Industry Revenue (Million), by Country 2024 & 2032
- Figure 4: Asia Pacific Polyurethane Additives Industry Volume (K Tons), by Country 2024 & 2032
- Figure 5: Asia Pacific Polyurethane Additives Industry Revenue Share (%), by Country 2024 & 2032
- Figure 6: Asia Pacific Polyurethane Additives Industry Volume Share (%), by Country 2024 & 2032
- Figure 7: North America Polyurethane Additives Industry Revenue (Million), by Country 2024 & 2032
- Figure 8: North America Polyurethane Additives Industry Volume (K Tons), by Country 2024 & 2032
- Figure 9: North America Polyurethane Additives Industry Revenue Share (%), by Country 2024 & 2032
- Figure 10: North America Polyurethane Additives Industry Volume Share (%), by Country 2024 & 2032
- Figure 11: Europe Polyurethane Additives Industry Revenue (Million), by Country 2024 & 2032
- Figure 12: Europe Polyurethane Additives Industry Volume (K Tons), by Country 2024 & 2032
- Figure 13: Europe Polyurethane Additives Industry Revenue Share (%), by Country 2024 & 2032
- Figure 14: Europe Polyurethane Additives Industry Volume Share (%), by Country 2024 & 2032
- Figure 15: South America Polyurethane Additives Industry Revenue (Million), by Country 2024 & 2032
- Figure 16: South America Polyurethane Additives Industry Volume (K Tons), by Country 2024 & 2032
- Figure 17: South America Polyurethane Additives Industry Revenue Share (%), by Country 2024 & 2032
- Figure 18: South America Polyurethane Additives Industry Volume Share (%), by Country 2024 & 2032
- Figure 19: Middle East and Africa Polyurethane Additives Industry Revenue (Million), by Country 2024 & 2032
- Figure 20: Middle East and Africa Polyurethane Additives Industry Volume (K Tons), by Country 2024 & 2032
- Figure 21: Middle East and Africa Polyurethane Additives Industry Revenue Share (%), by Country 2024 & 2032
- Figure 22: Middle East and Africa Polyurethane Additives Industry Volume Share (%), by Country 2024 & 2032
- Figure 23: Asia Pacific Polyurethane Additives Industry Revenue (Million), by Type 2024 & 2032
- Figure 24: Asia Pacific Polyurethane Additives Industry Volume (K Tons), by Type 2024 & 2032
- Figure 25: Asia Pacific Polyurethane Additives Industry Revenue Share (%), by Type 2024 & 2032
- Figure 26: Asia Pacific Polyurethane Additives Industry Volume Share (%), by Type 2024 & 2032
- Figure 27: Asia Pacific Polyurethane Additives Industry Revenue (Million), by Application 2024 & 2032
- Figure 28: Asia Pacific Polyurethane Additives Industry Volume (K Tons), by Application 2024 & 2032
- Figure 29: Asia Pacific Polyurethane Additives Industry Revenue Share (%), by Application 2024 & 2032
- Figure 30: Asia Pacific Polyurethane Additives Industry Volume Share (%), by Application 2024 & 2032
- Figure 31: Asia Pacific Polyurethane Additives Industry Revenue (Million), by Country 2024 & 2032
- Figure 32: Asia Pacific Polyurethane Additives Industry Volume (K Tons), by Country 2024 & 2032
- Figure 33: Asia Pacific Polyurethane Additives Industry Revenue Share (%), by Country 2024 & 2032
- Figure 34: Asia Pacific Polyurethane Additives Industry Volume Share (%), by Country 2024 & 2032
- Figure 35: North America Polyurethane Additives Industry Revenue (Million), by Type 2024 & 2032
- Figure 36: North America Polyurethane Additives Industry Volume (K Tons), by Type 2024 & 2032
- Figure 37: North America Polyurethane Additives Industry Revenue Share (%), by Type 2024 & 2032
- Figure 38: North America Polyurethane Additives Industry Volume Share (%), by Type 2024 & 2032
- Figure 39: North America Polyurethane Additives Industry Revenue (Million), by Application 2024 & 2032
- Figure 40: North America Polyurethane Additives Industry Volume (K Tons), by Application 2024 & 2032
- Figure 41: North America Polyurethane Additives Industry Revenue Share (%), by Application 2024 & 2032
- Figure 42: North America Polyurethane Additives Industry Volume Share (%), by Application 2024 & 2032
- Figure 43: North America Polyurethane Additives Industry Revenue (Million), by Country 2024 & 2032
- Figure 44: North America Polyurethane Additives Industry Volume (K Tons), by Country 2024 & 2032
- Figure 45: North America Polyurethane Additives Industry Revenue Share (%), by Country 2024 & 2032
- Figure 46: North America Polyurethane Additives Industry Volume Share (%), by Country 2024 & 2032
- Figure 47: Europe Polyurethane Additives Industry Revenue (Million), by Type 2024 & 2032
- Figure 48: Europe Polyurethane Additives Industry Volume (K Tons), by Type 2024 & 2032
- Figure 49: Europe Polyurethane Additives Industry Revenue Share (%), by Type 2024 & 2032
- Figure 50: Europe Polyurethane Additives Industry Volume Share (%), by Type 2024 & 2032
- Figure 51: Europe Polyurethane Additives Industry Revenue (Million), by Application 2024 & 2032
- Figure 52: Europe Polyurethane Additives Industry Volume (K Tons), by Application 2024 & 2032
- Figure 53: Europe Polyurethane Additives Industry Revenue Share (%), by Application 2024 & 2032
- Figure 54: Europe Polyurethane Additives Industry Volume Share (%), by Application 2024 & 2032
- Figure 55: Europe Polyurethane Additives Industry Revenue (Million), by Country 2024 & 2032
- Figure 56: Europe Polyurethane Additives Industry Volume (K Tons), by Country 2024 & 2032
- Figure 57: Europe Polyurethane Additives Industry Revenue Share (%), by Country 2024 & 2032
- Figure 58: Europe Polyurethane Additives Industry Volume Share (%), by Country 2024 & 2032
- Figure 59: South America Polyurethane Additives Industry Revenue (Million), by Type 2024 & 2032
- Figure 60: South America Polyurethane Additives Industry Volume (K Tons), by Type 2024 & 2032
- Figure 61: South America Polyurethane Additives Industry Revenue Share (%), by Type 2024 & 2032
- Figure 62: South America Polyurethane Additives Industry Volume Share (%), by Type 2024 & 2032
- Figure 63: South America Polyurethane Additives Industry Revenue (Million), by Application 2024 & 2032
- Figure 64: South America Polyurethane Additives Industry Volume (K Tons), by Application 2024 & 2032
- Figure 65: South America Polyurethane Additives Industry Revenue Share (%), by Application 2024 & 2032
- Figure 66: South America Polyurethane Additives Industry Volume Share (%), by Application 2024 & 2032
- Figure 67: South America Polyurethane Additives Industry Revenue (Million), by Country 2024 & 2032
- Figure 68: South America Polyurethane Additives Industry Volume (K Tons), by Country 2024 & 2032
- Figure 69: South America Polyurethane Additives Industry Revenue Share (%), by Country 2024 & 2032
- Figure 70: South America Polyurethane Additives Industry Volume Share (%), by Country 2024 & 2032
- Figure 71: Middle East and Africa Polyurethane Additives Industry Revenue (Million), by Type 2024 & 2032
- Figure 72: Middle East and Africa Polyurethane Additives Industry Volume (K Tons), by Type 2024 & 2032
- Figure 73: Middle East and Africa Polyurethane Additives Industry Revenue Share (%), by Type 2024 & 2032
- Figure 74: Middle East and Africa Polyurethane Additives Industry Volume Share (%), by Type 2024 & 2032
- Figure 75: Middle East and Africa Polyurethane Additives Industry Revenue (Million), by Application 2024 & 2032
- Figure 76: Middle East and Africa Polyurethane Additives Industry Volume (K Tons), by Application 2024 & 2032
- Figure 77: Middle East and Africa Polyurethane Additives Industry Revenue Share (%), by Application 2024 & 2032
- Figure 78: Middle East and Africa Polyurethane Additives Industry Volume Share (%), by Application 2024 & 2032
- Figure 79: Middle East and Africa Polyurethane Additives Industry Revenue (Million), by Country 2024 & 2032
- Figure 80: Middle East and Africa Polyurethane Additives Industry Volume (K Tons), by Country 2024 & 2032
- Figure 81: Middle East and Africa Polyurethane Additives Industry Revenue Share (%), by Country 2024 & 2032
- Figure 82: Middle East and Africa Polyurethane Additives Industry Volume Share (%), by Country 2024 & 2032
List of Tables
- Table 1: Global Polyurethane Additives Industry Revenue Million Forecast, by Region 2019 & 2032
- Table 2: Global Polyurethane Additives Industry Volume K Tons Forecast, by Region 2019 & 2032
- Table 3: Global Polyurethane Additives Industry Revenue Million Forecast, by Type 2019 & 2032
- Table 4: Global Polyurethane Additives Industry Volume K Tons Forecast, by Type 2019 & 2032
- Table 5: Global Polyurethane Additives Industry Revenue Million Forecast, by Application 2019 & 2032
- Table 6: Global Polyurethane Additives Industry Volume K Tons Forecast, by Application 2019 & 2032
- Table 7: Global Polyurethane Additives Industry Revenue Million Forecast, by Region 2019 & 2032
- Table 8: Global Polyurethane Additives Industry Volume K Tons Forecast, by Region 2019 & 2032
- Table 9: Global Polyurethane Additives Industry Revenue Million Forecast, by Country 2019 & 2032
- Table 10: Global Polyurethane Additives Industry Volume K Tons Forecast, by Country 2019 & 2032
- Table 11: China Polyurethane Additives Industry Revenue (Million) Forecast, by Application 2019 & 2032
- Table 12: China Polyurethane Additives Industry Volume (K Tons) Forecast, by Application 2019 & 2032
- Table 13: India Polyurethane Additives Industry Revenue (Million) Forecast, by Application 2019 & 2032
- Table 14: India Polyurethane Additives Industry Volume (K Tons) Forecast, by Application 2019 & 2032
- Table 15: Japan Polyurethane Additives Industry Revenue (Million) Forecast, by Application 2019 & 2032
- Table 16: Japan Polyurethane Additives Industry Volume (K Tons) Forecast, by Application 2019 & 2032
- Table 17: South Korea Polyurethane Additives Industry Revenue (Million) Forecast, by Application 2019 & 2032
- Table 18: South Korea Polyurethane Additives Industry Volume (K Tons) Forecast, by Application 2019 & 2032
- Table 19: ASEAN Countries Polyurethane Additives Industry Revenue (Million) Forecast, by Application 2019 & 2032
- Table 20: ASEAN Countries Polyurethane Additives Industry Volume (K Tons) Forecast, by Application 2019 & 2032
- Table 21: Rest of Asia Pacific Polyurethane Additives Industry Revenue (Million) Forecast, by Application 2019 & 2032
- Table 22: Rest of Asia Pacific Polyurethane Additives Industry Volume (K Tons) Forecast, by Application 2019 & 2032
- Table 23: Global Polyurethane Additives Industry Revenue Million Forecast, by Country 2019 & 2032
- Table 24: Global Polyurethane Additives Industry Volume K Tons Forecast, by Country 2019 & 2032
- Table 25: United States Polyurethane Additives Industry Revenue (Million) Forecast, by Application 2019 & 2032
- Table 26: United States Polyurethane Additives Industry Volume (K Tons) Forecast, by Application 2019 & 2032
- Table 27: Canada Polyurethane Additives Industry Revenue (Million) Forecast, by Application 2019 & 2032
- Table 28: Canada Polyurethane Additives Industry Volume (K Tons) Forecast, by Application 2019 & 2032
- Table 29: Mexico Polyurethane Additives Industry Revenue (Million) Forecast, by Application 2019 & 2032
- Table 30: Mexico Polyurethane Additives Industry Volume (K Tons) Forecast, by Application 2019 & 2032
- Table 31: Global Polyurethane Additives Industry Revenue Million Forecast, by Country 2019 & 2032
- Table 32: Global Polyurethane Additives Industry Volume K Tons Forecast, by Country 2019 & 2032
- Table 33: Germany Polyurethane Additives Industry Revenue (Million) Forecast, by Application 2019 & 2032
- Table 34: Germany Polyurethane Additives Industry Volume (K Tons) Forecast, by Application 2019 & 2032
- Table 35: United Kingdom Polyurethane Additives Industry Revenue (Million) Forecast, by Application 2019 & 2032
- Table 36: United Kingdom Polyurethane Additives Industry Volume (K Tons) Forecast, by Application 2019 & 2032
- Table 37: Italy Polyurethane Additives Industry Revenue (Million) Forecast, by Application 2019 & 2032
- Table 38: Italy Polyurethane Additives Industry Volume (K Tons) Forecast, by Application 2019 & 2032
- Table 39: France Polyurethane Additives Industry Revenue (Million) Forecast, by Application 2019 & 2032
- Table 40: France Polyurethane Additives Industry Volume (K Tons) Forecast, by Application 2019 & 2032
- Table 41: Rest of Europe Polyurethane Additives Industry Revenue (Million) Forecast, by Application 2019 & 2032
- Table 42: Rest of Europe Polyurethane Additives Industry Volume (K Tons) Forecast, by Application 2019 & 2032
- Table 43: Global Polyurethane Additives Industry Revenue Million Forecast, by Country 2019 & 2032
- Table 44: Global Polyurethane Additives Industry Volume K Tons Forecast, by Country 2019 & 2032
- Table 45: Brazil Polyurethane Additives Industry Revenue (Million) Forecast, by Application 2019 & 2032
- Table 46: Brazil Polyurethane Additives Industry Volume (K Tons) Forecast, by Application 2019 & 2032
- Table 47: Argentina Polyurethane Additives Industry Revenue (Million) Forecast, by Application 2019 & 2032
- Table 48: Argentina Polyurethane Additives Industry Volume (K Tons) Forecast, by Application 2019 & 2032
- Table 49: Rest of South America Polyurethane Additives Industry Revenue (Million) Forecast, by Application 2019 & 2032
- Table 50: Rest of South America Polyurethane Additives Industry Volume (K Tons) Forecast, by Application 2019 & 2032
- Table 51: Global Polyurethane Additives Industry Revenue Million Forecast, by Country 2019 & 2032
- Table 52: Global Polyurethane Additives Industry Volume K Tons Forecast, by Country 2019 & 2032
- Table 53: Saudi Arabia Polyurethane Additives Industry Revenue (Million) Forecast, by Application 2019 & 2032
- Table 54: Saudi Arabia Polyurethane Additives Industry Volume (K Tons) Forecast, by Application 2019 & 2032
- Table 55: South Africa Polyurethane Additives Industry Revenue (Million) Forecast, by Application 2019 & 2032
- Table 56: South Africa Polyurethane Additives Industry Volume (K Tons) Forecast, by Application 2019 & 2032
- Table 57: Rest of Middle East and Africa Polyurethane Additives Industry Revenue (Million) Forecast, by Application 2019 & 2032
- Table 58: Rest of Middle East and Africa Polyurethane Additives Industry Volume (K Tons) Forecast, by Application 2019 & 2032
- Table 59: Global Polyurethane Additives Industry Revenue Million Forecast, by Type 2019 & 2032
- Table 60: Global Polyurethane Additives Industry Volume K Tons Forecast, by Type 2019 & 2032
- Table 61: Global Polyurethane Additives Industry Revenue Million Forecast, by Application 2019 & 2032
- Table 62: Global Polyurethane Additives Industry Volume K Tons Forecast, by Application 2019 & 2032
- Table 63: Global Polyurethane Additives Industry Revenue Million Forecast, by Country 2019 & 2032
- Table 64: Global Polyurethane Additives Industry Volume K Tons Forecast, by Country 2019 & 2032
- Table 65: China Polyurethane Additives Industry Revenue (Million) Forecast, by Application 2019 & 2032
- Table 66: China Polyurethane Additives Industry Volume (K Tons) Forecast, by Application 2019 & 2032
- Table 67: India Polyurethane Additives Industry Revenue (Million) Forecast, by Application 2019 & 2032
- Table 68: India Polyurethane Additives Industry Volume (K Tons) Forecast, by Application 2019 & 2032
- Table 69: Japan Polyurethane Additives Industry Revenue (Million) Forecast, by Application 2019 & 2032
- Table 70: Japan Polyurethane Additives Industry Volume (K Tons) Forecast, by Application 2019 & 2032
- Table 71: South Korea Polyurethane Additives Industry Revenue (Million) Forecast, by Application 2019 & 2032
- Table 72: South Korea Polyurethane Additives Industry Volume (K Tons) Forecast, by Application 2019 & 2032
- Table 73: ASEAN Countries Polyurethane Additives Industry Revenue (Million) Forecast, by Application 2019 & 2032
- Table 74: ASEAN Countries Polyurethane Additives Industry Volume (K Tons) Forecast, by Application 2019 & 2032
- Table 75: Rest of Asia Pacific Polyurethane Additives Industry Revenue (Million) Forecast, by Application 2019 & 2032
- Table 76: Rest of Asia Pacific Polyurethane Additives Industry Volume (K Tons) Forecast, by Application 2019 & 2032
- Table 77: Global Polyurethane Additives Industry Revenue Million Forecast, by Type 2019 & 2032
- Table 78: Global Polyurethane Additives Industry Volume K Tons Forecast, by Type 2019 & 2032
- Table 79: Global Polyurethane Additives Industry Revenue Million Forecast, by Application 2019 & 2032
- Table 80: Global Polyurethane Additives Industry Volume K Tons Forecast, by Application 2019 & 2032
- Table 81: Global Polyurethane Additives Industry Revenue Million Forecast, by Country 2019 & 2032
- Table 82: Global Polyurethane Additives Industry Volume K Tons Forecast, by Country 2019 & 2032
- Table 83: United States Polyurethane Additives Industry Revenue (Million) Forecast, by Application 2019 & 2032
- Table 84: United States Polyurethane Additives Industry Volume (K Tons) Forecast, by Application 2019 & 2032
- Table 85: Canada Polyurethane Additives Industry Revenue (Million) Forecast, by Application 2019 & 2032
- Table 86: Canada Polyurethane Additives Industry Volume (K Tons) Forecast, by Application 2019 & 2032
- Table 87: Mexico Polyurethane Additives Industry Revenue (Million) Forecast, by Application 2019 & 2032
- Table 88: Mexico Polyurethane Additives Industry Volume (K Tons) Forecast, by Application 2019 & 2032
- Table 89: Global Polyurethane Additives Industry Revenue Million Forecast, by Type 2019 & 2032
- Table 90: Global Polyurethane Additives Industry Volume K Tons Forecast, by Type 2019 & 2032
- Table 91: Global Polyurethane Additives Industry Revenue Million Forecast, by Application 2019 & 2032
- Table 92: Global Polyurethane Additives Industry Volume K Tons Forecast, by Application 2019 & 2032
- Table 93: Global Polyurethane Additives Industry Revenue Million Forecast, by Country 2019 & 2032
- Table 94: Global Polyurethane Additives Industry Volume K Tons Forecast, by Country 2019 & 2032
- Table 95: Germany Polyurethane Additives Industry Revenue (Million) Forecast, by Application 2019 & 2032
- Table 96: Germany Polyurethane Additives Industry Volume (K Tons) Forecast, by Application 2019 & 2032
- Table 97: United Kingdom Polyurethane Additives Industry Revenue (Million) Forecast, by Application 2019 & 2032
- Table 98: United Kingdom Polyurethane Additives Industry Volume (K Tons) Forecast, by Application 2019 & 2032
- Table 99: Italy Polyurethane Additives Industry Revenue (Million) Forecast, by Application 2019 & 2032
- Table 100: Italy Polyurethane Additives Industry Volume (K Tons) Forecast, by Application 2019 & 2032
- Table 101: France Polyurethane Additives Industry Revenue (Million) Forecast, by Application 2019 & 2032
- Table 102: France Polyurethane Additives Industry Volume (K Tons) Forecast, by Application 2019 & 2032
- Table 103: Rest of Europe Polyurethane Additives Industry Revenue (Million) Forecast, by Application 2019 & 2032
- Table 104: Rest of Europe Polyurethane Additives Industry Volume (K Tons) Forecast, by Application 2019 & 2032
- Table 105: Global Polyurethane Additives Industry Revenue Million Forecast, by Type 2019 & 2032
- Table 106: Global Polyurethane Additives Industry Volume K Tons Forecast, by Type 2019 & 2032
- Table 107: Global Polyurethane Additives Industry Revenue Million Forecast, by Application 2019 & 2032
- Table 108: Global Polyurethane Additives Industry Volume K Tons Forecast, by Application 2019 & 2032
- Table 109: Global Polyurethane Additives Industry Revenue Million Forecast, by Country 2019 & 2032
- Table 110: Global Polyurethane Additives Industry Volume K Tons Forecast, by Country 2019 & 2032
- Table 111: Brazil Polyurethane Additives Industry Revenue (Million) Forecast, by Application 2019 & 2032
- Table 112: Brazil Polyurethane Additives Industry Volume (K Tons) Forecast, by Application 2019 & 2032
- Table 113: Argentina Polyurethane Additives Industry Revenue (Million) Forecast, by Application 2019 & 2032
- Table 114: Argentina Polyurethane Additives Industry Volume (K Tons) Forecast, by Application 2019 & 2032
- Table 115: Rest of South America Polyurethane Additives Industry Revenue (Million) Forecast, by Application 2019 & 2032
- Table 116: Rest of South America Polyurethane Additives Industry Volume (K Tons) Forecast, by Application 2019 & 2032
- Table 117: Global Polyurethane Additives Industry Revenue Million Forecast, by Type 2019 & 2032
- Table 118: Global Polyurethane Additives Industry Volume K Tons Forecast, by Type 2019 & 2032
- Table 119: Global Polyurethane Additives Industry Revenue Million Forecast, by Application 2019 & 2032
- Table 120: Global Polyurethane Additives Industry Volume K Tons Forecast, by Application 2019 & 2032
- Table 121: Global Polyurethane Additives Industry Revenue Million Forecast, by Country 2019 & 2032
- Table 122: Global Polyurethane Additives Industry Volume K Tons Forecast, by Country 2019 & 2032
- Table 123: Saudi Arabia Polyurethane Additives Industry Revenue (Million) Forecast, by Application 2019 & 2032
- Table 124: Saudi Arabia Polyurethane Additives Industry Volume (K Tons) Forecast, by Application 2019 & 2032
- Table 125: South Africa Polyurethane Additives Industry Revenue (Million) Forecast, by Application 2019 & 2032
- Table 126: South Africa Polyurethane Additives Industry Volume (K Tons) Forecast, by Application 2019 & 2032
- Table 127: Rest of Middle East and Africa Polyurethane Additives Industry Revenue (Million) Forecast, by Application 2019 & 2032
- Table 128: Rest of Middle East and Africa Polyurethane Additives Industry Volume (K Tons) Forecast, by Application 2019 & 2032
Frequently Asked Questions
1. What is the projected Compound Annual Growth Rate (CAGR) of the Polyurethane Additives Industry?
The projected CAGR is approximately > 4.00%.
2. Which companies are prominent players in the Polyurethane Additives Industry?
Key companies in the market include KAO Corporation, Air Products Inc, Evonik Industries AG, Momentive Performance Materials Inc, Specialty Products Inc, BASF SE, Huntsman International LLC, GEO Specialty Chemicals Inc, Dow, Eastman Chemical Company, Covestro AG, Tosoh Corporation*List Not Exhaustive.
3. What are the main segments of the Polyurethane Additives Industry?
The market segments include Type, Application.
4. Can you provide details about the market size?
The market size is estimated to be USD 3.64 Million as of 2022.
5. What are some drivers contributing to market growth?
Rising Demand for Polyurethane in the Construction Industry; Increasing Demand from the Automotive Industry; Growing demand for sustainable Polyurethane products.
6. What are the notable trends driving market growth?
Increasing Demand from the Automotive Industry.
7. Are there any restraints impacting market growth?
Availability of Alternative Additives; Stringent Government Regulations.
8. Can you provide examples of recent developments in the market?
August 2023: Marelli has developed a new lightweight polyurethane foam that can be applied to all foam-in-place (FIP) applications, particularly the main dashboard panel. This achievement is the result of a joint development with materials partner Covestro AG.
9. What pricing options are available for accessing the report?
Pricing options include single-user, multi-user, and enterprise licenses priced at USD 4750, USD 5250, and USD 8750 respectively.
10. Is the market size provided in terms of value or volume?
The market size is provided in terms of value, measured in Million and volume, measured in K Tons.
11. Are there any specific market keywords associated with the report?
Yes, the market keyword associated with the report is "Polyurethane Additives Industry," which aids in identifying and referencing the specific market segment covered.
12. How do I determine which pricing option suits my needs best?
The pricing options vary based on user requirements and access needs. Individual users may opt for single-user licenses, while businesses requiring broader access may choose multi-user or enterprise licenses for cost-effective access to the report.
13. Are there any additional resources or data provided in the Polyurethane Additives Industry report?
While the report offers comprehensive insights, it's advisable to review the specific contents or supplementary materials provided to ascertain if additional resources or data are available.
14. How can I stay updated on further developments or reports in the Polyurethane Additives Industry?
To stay informed about further developments, trends, and reports in the Polyurethane Additives Industry, consider subscribing to industry newsletters, following relevant companies and organizations, or regularly checking reputable industry news sources and publications.
Methodology
Step 1 - Identification of Relevant Samples Size from Population Database


Step 2 - Approaches for Defining Global Market Size (Value, Volume* & Price*)

Note*: In applicable scenarios
Step 3 - Data Sources
Primary Research
- Web Analytics
- Survey Reports
- Research Institute
- Latest Research Reports
- Opinion Leaders
Secondary Research
- Annual Reports
- White Paper
- Latest Press Release
- Industry Association
- Paid Database
- Investor Presentations

Step 4 - Data Triangulation
Involves using different sources of information in order to increase the validity of a study
These sources are likely to be stakeholders in a program - participants, other researchers, program staff, other community members, and so on.
Then we put all data in single framework & apply various statistical tools to find out the dynamic on the market.
During the analysis stage, feedback from the stakeholder groups would be compared to determine areas of agreement as well as areas of divergence


