
Key Insights
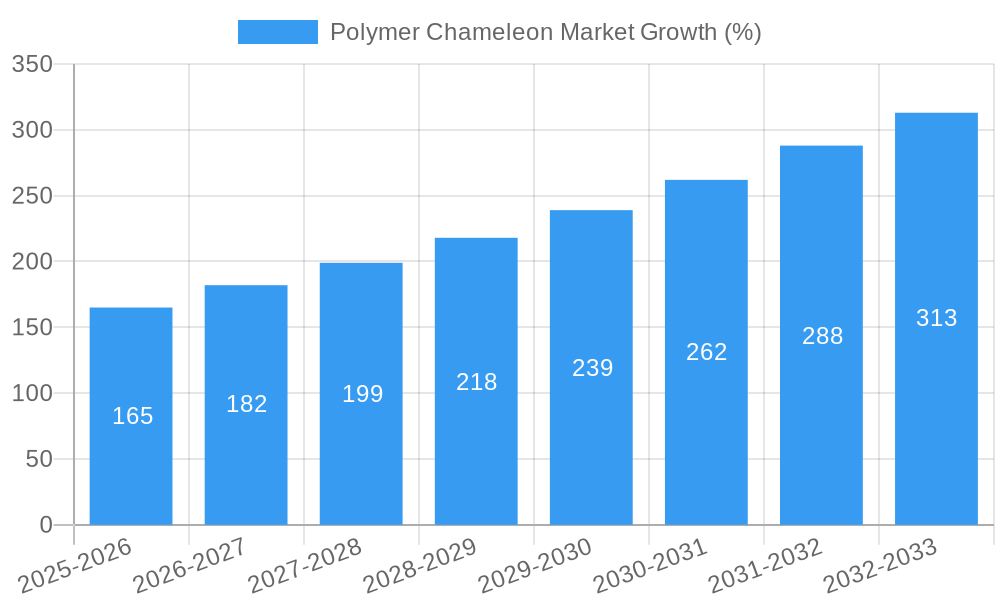
The Polymer Chameleon Market, encompassing photochromic, thermochromic, solvatochromic, electrochromic, and piezorochromic polymers, is experiencing robust growth, projected to maintain a CAGR exceeding 10% from 2025 to 2033. This expansion is driven by increasing demand across diverse end-user industries. The automotive sector leads the way, leveraging these smart polymers for innovative applications in adaptive lighting, temperature-sensitive coatings, and self-healing materials. The textile industry benefits from improved functionality and aesthetics, while the paints and coatings sector utilizes these materials for dynamic color-changing finishes and smart protective layers. Medical applications are emerging, encompassing drug delivery systems and advanced diagnostics. Technological advancements, particularly in the synthesis and functionalization of these polymers, are fueling innovation, leading to enhanced performance characteristics like faster response times, greater color range, and improved durability. However, the market faces challenges, including high initial production costs and potential environmental concerns associated with certain polymer types. Nevertheless, ongoing research and development efforts are focused on addressing these issues, making the market poised for continued expansion.
The market segmentation reveals a strong preference for photochromic and thermochromic polymers due to their established applications and cost-effectiveness. However, electrochromic and solvatochromic segments are exhibiting significant growth potential driven by increasing research into advanced applications in electronics and sensing technologies. Geographically, the Asia-Pacific region, particularly China and India, is expected to dominate the market due to rising industrialization, increasing consumer demand for advanced materials, and favorable government initiatives. North America and Europe are also significant markets, fueled by technological advancements and established industrial bases. While several companies like Merck KGaA, DuPont, and Evonik AG hold significant market share, the emergence of innovative smaller players presents a dynamic and competitive landscape. The forecast period anticipates a considerable market expansion, driven by a continuous influx of innovative products and applications.

Polymer Chameleon Market: A Comprehensive Report (2019-2033)
This meticulously researched report provides an in-depth analysis of the Polymer Chameleon Market, offering invaluable insights for stakeholders seeking to navigate this dynamic landscape. The study covers the period from 2019 to 2033, with 2025 serving as the base and estimated year. The report leverages extensive data and analysis to present a comprehensive view of market size, segmentation, growth drivers, challenges, and competitive dynamics. With a focus on actionable insights and future projections, this report is an essential resource for businesses, investors, and researchers.
Polymer Chameleon Market Market Structure & Competitive Dynamics
The Polymer Chameleon Market is characterized by a moderately concentrated structure, with key players like Merck KGaA, DuPont, and LyondellBasell Industries Holdings B.V. holding significant market share. The market's innovation ecosystem is vibrant, driven by ongoing research into novel materials and applications. Regulatory frameworks, particularly concerning environmental impact and material safety, are increasingly shaping industry practices. Product substitutes, such as traditional color-changing materials, pose a competitive threat, although the unique properties of polymer chameleons often provide a distinct advantage. End-user trends are shifting towards sustainable and technologically advanced solutions, creating opportunities for innovative players.
Mergers and acquisitions (M&A) activity has been moderate in recent years, with deal values averaging approximately $xx Million. Key M&A activities have focused on expanding product portfolios, enhancing technological capabilities, and accessing new markets. For example, the acquisition of [Company Name] by [Acquiring Company] in [Year] significantly altered the market landscape. Market share analysis reveals a competitive landscape where the top five players collectively control approximately xx% of the market.
Polymer Chameleon Market Industry Trends & Insights
The Polymer Chameleon Market is experiencing robust growth, driven by several key factors. The increasing demand for smart materials in diverse industries, such as automotive and textiles, is a significant growth driver. Technological advancements in polymer chemistry are leading to the development of more efficient and versatile chameleon materials. Consumer preferences are shifting towards products with enhanced functionalities and aesthetic appeal, fueling demand for polymer chameleons. The CAGR for the market is projected to be xx% during the forecast period (2025-2033), reaching a market value of $xx Million by 2033. Market penetration is expected to increase significantly, particularly in emerging markets, driven by rising disposable incomes and technological advancements. Competitive dynamics are characterized by intense innovation and strategic partnerships, pushing the boundaries of material science and applications. Technological disruptions, such as the development of new chromic materials, are constantly reshaping the market.
Dominant Markets & Segments in Polymer Chameleon Market
The Automotive end-user industry currently dominates the Polymer Chameleon Market, accounting for approximately xx% of the total market value. Key drivers for this dominance include the increasing demand for customizable interiors and advanced safety features in vehicles. The Photochromic segment holds the largest share within the product category, attributed to its wide range of applications and established market presence.
- Key Drivers for Automotive Dominance:
- Growing demand for advanced driver-assistance systems (ADAS).
- Increased focus on vehicle personalization and aesthetics.
- Government regulations promoting vehicle safety features.
- Key Drivers for Photochromic Segment Dominance:
- Mature technology with established applications.
- Cost-effectiveness compared to other chromic polymers.
- Wide range of applications across different industries.
North America currently leads the global Polymer Chameleon Market in terms of revenue generation, owing to high technological advancements and a substantial automotive sector. However, the Asia-Pacific region is projected to exhibit the fastest growth rate during the forecast period, driven by rapid industrialization and increasing consumer spending.
Polymer Chameleon Market Product Innovations
Recent years have witnessed significant advancements in polymer chameleon technology, including the development of new chromic materials with enhanced performance characteristics such as improved switching speeds and color intensity. New applications are emerging in areas such as flexible displays, smart textiles, and adaptive camouflage. Companies are focusing on developing eco-friendly and sustainable polymer chameleon solutions, aligning with growing environmental concerns. These innovations are improving the market fit of polymer chameleons, expanding their applications, and creating competitive advantages for manufacturers.
Report Segmentation & Scope
This report segments the Polymer Chameleon Market based on Product Type (Photochromic, Thermochromic, Solvatechromic, Electrochromic, Piezorochromic, Others) and End-User Industry (Textile, Automotive, Paints & Coatings, Medical, Others). Each segment is analyzed in detail, including market size, growth projections, and competitive dynamics. The Photochromic segment is projected to witness substantial growth due to its widespread applications. The Automotive industry is expected to dominate the end-user landscape, driving significant demand for polymer chameleon materials. Market sizes and growth rates are provided for each segment, enabling readers to understand the market's diverse landscape.
Key Drivers of Polymer Chameleon Market Growth
Several factors fuel the growth of the Polymer Chameleon Market. Technological advancements in material science lead to improved performance and cost-effectiveness. Government regulations promoting energy efficiency and sustainable materials encourage the adoption of polymer chameleons in various applications. The rising disposable incomes in developing economies contribute to increased demand for advanced materials in various sectors, like consumer electronics and automotive. These factors collectively create a favorable environment for market expansion.
Challenges in the Polymer Chameleon Market Sector
The Polymer Chameleon Market faces several challenges. High manufacturing costs and complex production processes can limit market penetration. The limited availability of raw materials can hinder supply chain efficiency. Stringent regulatory requirements for material safety and environmental impact necessitate compliance measures and may increase costs. Intense competition among established players and emerging companies creates competitive pressure, impacting profitability. These challenges require innovative solutions and strategic planning for sustained market growth.
Leading Players in the Polymer Chameleon Market Market
- Spintech Holdings Inc
- Autonomic Materials Inc
- Merck KGaA
- High Impact Technology LLC
- LyondellBasell Industries Holdings B.V.
- DuPont
- The Lubrizol Corporation
- smartpolymer GmbH
- NatureWorks LLC
- Evonik AG
- SMP Technologies Inc
Key Developments in Polymer Chameleon Market Sector
- January 2023: Merck KGaA announced a new line of highly efficient photochromic polymers.
- June 2022: LyondellBasell Industries Holdings B.V. partnered with a leading automotive manufacturer to develop customized chameleon coatings.
- October 2021: A significant merger between two smaller players in the market consolidated their market share.
Strategic Polymer Chameleon Market Market Outlook
The future of the Polymer Chameleon Market is promising. Continuous innovation in material science and the expansion of applications across diverse industries are key growth accelerators. Strategic partnerships and collaborations between material suppliers and end-users will play a crucial role in driving market expansion. The development of sustainable and cost-effective polymer chameleon solutions will open new opportunities in a variety of sectors. The market's long-term potential is significant, making it an attractive investment opportunity.
Polymer Chameleon Market Segmentation
-
1. Product
- 1.1. Photochromic
- 1.2. Thermochromic
- 1.3. Solvatechromic
- 1.4. Electrochromic
- 1.5. Piezorochromic
- 1.6. Others
-
2. End-User Industry
- 2.1. Textile
- 2.2. Automotive
- 2.3. Paints & Coatings
- 2.4. Medical
- 2.5. Others
Polymer Chameleon Market Segmentation By Geography
-
1. Asia Pacific
- 1.1. China
- 1.2. India
- 1.3. Japan
- 1.4. South Korea
- 1.5. Rest of Asia Pacific
-
2. North America
- 2.1. United States
- 2.2. Canada
- 2.3. Mexico
-
3. Europe
- 3.1. Germany
- 3.2. United Kingdom
- 3.3. France
- 3.4. Italy
- 3.5. Rest of Europe
-
4. South America
- 4.1. Brazil
- 4.2. Argentina
- 4.3. Rest of South America
-
5. Middle East and Africa
- 5.1. Saudi Arabia
- 5.2. South Africa
- 5.3. Rest of Middle East and Africa

Polymer Chameleon Market REPORT HIGHLIGHTS
| Aspects | Details |
|---|---|
| Study Period | 2019-2033 |
| Base Year | 2024 |
| Estimated Year | 2025 |
| Forecast Period | 2025-2033 |
| Historical Period | 2019-2024 |
| Growth Rate | CAGR of > 10.00% from 2019-2033 |
| Segmentation |
|
Table of Contents
- 1. Introduction
- 1.1. Research Scope
- 1.2. Market Segmentation
- 1.3. Research Methodology
- 1.4. Definitions and Assumptions
- 2. Executive Summary
- 2.1. Introduction
- 3. Market Dynamics
- 3.1. Introduction
- 3.2. Market Drivers
- 3.2.1. ; Growing Demand of Chameleon Polymer from Medical and Health Care Industry Centre; Other Drivers
- 3.3. Market Restrains
- 3.3.1. ; High Manufacturing Cost; Other Restraints
- 3.4. Market Trends
- 3.4.1. Growing Demand of Polymer Chameleon from Medical and Health Care Industry
- 4. Market Factor Analysis
- 4.1. Porters Five Forces
- 4.2. Supply/Value Chain
- 4.3. PESTEL analysis
- 4.4. Market Entropy
- 4.5. Patent/Trademark Analysis
- 5. Global Polymer Chameleon Market Analysis, Insights and Forecast, 2019-2031
- 5.1. Market Analysis, Insights and Forecast - by Product
- 5.1.1. Photochromic
- 5.1.2. Thermochromic
- 5.1.3. Solvatechromic
- 5.1.4. Electrochromic
- 5.1.5. Piezorochromic
- 5.1.6. Others
- 5.2. Market Analysis, Insights and Forecast - by End-User Industry
- 5.2.1. Textile
- 5.2.2. Automotive
- 5.2.3. Paints & Coatings
- 5.2.4. Medical
- 5.2.5. Others
- 5.3. Market Analysis, Insights and Forecast - by Region
- 5.3.1. Asia Pacific
- 5.3.2. North America
- 5.3.3. Europe
- 5.3.4. South America
- 5.3.5. Middle East and Africa
- 5.1. Market Analysis, Insights and Forecast - by Product
- 6. Asia Pacific Polymer Chameleon Market Analysis, Insights and Forecast, 2019-2031
- 6.1. Market Analysis, Insights and Forecast - by Product
- 6.1.1. Photochromic
- 6.1.2. Thermochromic
- 6.1.3. Solvatechromic
- 6.1.4. Electrochromic
- 6.1.5. Piezorochromic
- 6.1.6. Others
- 6.2. Market Analysis, Insights and Forecast - by End-User Industry
- 6.2.1. Textile
- 6.2.2. Automotive
- 6.2.3. Paints & Coatings
- 6.2.4. Medical
- 6.2.5. Others
- 6.1. Market Analysis, Insights and Forecast - by Product
- 7. North America Polymer Chameleon Market Analysis, Insights and Forecast, 2019-2031
- 7.1. Market Analysis, Insights and Forecast - by Product
- 7.1.1. Photochromic
- 7.1.2. Thermochromic
- 7.1.3. Solvatechromic
- 7.1.4. Electrochromic
- 7.1.5. Piezorochromic
- 7.1.6. Others
- 7.2. Market Analysis, Insights and Forecast - by End-User Industry
- 7.2.1. Textile
- 7.2.2. Automotive
- 7.2.3. Paints & Coatings
- 7.2.4. Medical
- 7.2.5. Others
- 7.1. Market Analysis, Insights and Forecast - by Product
- 8. Europe Polymer Chameleon Market Analysis, Insights and Forecast, 2019-2031
- 8.1. Market Analysis, Insights and Forecast - by Product
- 8.1.1. Photochromic
- 8.1.2. Thermochromic
- 8.1.3. Solvatechromic
- 8.1.4. Electrochromic
- 8.1.5. Piezorochromic
- 8.1.6. Others
- 8.2. Market Analysis, Insights and Forecast - by End-User Industry
- 8.2.1. Textile
- 8.2.2. Automotive
- 8.2.3. Paints & Coatings
- 8.2.4. Medical
- 8.2.5. Others
- 8.1. Market Analysis, Insights and Forecast - by Product
- 9. South America Polymer Chameleon Market Analysis, Insights and Forecast, 2019-2031
- 9.1. Market Analysis, Insights and Forecast - by Product
- 9.1.1. Photochromic
- 9.1.2. Thermochromic
- 9.1.3. Solvatechromic
- 9.1.4. Electrochromic
- 9.1.5. Piezorochromic
- 9.1.6. Others
- 9.2. Market Analysis, Insights and Forecast - by End-User Industry
- 9.2.1. Textile
- 9.2.2. Automotive
- 9.2.3. Paints & Coatings
- 9.2.4. Medical
- 9.2.5. Others
- 9.1. Market Analysis, Insights and Forecast - by Product
- 10. Middle East and Africa Polymer Chameleon Market Analysis, Insights and Forecast, 2019-2031
- 10.1. Market Analysis, Insights and Forecast - by Product
- 10.1.1. Photochromic
- 10.1.2. Thermochromic
- 10.1.3. Solvatechromic
- 10.1.4. Electrochromic
- 10.1.5. Piezorochromic
- 10.1.6. Others
- 10.2. Market Analysis, Insights and Forecast - by End-User Industry
- 10.2.1. Textile
- 10.2.2. Automotive
- 10.2.3. Paints & Coatings
- 10.2.4. Medical
- 10.2.5. Others
- 10.1. Market Analysis, Insights and Forecast - by Product
- 11. Asia Pacific Polymer Chameleon Market Analysis, Insights and Forecast, 2019-2031
- 11.1. Market Analysis, Insights and Forecast - By Country/Sub-region
- 11.1.1 China
- 11.1.2 India
- 11.1.3 Japan
- 11.1.4 South Korea
- 11.1.5 Rest of Asia Pacific
- 12. North America Polymer Chameleon Market Analysis, Insights and Forecast, 2019-2031
- 12.1. Market Analysis, Insights and Forecast - By Country/Sub-region
- 12.1.1 United States
- 12.1.2 Canada
- 12.1.3 Mexico
- 13. Europe Polymer Chameleon Market Analysis, Insights and Forecast, 2019-2031
- 13.1. Market Analysis, Insights and Forecast - By Country/Sub-region
- 13.1.1 Germany
- 13.1.2 United Kingdom
- 13.1.3 France
- 13.1.4 Italy
- 13.1.5 Rest of Europe
- 14. South America Polymer Chameleon Market Analysis, Insights and Forecast, 2019-2031
- 14.1. Market Analysis, Insights and Forecast - By Country/Sub-region
- 14.1.1 Brazil
- 14.1.2 Argentina
- 14.1.3 Rest of South America
- 15. Middle East and Africa Polymer Chameleon Market Analysis, Insights and Forecast, 2019-2031
- 15.1. Market Analysis, Insights and Forecast - By Country/Sub-region
- 15.1.1 Saudi Arabia
- 15.1.2 South Africa
- 15.1.3 Rest of Middle East and Africa
- 16. Competitive Analysis
- 16.1. Global Market Share Analysis 2024
- 16.2. Company Profiles
- 16.2.1 Spintech Holdings Inc
- 16.2.1.1. Overview
- 16.2.1.2. Products
- 16.2.1.3. SWOT Analysis
- 16.2.1.4. Recent Developments
- 16.2.1.5. Financials (Based on Availability)
- 16.2.2 Autonomic Materials Inc
- 16.2.2.1. Overview
- 16.2.2.2. Products
- 16.2.2.3. SWOT Analysis
- 16.2.2.4. Recent Developments
- 16.2.2.5. Financials (Based on Availability)
- 16.2.3 Merck KGaA
- 16.2.3.1. Overview
- 16.2.3.2. Products
- 16.2.3.3. SWOT Analysis
- 16.2.3.4. Recent Developments
- 16.2.3.5. Financials (Based on Availability)
- 16.2.4 High Impact Technology LLC
- 16.2.4.1. Overview
- 16.2.4.2. Products
- 16.2.4.3. SWOT Analysis
- 16.2.4.4. Recent Developments
- 16.2.4.5. Financials (Based on Availability)
- 16.2.5 LyondellBasell Industries Holdings B V
- 16.2.5.1. Overview
- 16.2.5.2. Products
- 16.2.5.3. SWOT Analysis
- 16.2.5.4. Recent Developments
- 16.2.5.5. Financials (Based on Availability)
- 16.2.6 DuPont
- 16.2.6.1. Overview
- 16.2.6.2. Products
- 16.2.6.3. SWOT Analysis
- 16.2.6.4. Recent Developments
- 16.2.6.5. Financials (Based on Availability)
- 16.2.7 The Lubrizol Corporation
- 16.2.7.1. Overview
- 16.2.7.2. Products
- 16.2.7.3. SWOT Analysis
- 16.2.7.4. Recent Developments
- 16.2.7.5. Financials (Based on Availability)
- 16.2.8 smartpolymer GmbH
- 16.2.8.1. Overview
- 16.2.8.2. Products
- 16.2.8.3. SWOT Analysis
- 16.2.8.4. Recent Developments
- 16.2.8.5. Financials (Based on Availability)
- 16.2.9 NatureWorks LLC
- 16.2.9.1. Overview
- 16.2.9.2. Products
- 16.2.9.3. SWOT Analysis
- 16.2.9.4. Recent Developments
- 16.2.9.5. Financials (Based on Availability)
- 16.2.10 Evonik AG
- 16.2.10.1. Overview
- 16.2.10.2. Products
- 16.2.10.3. SWOT Analysis
- 16.2.10.4. Recent Developments
- 16.2.10.5. Financials (Based on Availability)
- 16.2.11 SMP Technologies Inc
- 16.2.11.1. Overview
- 16.2.11.2. Products
- 16.2.11.3. SWOT Analysis
- 16.2.11.4. Recent Developments
- 16.2.11.5. Financials (Based on Availability)
- 16.2.1 Spintech Holdings Inc
List of Figures
- Figure 1: Global Polymer Chameleon Market Revenue Breakdown (Million, %) by Region 2024 & 2032
- Figure 2: Global Polymer Chameleon Market Volume Breakdown (K Tons, %) by Region 2024 & 2032
- Figure 3: Asia Pacific Polymer Chameleon Market Revenue (Million), by Country 2024 & 2032
- Figure 4: Asia Pacific Polymer Chameleon Market Volume (K Tons), by Country 2024 & 2032
- Figure 5: Asia Pacific Polymer Chameleon Market Revenue Share (%), by Country 2024 & 2032
- Figure 6: Asia Pacific Polymer Chameleon Market Volume Share (%), by Country 2024 & 2032
- Figure 7: North America Polymer Chameleon Market Revenue (Million), by Country 2024 & 2032
- Figure 8: North America Polymer Chameleon Market Volume (K Tons), by Country 2024 & 2032
- Figure 9: North America Polymer Chameleon Market Revenue Share (%), by Country 2024 & 2032
- Figure 10: North America Polymer Chameleon Market Volume Share (%), by Country 2024 & 2032
- Figure 11: Europe Polymer Chameleon Market Revenue (Million), by Country 2024 & 2032
- Figure 12: Europe Polymer Chameleon Market Volume (K Tons), by Country 2024 & 2032
- Figure 13: Europe Polymer Chameleon Market Revenue Share (%), by Country 2024 & 2032
- Figure 14: Europe Polymer Chameleon Market Volume Share (%), by Country 2024 & 2032
- Figure 15: South America Polymer Chameleon Market Revenue (Million), by Country 2024 & 2032
- Figure 16: South America Polymer Chameleon Market Volume (K Tons), by Country 2024 & 2032
- Figure 17: South America Polymer Chameleon Market Revenue Share (%), by Country 2024 & 2032
- Figure 18: South America Polymer Chameleon Market Volume Share (%), by Country 2024 & 2032
- Figure 19: Middle East and Africa Polymer Chameleon Market Revenue (Million), by Country 2024 & 2032
- Figure 20: Middle East and Africa Polymer Chameleon Market Volume (K Tons), by Country 2024 & 2032
- Figure 21: Middle East and Africa Polymer Chameleon Market Revenue Share (%), by Country 2024 & 2032
- Figure 22: Middle East and Africa Polymer Chameleon Market Volume Share (%), by Country 2024 & 2032
- Figure 23: Asia Pacific Polymer Chameleon Market Revenue (Million), by Product 2024 & 2032
- Figure 24: Asia Pacific Polymer Chameleon Market Volume (K Tons), by Product 2024 & 2032
- Figure 25: Asia Pacific Polymer Chameleon Market Revenue Share (%), by Product 2024 & 2032
- Figure 26: Asia Pacific Polymer Chameleon Market Volume Share (%), by Product 2024 & 2032
- Figure 27: Asia Pacific Polymer Chameleon Market Revenue (Million), by End-User Industry 2024 & 2032
- Figure 28: Asia Pacific Polymer Chameleon Market Volume (K Tons), by End-User Industry 2024 & 2032
- Figure 29: Asia Pacific Polymer Chameleon Market Revenue Share (%), by End-User Industry 2024 & 2032
- Figure 30: Asia Pacific Polymer Chameleon Market Volume Share (%), by End-User Industry 2024 & 2032
- Figure 31: Asia Pacific Polymer Chameleon Market Revenue (Million), by Country 2024 & 2032
- Figure 32: Asia Pacific Polymer Chameleon Market Volume (K Tons), by Country 2024 & 2032
- Figure 33: Asia Pacific Polymer Chameleon Market Revenue Share (%), by Country 2024 & 2032
- Figure 34: Asia Pacific Polymer Chameleon Market Volume Share (%), by Country 2024 & 2032
- Figure 35: North America Polymer Chameleon Market Revenue (Million), by Product 2024 & 2032
- Figure 36: North America Polymer Chameleon Market Volume (K Tons), by Product 2024 & 2032
- Figure 37: North America Polymer Chameleon Market Revenue Share (%), by Product 2024 & 2032
- Figure 38: North America Polymer Chameleon Market Volume Share (%), by Product 2024 & 2032
- Figure 39: North America Polymer Chameleon Market Revenue (Million), by End-User Industry 2024 & 2032
- Figure 40: North America Polymer Chameleon Market Volume (K Tons), by End-User Industry 2024 & 2032
- Figure 41: North America Polymer Chameleon Market Revenue Share (%), by End-User Industry 2024 & 2032
- Figure 42: North America Polymer Chameleon Market Volume Share (%), by End-User Industry 2024 & 2032
- Figure 43: North America Polymer Chameleon Market Revenue (Million), by Country 2024 & 2032
- Figure 44: North America Polymer Chameleon Market Volume (K Tons), by Country 2024 & 2032
- Figure 45: North America Polymer Chameleon Market Revenue Share (%), by Country 2024 & 2032
- Figure 46: North America Polymer Chameleon Market Volume Share (%), by Country 2024 & 2032
- Figure 47: Europe Polymer Chameleon Market Revenue (Million), by Product 2024 & 2032
- Figure 48: Europe Polymer Chameleon Market Volume (K Tons), by Product 2024 & 2032
- Figure 49: Europe Polymer Chameleon Market Revenue Share (%), by Product 2024 & 2032
- Figure 50: Europe Polymer Chameleon Market Volume Share (%), by Product 2024 & 2032
- Figure 51: Europe Polymer Chameleon Market Revenue (Million), by End-User Industry 2024 & 2032
- Figure 52: Europe Polymer Chameleon Market Volume (K Tons), by End-User Industry 2024 & 2032
- Figure 53: Europe Polymer Chameleon Market Revenue Share (%), by End-User Industry 2024 & 2032
- Figure 54: Europe Polymer Chameleon Market Volume Share (%), by End-User Industry 2024 & 2032
- Figure 55: Europe Polymer Chameleon Market Revenue (Million), by Country 2024 & 2032
- Figure 56: Europe Polymer Chameleon Market Volume (K Tons), by Country 2024 & 2032
- Figure 57: Europe Polymer Chameleon Market Revenue Share (%), by Country 2024 & 2032
- Figure 58: Europe Polymer Chameleon Market Volume Share (%), by Country 2024 & 2032
- Figure 59: South America Polymer Chameleon Market Revenue (Million), by Product 2024 & 2032
- Figure 60: South America Polymer Chameleon Market Volume (K Tons), by Product 2024 & 2032
- Figure 61: South America Polymer Chameleon Market Revenue Share (%), by Product 2024 & 2032
- Figure 62: South America Polymer Chameleon Market Volume Share (%), by Product 2024 & 2032
- Figure 63: South America Polymer Chameleon Market Revenue (Million), by End-User Industry 2024 & 2032
- Figure 64: South America Polymer Chameleon Market Volume (K Tons), by End-User Industry 2024 & 2032
- Figure 65: South America Polymer Chameleon Market Revenue Share (%), by End-User Industry 2024 & 2032
- Figure 66: South America Polymer Chameleon Market Volume Share (%), by End-User Industry 2024 & 2032
- Figure 67: South America Polymer Chameleon Market Revenue (Million), by Country 2024 & 2032
- Figure 68: South America Polymer Chameleon Market Volume (K Tons), by Country 2024 & 2032
- Figure 69: South America Polymer Chameleon Market Revenue Share (%), by Country 2024 & 2032
- Figure 70: South America Polymer Chameleon Market Volume Share (%), by Country 2024 & 2032
- Figure 71: Middle East and Africa Polymer Chameleon Market Revenue (Million), by Product 2024 & 2032
- Figure 72: Middle East and Africa Polymer Chameleon Market Volume (K Tons), by Product 2024 & 2032
- Figure 73: Middle East and Africa Polymer Chameleon Market Revenue Share (%), by Product 2024 & 2032
- Figure 74: Middle East and Africa Polymer Chameleon Market Volume Share (%), by Product 2024 & 2032
- Figure 75: Middle East and Africa Polymer Chameleon Market Revenue (Million), by End-User Industry 2024 & 2032
- Figure 76: Middle East and Africa Polymer Chameleon Market Volume (K Tons), by End-User Industry 2024 & 2032
- Figure 77: Middle East and Africa Polymer Chameleon Market Revenue Share (%), by End-User Industry 2024 & 2032
- Figure 78: Middle East and Africa Polymer Chameleon Market Volume Share (%), by End-User Industry 2024 & 2032
- Figure 79: Middle East and Africa Polymer Chameleon Market Revenue (Million), by Country 2024 & 2032
- Figure 80: Middle East and Africa Polymer Chameleon Market Volume (K Tons), by Country 2024 & 2032
- Figure 81: Middle East and Africa Polymer Chameleon Market Revenue Share (%), by Country 2024 & 2032
- Figure 82: Middle East and Africa Polymer Chameleon Market Volume Share (%), by Country 2024 & 2032
List of Tables
- Table 1: Global Polymer Chameleon Market Revenue Million Forecast, by Region 2019 & 2032
- Table 2: Global Polymer Chameleon Market Volume K Tons Forecast, by Region 2019 & 2032
- Table 3: Global Polymer Chameleon Market Revenue Million Forecast, by Product 2019 & 2032
- Table 4: Global Polymer Chameleon Market Volume K Tons Forecast, by Product 2019 & 2032
- Table 5: Global Polymer Chameleon Market Revenue Million Forecast, by End-User Industry 2019 & 2032
- Table 6: Global Polymer Chameleon Market Volume K Tons Forecast, by End-User Industry 2019 & 2032
- Table 7: Global Polymer Chameleon Market Revenue Million Forecast, by Region 2019 & 2032
- Table 8: Global Polymer Chameleon Market Volume K Tons Forecast, by Region 2019 & 2032
- Table 9: Global Polymer Chameleon Market Revenue Million Forecast, by Country 2019 & 2032
- Table 10: Global Polymer Chameleon Market Volume K Tons Forecast, by Country 2019 & 2032
- Table 11: China Polymer Chameleon Market Revenue (Million) Forecast, by Application 2019 & 2032
- Table 12: China Polymer Chameleon Market Volume (K Tons) Forecast, by Application 2019 & 2032
- Table 13: India Polymer Chameleon Market Revenue (Million) Forecast, by Application 2019 & 2032
- Table 14: India Polymer Chameleon Market Volume (K Tons) Forecast, by Application 2019 & 2032
- Table 15: Japan Polymer Chameleon Market Revenue (Million) Forecast, by Application 2019 & 2032
- Table 16: Japan Polymer Chameleon Market Volume (K Tons) Forecast, by Application 2019 & 2032
- Table 17: South Korea Polymer Chameleon Market Revenue (Million) Forecast, by Application 2019 & 2032
- Table 18: South Korea Polymer Chameleon Market Volume (K Tons) Forecast, by Application 2019 & 2032
- Table 19: Rest of Asia Pacific Polymer Chameleon Market Revenue (Million) Forecast, by Application 2019 & 2032
- Table 20: Rest of Asia Pacific Polymer Chameleon Market Volume (K Tons) Forecast, by Application 2019 & 2032
- Table 21: Global Polymer Chameleon Market Revenue Million Forecast, by Country 2019 & 2032
- Table 22: Global Polymer Chameleon Market Volume K Tons Forecast, by Country 2019 & 2032
- Table 23: United States Polymer Chameleon Market Revenue (Million) Forecast, by Application 2019 & 2032
- Table 24: United States Polymer Chameleon Market Volume (K Tons) Forecast, by Application 2019 & 2032
- Table 25: Canada Polymer Chameleon Market Revenue (Million) Forecast, by Application 2019 & 2032
- Table 26: Canada Polymer Chameleon Market Volume (K Tons) Forecast, by Application 2019 & 2032
- Table 27: Mexico Polymer Chameleon Market Revenue (Million) Forecast, by Application 2019 & 2032
- Table 28: Mexico Polymer Chameleon Market Volume (K Tons) Forecast, by Application 2019 & 2032
- Table 29: Global Polymer Chameleon Market Revenue Million Forecast, by Country 2019 & 2032
- Table 30: Global Polymer Chameleon Market Volume K Tons Forecast, by Country 2019 & 2032
- Table 31: Germany Polymer Chameleon Market Revenue (Million) Forecast, by Application 2019 & 2032
- Table 32: Germany Polymer Chameleon Market Volume (K Tons) Forecast, by Application 2019 & 2032
- Table 33: United Kingdom Polymer Chameleon Market Revenue (Million) Forecast, by Application 2019 & 2032
- Table 34: United Kingdom Polymer Chameleon Market Volume (K Tons) Forecast, by Application 2019 & 2032
- Table 35: France Polymer Chameleon Market Revenue (Million) Forecast, by Application 2019 & 2032
- Table 36: France Polymer Chameleon Market Volume (K Tons) Forecast, by Application 2019 & 2032
- Table 37: Italy Polymer Chameleon Market Revenue (Million) Forecast, by Application 2019 & 2032
- Table 38: Italy Polymer Chameleon Market Volume (K Tons) Forecast, by Application 2019 & 2032
- Table 39: Rest of Europe Polymer Chameleon Market Revenue (Million) Forecast, by Application 2019 & 2032
- Table 40: Rest of Europe Polymer Chameleon Market Volume (K Tons) Forecast, by Application 2019 & 2032
- Table 41: Global Polymer Chameleon Market Revenue Million Forecast, by Country 2019 & 2032
- Table 42: Global Polymer Chameleon Market Volume K Tons Forecast, by Country 2019 & 2032
- Table 43: Brazil Polymer Chameleon Market Revenue (Million) Forecast, by Application 2019 & 2032
- Table 44: Brazil Polymer Chameleon Market Volume (K Tons) Forecast, by Application 2019 & 2032
- Table 45: Argentina Polymer Chameleon Market Revenue (Million) Forecast, by Application 2019 & 2032
- Table 46: Argentina Polymer Chameleon Market Volume (K Tons) Forecast, by Application 2019 & 2032
- Table 47: Rest of South America Polymer Chameleon Market Revenue (Million) Forecast, by Application 2019 & 2032
- Table 48: Rest of South America Polymer Chameleon Market Volume (K Tons) Forecast, by Application 2019 & 2032
- Table 49: Global Polymer Chameleon Market Revenue Million Forecast, by Country 2019 & 2032
- Table 50: Global Polymer Chameleon Market Volume K Tons Forecast, by Country 2019 & 2032
- Table 51: Saudi Arabia Polymer Chameleon Market Revenue (Million) Forecast, by Application 2019 & 2032
- Table 52: Saudi Arabia Polymer Chameleon Market Volume (K Tons) Forecast, by Application 2019 & 2032
- Table 53: South Africa Polymer Chameleon Market Revenue (Million) Forecast, by Application 2019 & 2032
- Table 54: South Africa Polymer Chameleon Market Volume (K Tons) Forecast, by Application 2019 & 2032
- Table 55: Rest of Middle East and Africa Polymer Chameleon Market Revenue (Million) Forecast, by Application 2019 & 2032
- Table 56: Rest of Middle East and Africa Polymer Chameleon Market Volume (K Tons) Forecast, by Application 2019 & 2032
- Table 57: Global Polymer Chameleon Market Revenue Million Forecast, by Product 2019 & 2032
- Table 58: Global Polymer Chameleon Market Volume K Tons Forecast, by Product 2019 & 2032
- Table 59: Global Polymer Chameleon Market Revenue Million Forecast, by End-User Industry 2019 & 2032
- Table 60: Global Polymer Chameleon Market Volume K Tons Forecast, by End-User Industry 2019 & 2032
- Table 61: Global Polymer Chameleon Market Revenue Million Forecast, by Country 2019 & 2032
- Table 62: Global Polymer Chameleon Market Volume K Tons Forecast, by Country 2019 & 2032
- Table 63: China Polymer Chameleon Market Revenue (Million) Forecast, by Application 2019 & 2032
- Table 64: China Polymer Chameleon Market Volume (K Tons) Forecast, by Application 2019 & 2032
- Table 65: India Polymer Chameleon Market Revenue (Million) Forecast, by Application 2019 & 2032
- Table 66: India Polymer Chameleon Market Volume (K Tons) Forecast, by Application 2019 & 2032
- Table 67: Japan Polymer Chameleon Market Revenue (Million) Forecast, by Application 2019 & 2032
- Table 68: Japan Polymer Chameleon Market Volume (K Tons) Forecast, by Application 2019 & 2032
- Table 69: South Korea Polymer Chameleon Market Revenue (Million) Forecast, by Application 2019 & 2032
- Table 70: South Korea Polymer Chameleon Market Volume (K Tons) Forecast, by Application 2019 & 2032
- Table 71: Rest of Asia Pacific Polymer Chameleon Market Revenue (Million) Forecast, by Application 2019 & 2032
- Table 72: Rest of Asia Pacific Polymer Chameleon Market Volume (K Tons) Forecast, by Application 2019 & 2032
- Table 73: Global Polymer Chameleon Market Revenue Million Forecast, by Product 2019 & 2032
- Table 74: Global Polymer Chameleon Market Volume K Tons Forecast, by Product 2019 & 2032
- Table 75: Global Polymer Chameleon Market Revenue Million Forecast, by End-User Industry 2019 & 2032
- Table 76: Global Polymer Chameleon Market Volume K Tons Forecast, by End-User Industry 2019 & 2032
- Table 77: Global Polymer Chameleon Market Revenue Million Forecast, by Country 2019 & 2032
- Table 78: Global Polymer Chameleon Market Volume K Tons Forecast, by Country 2019 & 2032
- Table 79: United States Polymer Chameleon Market Revenue (Million) Forecast, by Application 2019 & 2032
- Table 80: United States Polymer Chameleon Market Volume (K Tons) Forecast, by Application 2019 & 2032
- Table 81: Canada Polymer Chameleon Market Revenue (Million) Forecast, by Application 2019 & 2032
- Table 82: Canada Polymer Chameleon Market Volume (K Tons) Forecast, by Application 2019 & 2032
- Table 83: Mexico Polymer Chameleon Market Revenue (Million) Forecast, by Application 2019 & 2032
- Table 84: Mexico Polymer Chameleon Market Volume (K Tons) Forecast, by Application 2019 & 2032
- Table 85: Global Polymer Chameleon Market Revenue Million Forecast, by Product 2019 & 2032
- Table 86: Global Polymer Chameleon Market Volume K Tons Forecast, by Product 2019 & 2032
- Table 87: Global Polymer Chameleon Market Revenue Million Forecast, by End-User Industry 2019 & 2032
- Table 88: Global Polymer Chameleon Market Volume K Tons Forecast, by End-User Industry 2019 & 2032
- Table 89: Global Polymer Chameleon Market Revenue Million Forecast, by Country 2019 & 2032
- Table 90: Global Polymer Chameleon Market Volume K Tons Forecast, by Country 2019 & 2032
- Table 91: Germany Polymer Chameleon Market Revenue (Million) Forecast, by Application 2019 & 2032
- Table 92: Germany Polymer Chameleon Market Volume (K Tons) Forecast, by Application 2019 & 2032
- Table 93: United Kingdom Polymer Chameleon Market Revenue (Million) Forecast, by Application 2019 & 2032
- Table 94: United Kingdom Polymer Chameleon Market Volume (K Tons) Forecast, by Application 2019 & 2032
- Table 95: France Polymer Chameleon Market Revenue (Million) Forecast, by Application 2019 & 2032
- Table 96: France Polymer Chameleon Market Volume (K Tons) Forecast, by Application 2019 & 2032
- Table 97: Italy Polymer Chameleon Market Revenue (Million) Forecast, by Application 2019 & 2032
- Table 98: Italy Polymer Chameleon Market Volume (K Tons) Forecast, by Application 2019 & 2032
- Table 99: Rest of Europe Polymer Chameleon Market Revenue (Million) Forecast, by Application 2019 & 2032
- Table 100: Rest of Europe Polymer Chameleon Market Volume (K Tons) Forecast, by Application 2019 & 2032
- Table 101: Global Polymer Chameleon Market Revenue Million Forecast, by Product 2019 & 2032
- Table 102: Global Polymer Chameleon Market Volume K Tons Forecast, by Product 2019 & 2032
- Table 103: Global Polymer Chameleon Market Revenue Million Forecast, by End-User Industry 2019 & 2032
- Table 104: Global Polymer Chameleon Market Volume K Tons Forecast, by End-User Industry 2019 & 2032
- Table 105: Global Polymer Chameleon Market Revenue Million Forecast, by Country 2019 & 2032
- Table 106: Global Polymer Chameleon Market Volume K Tons Forecast, by Country 2019 & 2032
- Table 107: Brazil Polymer Chameleon Market Revenue (Million) Forecast, by Application 2019 & 2032
- Table 108: Brazil Polymer Chameleon Market Volume (K Tons) Forecast, by Application 2019 & 2032
- Table 109: Argentina Polymer Chameleon Market Revenue (Million) Forecast, by Application 2019 & 2032
- Table 110: Argentina Polymer Chameleon Market Volume (K Tons) Forecast, by Application 2019 & 2032
- Table 111: Rest of South America Polymer Chameleon Market Revenue (Million) Forecast, by Application 2019 & 2032
- Table 112: Rest of South America Polymer Chameleon Market Volume (K Tons) Forecast, by Application 2019 & 2032
- Table 113: Global Polymer Chameleon Market Revenue Million Forecast, by Product 2019 & 2032
- Table 114: Global Polymer Chameleon Market Volume K Tons Forecast, by Product 2019 & 2032
- Table 115: Global Polymer Chameleon Market Revenue Million Forecast, by End-User Industry 2019 & 2032
- Table 116: Global Polymer Chameleon Market Volume K Tons Forecast, by End-User Industry 2019 & 2032
- Table 117: Global Polymer Chameleon Market Revenue Million Forecast, by Country 2019 & 2032
- Table 118: Global Polymer Chameleon Market Volume K Tons Forecast, by Country 2019 & 2032
- Table 119: Saudi Arabia Polymer Chameleon Market Revenue (Million) Forecast, by Application 2019 & 2032
- Table 120: Saudi Arabia Polymer Chameleon Market Volume (K Tons) Forecast, by Application 2019 & 2032
- Table 121: South Africa Polymer Chameleon Market Revenue (Million) Forecast, by Application 2019 & 2032
- Table 122: South Africa Polymer Chameleon Market Volume (K Tons) Forecast, by Application 2019 & 2032
- Table 123: Rest of Middle East and Africa Polymer Chameleon Market Revenue (Million) Forecast, by Application 2019 & 2032
- Table 124: Rest of Middle East and Africa Polymer Chameleon Market Volume (K Tons) Forecast, by Application 2019 & 2032
Frequently Asked Questions
1. What is the projected Compound Annual Growth Rate (CAGR) of the Polymer Chameleon Market?
The projected CAGR is approximately > 10.00%.
2. Which companies are prominent players in the Polymer Chameleon Market?
Key companies in the market include Spintech Holdings Inc, Autonomic Materials Inc, Merck KGaA, High Impact Technology LLC, LyondellBasell Industries Holdings B V, DuPont, The Lubrizol Corporation, smartpolymer GmbH, NatureWorks LLC, Evonik AG, SMP Technologies Inc.
3. What are the main segments of the Polymer Chameleon Market?
The market segments include Product, End-User Industry.
4. Can you provide details about the market size?
The market size is estimated to be USD XX Million as of 2022.
5. What are some drivers contributing to market growth?
; Growing Demand of Chameleon Polymer from Medical and Health Care Industry Centre; Other Drivers.
6. What are the notable trends driving market growth?
Growing Demand of Polymer Chameleon from Medical and Health Care Industry.
7. Are there any restraints impacting market growth?
; High Manufacturing Cost; Other Restraints.
8. Can you provide examples of recent developments in the market?
N/A
9. What pricing options are available for accessing the report?
Pricing options include single-user, multi-user, and enterprise licenses priced at USD 4750, USD 5250, and USD 8750 respectively.
10. Is the market size provided in terms of value or volume?
The market size is provided in terms of value, measured in Million and volume, measured in K Tons.
11. Are there any specific market keywords associated with the report?
Yes, the market keyword associated with the report is "Polymer Chameleon Market," which aids in identifying and referencing the specific market segment covered.
12. How do I determine which pricing option suits my needs best?
The pricing options vary based on user requirements and access needs. Individual users may opt for single-user licenses, while businesses requiring broader access may choose multi-user or enterprise licenses for cost-effective access to the report.
13. Are there any additional resources or data provided in the Polymer Chameleon Market report?
While the report offers comprehensive insights, it's advisable to review the specific contents or supplementary materials provided to ascertain if additional resources or data are available.
14. How can I stay updated on further developments or reports in the Polymer Chameleon Market?
To stay informed about further developments, trends, and reports in the Polymer Chameleon Market, consider subscribing to industry newsletters, following relevant companies and organizations, or regularly checking reputable industry news sources and publications.
Methodology
Step 1 - Identification of Relevant Samples Size from Population Database


Step 2 - Approaches for Defining Global Market Size (Value, Volume* & Price*)

Note*: In applicable scenarios
Step 3 - Data Sources
Primary Research
- Web Analytics
- Survey Reports
- Research Institute
- Latest Research Reports
- Opinion Leaders
Secondary Research
- Annual Reports
- White Paper
- Latest Press Release
- Industry Association
- Paid Database
- Investor Presentations

Step 4 - Data Triangulation
Involves using different sources of information in order to increase the validity of a study
These sources are likely to be stakeholders in a program - participants, other researchers, program staff, other community members, and so on.
Then we put all data in single framework & apply various statistical tools to find out the dynamic on the market.
During the analysis stage, feedback from the stakeholder groups would be compared to determine areas of agreement as well as areas of divergence


