
Key Insights
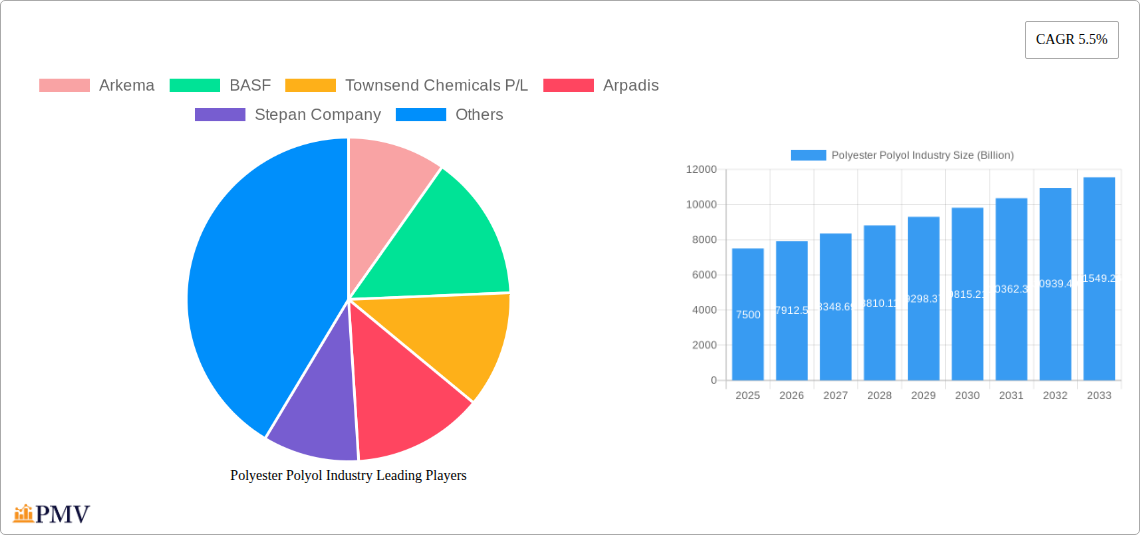
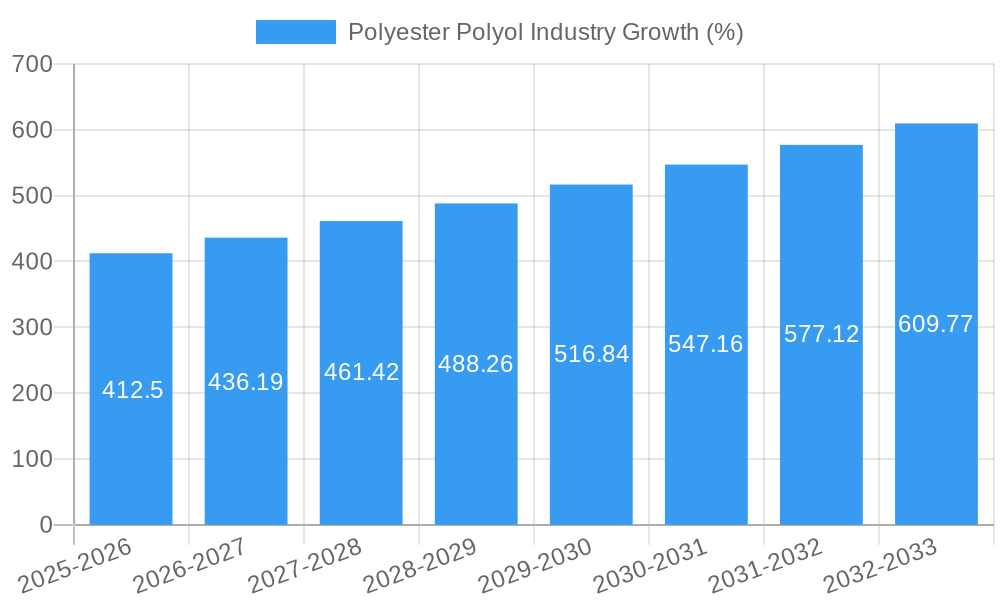
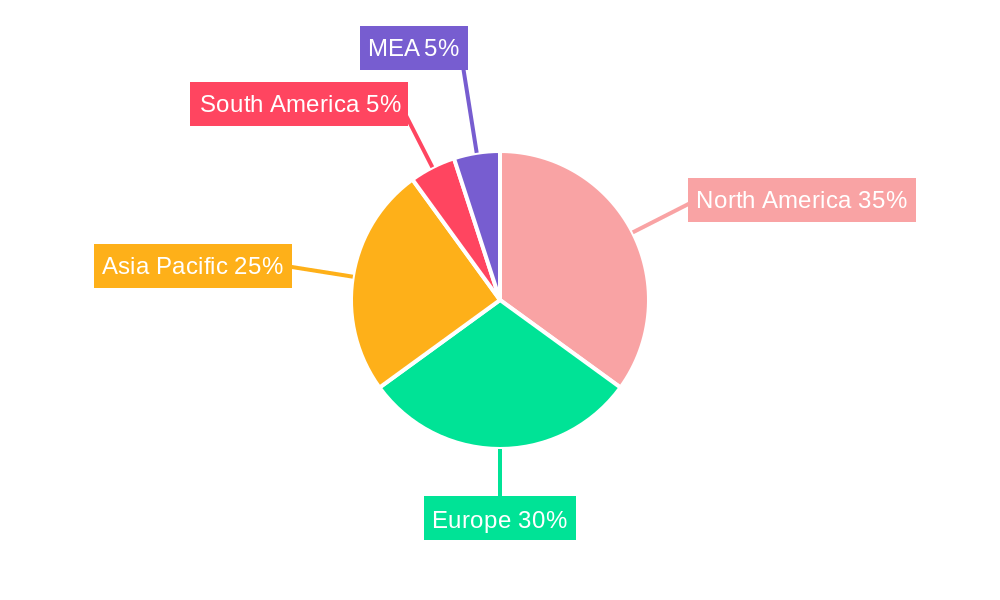
The global polyester polyol market, valued at $7.5 billion in 2025, is projected to experience robust growth, driven by a compound annual growth rate (CAGR) of 5.5% from 2025 to 2033. This expansion is fueled by the increasing demand for polyurethane-based products across diverse applications. The CASE (Coatings, Adhesives, Sealants, Elastomers) segment is a significant contributor, benefiting from the growing construction and automotive industries. Simultaneously, the flexible and rigid foam segments are experiencing steady growth due to their widespread use in furniture, bedding, and insulation materials. Technological advancements leading to the development of eco-friendly and high-performance polyester polyols further propel market expansion. However, fluctuating raw material prices and stringent environmental regulations pose challenges to the industry's sustained growth. The market is segmented by type (aliphatic and aromatic polyester polyols) and application, with aliphatic polyester polyols dominating due to their superior properties. Geographically, North America and Europe currently hold substantial market shares, but the Asia-Pacific region is poised for significant growth owing to rapid industrialization and rising disposable incomes. Key players like Arkema, BASF, and Huntsman Corporation are actively engaged in research and development, focusing on innovation and strategic partnerships to enhance their market positions.
The competitive landscape is marked by the presence of both large multinational corporations and smaller specialized companies. The market exhibits a trend towards consolidation, with mergers and acquisitions becoming increasingly common. The future growth of the polyester polyol market hinges on continued innovation in product development, particularly concerning sustainability and performance enhancement. This includes the exploration of bio-based raw materials and the development of polyols with improved properties like enhanced durability, flexibility, and reduced environmental impact. Furthermore, the increasing focus on sustainable and environmentally responsible manufacturing practices will play a crucial role in shaping the future trajectory of the market. The market's future success will depend upon its ability to adapt to evolving consumer preferences and regulatory changes, focusing on innovative solutions that meet the demands of a growing and increasingly eco-conscious global market.
This comprehensive report provides an in-depth analysis of the global Polyester Polyol industry, offering invaluable insights for stakeholders across the value chain. With a detailed study period spanning from 2019 to 2033, a base year of 2025, and an estimated year of 2025, this report projects market trends and forecasts growth from 2025 to 2033. The report covers key market segments, competitive dynamics, leading players, and future growth opportunities, providing a complete understanding of this Billion-dollar market.
Polyester Polyol Industry Market Structure & Competitive Dynamics
The Polyester Polyol market is characterized by a moderately concentrated structure, with several key players holding significant market share. The industry exhibits a dynamic competitive landscape driven by continuous innovation, strategic mergers and acquisitions (M&A), and evolving regulatory frameworks. Market concentration is estimated at xx%, with the top five players commanding approximately xx% of the global market share in 2024. These leading players are actively involved in research and development, striving for improved product performance, cost reduction, and enhanced sustainability. The regulatory landscape varies across regions, impacting production processes and product formulations. The industry also faces competitive pressures from substitute materials, such as polyether polyols. Significant M&A activities have shaped the industry's structure, with notable transactions such as Stepan Company's acquisition of INVISTA's aromatic polyester polyol business in 2021 valued at several Billion dollars. Future M&A activity is expected to further consolidate the market.
- Market Concentration: xx% (2024)
- Top 5 Players Market Share: xx% (2024)
- Significant M&A Deals: Stepan Company’s acquisition of INVISTA's aromatic polyester polyol business (2021), valued at Billion dollars.
- Key Competitive Factors: Innovation, Cost Efficiency, Sustainability, Regulatory Compliance.
Polyester Polyol Industry Industry Trends & Insights
The global Polyester Polyol market is experiencing robust growth, driven by increasing demand from various end-use industries, particularly CASE (Coatings, Adhesives, Sealants, Elastomers), flexible foams, and rigid foams. The market's Compound Annual Growth Rate (CAGR) is projected at xx% during the forecast period (2025-2033), reaching a market size of xx Billion dollars by 2033. This growth is fueled by factors such as rising construction activities globally, increasing automotive production, and growing demand for flexible and rigid polyurethane foams in furniture, bedding, and insulation applications. Technological advancements, such as the development of bio-based polyester polyols and high-performance formulations, are further propelling market expansion. However, fluctuations in raw material prices and stringent environmental regulations present challenges to the industry. Market penetration is increasing in developing economies due to rising disposable incomes and infrastructural development.
Dominant Markets & Segments in Polyester Polyol Industry
The Asia-Pacific region dominates the global Polyester Polyol market, driven by rapid economic growth, significant infrastructural development, and substantial demand from the automotive and construction sectors. Within the product segments, aromatic polyester polyols hold a larger market share than aliphatic polyester polyols due to their superior properties in several applications. The CASE segment constitutes a major share of the market, fueled by high demand from the coatings industry. Flexible foam applications, primarily in furniture and bedding, also contribute significantly to market growth.
- Key Drivers in Asia-Pacific: Rapid economic growth, robust construction activities, automotive manufacturing expansion.
- Dominant Segment (Type): Aromatic Polyester Polyols (Reasons: Superior performance characteristics in several key applications)
- Dominant Segment (Application): CASE (Coatings, Adhesives, Sealants, Elastomers) (Reasons: High demand from the coatings industry)
Polyester Polyol Industry Product Innovations
Recent product innovations in the polyester polyol industry focus on developing sustainable and high-performance materials. Companies are investing heavily in research and development to introduce bio-based polyester polyols derived from renewable resources, reducing reliance on petroleum-based feedstocks and enhancing environmental sustainability. Furthermore, advancements in formulation chemistry are leading to improved performance characteristics, such as enhanced flexibility, durability, and resistance to degradation. These innovations cater to the growing demand for environmentally friendly and high-performance materials across various applications, driving market expansion.
Report Segmentation & Scope
This report segments the Polyester Polyol market based on Type (Aliphatic Polyester Polyols, Aromatic Polyester Polyols) and Application (CASE, Flexible Foam, Rigid Foam, Others). Each segment's growth projections, market sizes, and competitive dynamics are analyzed comprehensively. Aliphatic Polyester Polyols segment is expected to grow at xx% CAGR while Aromatic Polyester Polyols segment is predicted to grow at xx% CAGR during the forecast period. The CASE application segment exhibits the highest growth potential. Competitive landscapes within each segment are analyzed, considering factors such as market share, pricing strategies, and technological capabilities.
Key Drivers of Polyester Polyol Industry Growth
The growth of the Polyester Polyol industry is propelled by several factors: the expanding construction sector, the booming automotive industry, and the increasing demand for comfortable and durable furniture and bedding. Technological advancements, such as the development of bio-based polyester polyols, are also contributing to market expansion. Government initiatives promoting sustainable materials are further bolstering industry growth. The continuous innovation in formulation chemistry to meet the specific requirements of various applications also drives market demand.
Challenges in the Polyester Polyol Industry Sector
The Polyester Polyol industry faces challenges like fluctuating raw material prices (crude oil) impacting production costs. Stringent environmental regulations and the rising cost of compliance pose significant hurdles. Intense competition from substitute materials and the need for continuous innovation to maintain a competitive edge are other factors limiting the growth of this Billion dollar industry. Supply chain disruptions and geopolitical instability can also have a major impact on production and distribution.
Leading Players in the Polyester Polyol Industry Market
- Arkema
- BASF
- Townsend Chemicals P/L
- Arpadis
- Stepan Company
- Alfa Chemicals
- TRiiSO LLC
- Dow
- TER HELL & Co GmbH
- Oleon NV
- DIC CORPORATION
- Huntsman Corporation
- PCC SE
- Purinova Sp z o o
- Evonik
Key Developments in Polyester Polyol Industry Sector
- December 2020: Huntsman Corporation opened a new Terol aromatic polyester polyols factory in Kuan Yin, Taiwan, with a capacity of 22,000 tonnes. This expansion significantly increased the production capacity for aromatic polyester polyols, impacting market supply and competition.
- January 2021: Stepan Company acquired INVISTA's aromatic polyester polyol business, expanding its market share and product portfolio significantly. This acquisition resulted in a major shift in market dynamics, impacting competition and potentially prices.
Strategic Polyester Polyol Industry Market Outlook
The future of the Polyester Polyol market looks promising, driven by sustained growth in key end-use sectors. Strategic opportunities lie in developing sustainable and high-performance products that meet the evolving needs of consumers and industries. Focus on innovation, cost efficiency, and sustainability will be crucial for success. Expanding into new and emerging markets, especially in developing economies, also presents significant growth potential. Companies that effectively manage raw material costs and comply with stringent environmental regulations are poised for greater success.
Polyester Polyol Industry Segmentation
-
1. Type
- 1.1. Aliphatic Polyester Polyols
- 1.2. Aromatic Polyester Polyols
-
2. Application
- 2.1. CASE (Coating, Adhesives, Sealants, Elastomers)
- 2.2. Flexible Foam
- 2.3. Rigid Foam
- 2.4. Others
Polyester Polyol Industry Segmentation By Geography
-
1. Asia Pacific
- 1.1. China
- 1.2. India
- 1.3. Japan
- 1.4. South Korea
- 1.5. Rest of Asia Pacific
-
2. North America
- 2.1. United States
- 2.2. Canada
- 2.3. Mexico
-
3. Europe
- 3.1. Germany
- 3.2. United Kingdom
- 3.3. Italy
- 3.4. France
- 3.5. Rest of Europe
-
4. South America
- 4.1. Brazil
- 4.2. Argentina
- 4.3. Rest of South America
-
5. Middle East and Africa
- 5.1. Saudi Arabia
- 5.2. South Africa
- 5.3. Rest of Middle East and Africa
Polyester Polyol Industry REPORT HIGHLIGHTS
| Aspects | Details |
|---|---|
| Study Period | 2019-2033 |
| Base Year | 2024 |
| Estimated Year | 2025 |
| Forecast Period | 2025-2033 |
| Historical Period | 2019-2024 |
| Growth Rate | CAGR of 5.5% from 2019-2033 |
| Segmentation |
|
Table of Contents
- 1. Introduction
- 1.1. Research Scope
- 1.2. Market Segmentation
- 1.3. Research Methodology
- 1.4. Definitions and Assumptions
- 2. Executive Summary
- 2.1. Introduction
- 3. Market Dynamics
- 3.1. Introduction
- 3.2. Market Drivers
- 3.2.1. Increase Usage for Aromatic Polyester polyol; Increasing Demand for PU Foam in Various Applications
- 3.3. Market Restrains
- 3.3.1. Increasing Price of Raw Material
- 3.4. Market Trends
- 3.4.1. Flexible Foam Segment Dominates the Market
- 4. Market Factor Analysis
- 4.1. Porters Five Forces
- 4.2. Supply/Value Chain
- 4.3. PESTEL analysis
- 4.4. Market Entropy
- 4.5. Patent/Trademark Analysis
- 5. Global Polyester Polyol Industry Analysis, Insights and Forecast, 2019-2031
- 5.1. Market Analysis, Insights and Forecast - by Type
- 5.1.1. Aliphatic Polyester Polyols
- 5.1.2. Aromatic Polyester Polyols
- 5.2. Market Analysis, Insights and Forecast - by Application
- 5.2.1. CASE (Coating, Adhesives, Sealants, Elastomers)
- 5.2.2. Flexible Foam
- 5.2.3. Rigid Foam
- 5.2.4. Others
- 5.3. Market Analysis, Insights and Forecast - by Region
- 5.3.1. Asia Pacific
- 5.3.2. North America
- 5.3.3. Europe
- 5.3.4. South America
- 5.3.5. Middle East and Africa
- 5.1. Market Analysis, Insights and Forecast - by Type
- 6. Asia Pacific Polyester Polyol Industry Analysis, Insights and Forecast, 2019-2031
- 6.1. Market Analysis, Insights and Forecast - by Type
- 6.1.1. Aliphatic Polyester Polyols
- 6.1.2. Aromatic Polyester Polyols
- 6.2. Market Analysis, Insights and Forecast - by Application
- 6.2.1. CASE (Coating, Adhesives, Sealants, Elastomers)
- 6.2.2. Flexible Foam
- 6.2.3. Rigid Foam
- 6.2.4. Others
- 6.1. Market Analysis, Insights and Forecast - by Type
- 7. North America Polyester Polyol Industry Analysis, Insights and Forecast, 2019-2031
- 7.1. Market Analysis, Insights and Forecast - by Type
- 7.1.1. Aliphatic Polyester Polyols
- 7.1.2. Aromatic Polyester Polyols
- 7.2. Market Analysis, Insights and Forecast - by Application
- 7.2.1. CASE (Coating, Adhesives, Sealants, Elastomers)
- 7.2.2. Flexible Foam
- 7.2.3. Rigid Foam
- 7.2.4. Others
- 7.1. Market Analysis, Insights and Forecast - by Type
- 8. Europe Polyester Polyol Industry Analysis, Insights and Forecast, 2019-2031
- 8.1. Market Analysis, Insights and Forecast - by Type
- 8.1.1. Aliphatic Polyester Polyols
- 8.1.2. Aromatic Polyester Polyols
- 8.2. Market Analysis, Insights and Forecast - by Application
- 8.2.1. CASE (Coating, Adhesives, Sealants, Elastomers)
- 8.2.2. Flexible Foam
- 8.2.3. Rigid Foam
- 8.2.4. Others
- 8.1. Market Analysis, Insights and Forecast - by Type
- 9. South America Polyester Polyol Industry Analysis, Insights and Forecast, 2019-2031
- 9.1. Market Analysis, Insights and Forecast - by Type
- 9.1.1. Aliphatic Polyester Polyols
- 9.1.2. Aromatic Polyester Polyols
- 9.2. Market Analysis, Insights and Forecast - by Application
- 9.2.1. CASE (Coating, Adhesives, Sealants, Elastomers)
- 9.2.2. Flexible Foam
- 9.2.3. Rigid Foam
- 9.2.4. Others
- 9.1. Market Analysis, Insights and Forecast - by Type
- 10. Middle East and Africa Polyester Polyol Industry Analysis, Insights and Forecast, 2019-2031
- 10.1. Market Analysis, Insights and Forecast - by Type
- 10.1.1. Aliphatic Polyester Polyols
- 10.1.2. Aromatic Polyester Polyols
- 10.2. Market Analysis, Insights and Forecast - by Application
- 10.2.1. CASE (Coating, Adhesives, Sealants, Elastomers)
- 10.2.2. Flexible Foam
- 10.2.3. Rigid Foam
- 10.2.4. Others
- 10.1. Market Analysis, Insights and Forecast - by Type
- 11. North America Polyester Polyol Industry Analysis, Insights and Forecast, 2019-2031
- 11.1. Market Analysis, Insights and Forecast - By Country/Sub-region
- 11.1.1 United States
- 11.1.2 Canada
- 11.1.3 Mexico
- 12. Europe Polyester Polyol Industry Analysis, Insights and Forecast, 2019-2031
- 12.1. Market Analysis, Insights and Forecast - By Country/Sub-region
- 12.1.1 Germany
- 12.1.2 France
- 12.1.3 Italy
- 12.1.4 United Kingdom
- 12.1.5 Netherlands
- 12.1.6 Rest of Europe
- 13. Asia Pacific Polyester Polyol Industry Analysis, Insights and Forecast, 2019-2031
- 13.1. Market Analysis, Insights and Forecast - By Country/Sub-region
- 13.1.1 China
- 13.1.2 Japan
- 13.1.3 India
- 13.1.4 South Korea
- 13.1.5 Taiwan
- 13.1.6 Australia
- 13.1.7 Rest of Asia-Pacific
- 14. South America Polyester Polyol Industry Analysis, Insights and Forecast, 2019-2031
- 14.1. Market Analysis, Insights and Forecast - By Country/Sub-region
- 14.1.1 Brazil
- 14.1.2 Argentina
- 14.1.3 Rest of South America
- 15. MEA Polyester Polyol Industry Analysis, Insights and Forecast, 2019-2031
- 15.1. Market Analysis, Insights and Forecast - By Country/Sub-region
- 15.1.1 Middle East
- 15.1.2 Africa
- 16. Competitive Analysis
- 16.1. Global Market Share Analysis 2024
- 16.2. Company Profiles
- 16.2.1 Arkema
- 16.2.1.1. Overview
- 16.2.1.2. Products
- 16.2.1.3. SWOT Analysis
- 16.2.1.4. Recent Developments
- 16.2.1.5. Financials (Based on Availability)
- 16.2.2 BASF
- 16.2.2.1. Overview
- 16.2.2.2. Products
- 16.2.2.3. SWOT Analysis
- 16.2.2.4. Recent Developments
- 16.2.2.5. Financials (Based on Availability)
- 16.2.3 Townsend Chemicals P/L
- 16.2.3.1. Overview
- 16.2.3.2. Products
- 16.2.3.3. SWOT Analysis
- 16.2.3.4. Recent Developments
- 16.2.3.5. Financials (Based on Availability)
- 16.2.4 Arpadis
- 16.2.4.1. Overview
- 16.2.4.2. Products
- 16.2.4.3. SWOT Analysis
- 16.2.4.4. Recent Developments
- 16.2.4.5. Financials (Based on Availability)
- 16.2.5 Stepan Company
- 16.2.5.1. Overview
- 16.2.5.2. Products
- 16.2.5.3. SWOT Analysis
- 16.2.5.4. Recent Developments
- 16.2.5.5. Financials (Based on Availability)
- 16.2.6 Alfa Chemicals
- 16.2.6.1. Overview
- 16.2.6.2. Products
- 16.2.6.3. SWOT Analysis
- 16.2.6.4. Recent Developments
- 16.2.6.5. Financials (Based on Availability)
- 16.2.7 TRiiSO LLC
- 16.2.7.1. Overview
- 16.2.7.2. Products
- 16.2.7.3. SWOT Analysis
- 16.2.7.4. Recent Developments
- 16.2.7.5. Financials (Based on Availability)
- 16.2.8 Dow
- 16.2.8.1. Overview
- 16.2.8.2. Products
- 16.2.8.3. SWOT Analysis
- 16.2.8.4. Recent Developments
- 16.2.8.5. Financials (Based on Availability)
- 16.2.9 TER HELL & Co GmbH
- 16.2.9.1. Overview
- 16.2.9.2. Products
- 16.2.9.3. SWOT Analysis
- 16.2.9.4. Recent Developments
- 16.2.9.5. Financials (Based on Availability)
- 16.2.10 Oleon NV
- 16.2.10.1. Overview
- 16.2.10.2. Products
- 16.2.10.3. SWOT Analysis
- 16.2.10.4. Recent Developments
- 16.2.10.5. Financials (Based on Availability)
- 16.2.11 DIC CORPORATION
- 16.2.11.1. Overview
- 16.2.11.2. Products
- 16.2.11.3. SWOT Analysis
- 16.2.11.4. Recent Developments
- 16.2.11.5. Financials (Based on Availability)
- 16.2.12 Huntsman Corporation
- 16.2.12.1. Overview
- 16.2.12.2. Products
- 16.2.12.3. SWOT Analysis
- 16.2.12.4. Recent Developments
- 16.2.12.5. Financials (Based on Availability)
- 16.2.13 PCC SE
- 16.2.13.1. Overview
- 16.2.13.2. Products
- 16.2.13.3. SWOT Analysis
- 16.2.13.4. Recent Developments
- 16.2.13.5. Financials (Based on Availability)
- 16.2.14 Purinova Sp z o o
- 16.2.14.1. Overview
- 16.2.14.2. Products
- 16.2.14.3. SWOT Analysis
- 16.2.14.4. Recent Developments
- 16.2.14.5. Financials (Based on Availability)
- 16.2.15 Evonik
- 16.2.15.1. Overview
- 16.2.15.2. Products
- 16.2.15.3. SWOT Analysis
- 16.2.15.4. Recent Developments
- 16.2.15.5. Financials (Based on Availability)
- 16.2.1 Arkema
List of Figures
- Figure 1: Global Polyester Polyol Industry Revenue Breakdown (Billion, %) by Region 2024 & 2032
- Figure 2: Global Polyester Polyol Industry Volume Breakdown (K Tons, %) by Region 2024 & 2032
- Figure 3: North America Polyester Polyol Industry Revenue (Billion), by Country 2024 & 2032
- Figure 4: North America Polyester Polyol Industry Volume (K Tons), by Country 2024 & 2032
- Figure 5: North America Polyester Polyol Industry Revenue Share (%), by Country 2024 & 2032
- Figure 6: North America Polyester Polyol Industry Volume Share (%), by Country 2024 & 2032
- Figure 7: Europe Polyester Polyol Industry Revenue (Billion), by Country 2024 & 2032
- Figure 8: Europe Polyester Polyol Industry Volume (K Tons), by Country 2024 & 2032
- Figure 9: Europe Polyester Polyol Industry Revenue Share (%), by Country 2024 & 2032
- Figure 10: Europe Polyester Polyol Industry Volume Share (%), by Country 2024 & 2032
- Figure 11: Asia Pacific Polyester Polyol Industry Revenue (Billion), by Country 2024 & 2032
- Figure 12: Asia Pacific Polyester Polyol Industry Volume (K Tons), by Country 2024 & 2032
- Figure 13: Asia Pacific Polyester Polyol Industry Revenue Share (%), by Country 2024 & 2032
- Figure 14: Asia Pacific Polyester Polyol Industry Volume Share (%), by Country 2024 & 2032
- Figure 15: South America Polyester Polyol Industry Revenue (Billion), by Country 2024 & 2032
- Figure 16: South America Polyester Polyol Industry Volume (K Tons), by Country 2024 & 2032
- Figure 17: South America Polyester Polyol Industry Revenue Share (%), by Country 2024 & 2032
- Figure 18: South America Polyester Polyol Industry Volume Share (%), by Country 2024 & 2032
- Figure 19: MEA Polyester Polyol Industry Revenue (Billion), by Country 2024 & 2032
- Figure 20: MEA Polyester Polyol Industry Volume (K Tons), by Country 2024 & 2032
- Figure 21: MEA Polyester Polyol Industry Revenue Share (%), by Country 2024 & 2032
- Figure 22: MEA Polyester Polyol Industry Volume Share (%), by Country 2024 & 2032
- Figure 23: Asia Pacific Polyester Polyol Industry Revenue (Billion), by Type 2024 & 2032
- Figure 24: Asia Pacific Polyester Polyol Industry Volume (K Tons), by Type 2024 & 2032
- Figure 25: Asia Pacific Polyester Polyol Industry Revenue Share (%), by Type 2024 & 2032
- Figure 26: Asia Pacific Polyester Polyol Industry Volume Share (%), by Type 2024 & 2032
- Figure 27: Asia Pacific Polyester Polyol Industry Revenue (Billion), by Application 2024 & 2032
- Figure 28: Asia Pacific Polyester Polyol Industry Volume (K Tons), by Application 2024 & 2032
- Figure 29: Asia Pacific Polyester Polyol Industry Revenue Share (%), by Application 2024 & 2032
- Figure 30: Asia Pacific Polyester Polyol Industry Volume Share (%), by Application 2024 & 2032
- Figure 31: Asia Pacific Polyester Polyol Industry Revenue (Billion), by Country 2024 & 2032
- Figure 32: Asia Pacific Polyester Polyol Industry Volume (K Tons), by Country 2024 & 2032
- Figure 33: Asia Pacific Polyester Polyol Industry Revenue Share (%), by Country 2024 & 2032
- Figure 34: Asia Pacific Polyester Polyol Industry Volume Share (%), by Country 2024 & 2032
- Figure 35: North America Polyester Polyol Industry Revenue (Billion), by Type 2024 & 2032
- Figure 36: North America Polyester Polyol Industry Volume (K Tons), by Type 2024 & 2032
- Figure 37: North America Polyester Polyol Industry Revenue Share (%), by Type 2024 & 2032
- Figure 38: North America Polyester Polyol Industry Volume Share (%), by Type 2024 & 2032
- Figure 39: North America Polyester Polyol Industry Revenue (Billion), by Application 2024 & 2032
- Figure 40: North America Polyester Polyol Industry Volume (K Tons), by Application 2024 & 2032
- Figure 41: North America Polyester Polyol Industry Revenue Share (%), by Application 2024 & 2032
- Figure 42: North America Polyester Polyol Industry Volume Share (%), by Application 2024 & 2032
- Figure 43: North America Polyester Polyol Industry Revenue (Billion), by Country 2024 & 2032
- Figure 44: North America Polyester Polyol Industry Volume (K Tons), by Country 2024 & 2032
- Figure 45: North America Polyester Polyol Industry Revenue Share (%), by Country 2024 & 2032
- Figure 46: North America Polyester Polyol Industry Volume Share (%), by Country 2024 & 2032
- Figure 47: Europe Polyester Polyol Industry Revenue (Billion), by Type 2024 & 2032
- Figure 48: Europe Polyester Polyol Industry Volume (K Tons), by Type 2024 & 2032
- Figure 49: Europe Polyester Polyol Industry Revenue Share (%), by Type 2024 & 2032
- Figure 50: Europe Polyester Polyol Industry Volume Share (%), by Type 2024 & 2032
- Figure 51: Europe Polyester Polyol Industry Revenue (Billion), by Application 2024 & 2032
- Figure 52: Europe Polyester Polyol Industry Volume (K Tons), by Application 2024 & 2032
- Figure 53: Europe Polyester Polyol Industry Revenue Share (%), by Application 2024 & 2032
- Figure 54: Europe Polyester Polyol Industry Volume Share (%), by Application 2024 & 2032
- Figure 55: Europe Polyester Polyol Industry Revenue (Billion), by Country 2024 & 2032
- Figure 56: Europe Polyester Polyol Industry Volume (K Tons), by Country 2024 & 2032
- Figure 57: Europe Polyester Polyol Industry Revenue Share (%), by Country 2024 & 2032
- Figure 58: Europe Polyester Polyol Industry Volume Share (%), by Country 2024 & 2032
- Figure 59: South America Polyester Polyol Industry Revenue (Billion), by Type 2024 & 2032
- Figure 60: South America Polyester Polyol Industry Volume (K Tons), by Type 2024 & 2032
- Figure 61: South America Polyester Polyol Industry Revenue Share (%), by Type 2024 & 2032
- Figure 62: South America Polyester Polyol Industry Volume Share (%), by Type 2024 & 2032
- Figure 63: South America Polyester Polyol Industry Revenue (Billion), by Application 2024 & 2032
- Figure 64: South America Polyester Polyol Industry Volume (K Tons), by Application 2024 & 2032
- Figure 65: South America Polyester Polyol Industry Revenue Share (%), by Application 2024 & 2032
- Figure 66: South America Polyester Polyol Industry Volume Share (%), by Application 2024 & 2032
- Figure 67: South America Polyester Polyol Industry Revenue (Billion), by Country 2024 & 2032
- Figure 68: South America Polyester Polyol Industry Volume (K Tons), by Country 2024 & 2032
- Figure 69: South America Polyester Polyol Industry Revenue Share (%), by Country 2024 & 2032
- Figure 70: South America Polyester Polyol Industry Volume Share (%), by Country 2024 & 2032
- Figure 71: Middle East and Africa Polyester Polyol Industry Revenue (Billion), by Type 2024 & 2032
- Figure 72: Middle East and Africa Polyester Polyol Industry Volume (K Tons), by Type 2024 & 2032
- Figure 73: Middle East and Africa Polyester Polyol Industry Revenue Share (%), by Type 2024 & 2032
- Figure 74: Middle East and Africa Polyester Polyol Industry Volume Share (%), by Type 2024 & 2032
- Figure 75: Middle East and Africa Polyester Polyol Industry Revenue (Billion), by Application 2024 & 2032
- Figure 76: Middle East and Africa Polyester Polyol Industry Volume (K Tons), by Application 2024 & 2032
- Figure 77: Middle East and Africa Polyester Polyol Industry Revenue Share (%), by Application 2024 & 2032
- Figure 78: Middle East and Africa Polyester Polyol Industry Volume Share (%), by Application 2024 & 2032
- Figure 79: Middle East and Africa Polyester Polyol Industry Revenue (Billion), by Country 2024 & 2032
- Figure 80: Middle East and Africa Polyester Polyol Industry Volume (K Tons), by Country 2024 & 2032
- Figure 81: Middle East and Africa Polyester Polyol Industry Revenue Share (%), by Country 2024 & 2032
- Figure 82: Middle East and Africa Polyester Polyol Industry Volume Share (%), by Country 2024 & 2032
List of Tables
- Table 1: Global Polyester Polyol Industry Revenue Billion Forecast, by Region 2019 & 2032
- Table 2: Global Polyester Polyol Industry Volume K Tons Forecast, by Region 2019 & 2032
- Table 3: Global Polyester Polyol Industry Revenue Billion Forecast, by Type 2019 & 2032
- Table 4: Global Polyester Polyol Industry Volume K Tons Forecast, by Type 2019 & 2032
- Table 5: Global Polyester Polyol Industry Revenue Billion Forecast, by Application 2019 & 2032
- Table 6: Global Polyester Polyol Industry Volume K Tons Forecast, by Application 2019 & 2032
- Table 7: Global Polyester Polyol Industry Revenue Billion Forecast, by Region 2019 & 2032
- Table 8: Global Polyester Polyol Industry Volume K Tons Forecast, by Region 2019 & 2032
- Table 9: Global Polyester Polyol Industry Revenue Billion Forecast, by Country 2019 & 2032
- Table 10: Global Polyester Polyol Industry Volume K Tons Forecast, by Country 2019 & 2032
- Table 11: United States Polyester Polyol Industry Revenue (Billion) Forecast, by Application 2019 & 2032
- Table 12: United States Polyester Polyol Industry Volume (K Tons) Forecast, by Application 2019 & 2032
- Table 13: Canada Polyester Polyol Industry Revenue (Billion) Forecast, by Application 2019 & 2032
- Table 14: Canada Polyester Polyol Industry Volume (K Tons) Forecast, by Application 2019 & 2032
- Table 15: Mexico Polyester Polyol Industry Revenue (Billion) Forecast, by Application 2019 & 2032
- Table 16: Mexico Polyester Polyol Industry Volume (K Tons) Forecast, by Application 2019 & 2032
- Table 17: Global Polyester Polyol Industry Revenue Billion Forecast, by Country 2019 & 2032
- Table 18: Global Polyester Polyol Industry Volume K Tons Forecast, by Country 2019 & 2032
- Table 19: Germany Polyester Polyol Industry Revenue (Billion) Forecast, by Application 2019 & 2032
- Table 20: Germany Polyester Polyol Industry Volume (K Tons) Forecast, by Application 2019 & 2032
- Table 21: France Polyester Polyol Industry Revenue (Billion) Forecast, by Application 2019 & 2032
- Table 22: France Polyester Polyol Industry Volume (K Tons) Forecast, by Application 2019 & 2032
- Table 23: Italy Polyester Polyol Industry Revenue (Billion) Forecast, by Application 2019 & 2032
- Table 24: Italy Polyester Polyol Industry Volume (K Tons) Forecast, by Application 2019 & 2032
- Table 25: United Kingdom Polyester Polyol Industry Revenue (Billion) Forecast, by Application 2019 & 2032
- Table 26: United Kingdom Polyester Polyol Industry Volume (K Tons) Forecast, by Application 2019 & 2032
- Table 27: Netherlands Polyester Polyol Industry Revenue (Billion) Forecast, by Application 2019 & 2032
- Table 28: Netherlands Polyester Polyol Industry Volume (K Tons) Forecast, by Application 2019 & 2032
- Table 29: Rest of Europe Polyester Polyol Industry Revenue (Billion) Forecast, by Application 2019 & 2032
- Table 30: Rest of Europe Polyester Polyol Industry Volume (K Tons) Forecast, by Application 2019 & 2032
- Table 31: Global Polyester Polyol Industry Revenue Billion Forecast, by Country 2019 & 2032
- Table 32: Global Polyester Polyol Industry Volume K Tons Forecast, by Country 2019 & 2032
- Table 33: China Polyester Polyol Industry Revenue (Billion) Forecast, by Application 2019 & 2032
- Table 34: China Polyester Polyol Industry Volume (K Tons) Forecast, by Application 2019 & 2032
- Table 35: Japan Polyester Polyol Industry Revenue (Billion) Forecast, by Application 2019 & 2032
- Table 36: Japan Polyester Polyol Industry Volume (K Tons) Forecast, by Application 2019 & 2032
- Table 37: India Polyester Polyol Industry Revenue (Billion) Forecast, by Application 2019 & 2032
- Table 38: India Polyester Polyol Industry Volume (K Tons) Forecast, by Application 2019 & 2032
- Table 39: South Korea Polyester Polyol Industry Revenue (Billion) Forecast, by Application 2019 & 2032
- Table 40: South Korea Polyester Polyol Industry Volume (K Tons) Forecast, by Application 2019 & 2032
- Table 41: Taiwan Polyester Polyol Industry Revenue (Billion) Forecast, by Application 2019 & 2032
- Table 42: Taiwan Polyester Polyol Industry Volume (K Tons) Forecast, by Application 2019 & 2032
- Table 43: Australia Polyester Polyol Industry Revenue (Billion) Forecast, by Application 2019 & 2032
- Table 44: Australia Polyester Polyol Industry Volume (K Tons) Forecast, by Application 2019 & 2032
- Table 45: Rest of Asia-Pacific Polyester Polyol Industry Revenue (Billion) Forecast, by Application 2019 & 2032
- Table 46: Rest of Asia-Pacific Polyester Polyol Industry Volume (K Tons) Forecast, by Application 2019 & 2032
- Table 47: Global Polyester Polyol Industry Revenue Billion Forecast, by Country 2019 & 2032
- Table 48: Global Polyester Polyol Industry Volume K Tons Forecast, by Country 2019 & 2032
- Table 49: Brazil Polyester Polyol Industry Revenue (Billion) Forecast, by Application 2019 & 2032
- Table 50: Brazil Polyester Polyol Industry Volume (K Tons) Forecast, by Application 2019 & 2032
- Table 51: Argentina Polyester Polyol Industry Revenue (Billion) Forecast, by Application 2019 & 2032
- Table 52: Argentina Polyester Polyol Industry Volume (K Tons) Forecast, by Application 2019 & 2032
- Table 53: Rest of South America Polyester Polyol Industry Revenue (Billion) Forecast, by Application 2019 & 2032
- Table 54: Rest of South America Polyester Polyol Industry Volume (K Tons) Forecast, by Application 2019 & 2032
- Table 55: Global Polyester Polyol Industry Revenue Billion Forecast, by Country 2019 & 2032
- Table 56: Global Polyester Polyol Industry Volume K Tons Forecast, by Country 2019 & 2032
- Table 57: Middle East Polyester Polyol Industry Revenue (Billion) Forecast, by Application 2019 & 2032
- Table 58: Middle East Polyester Polyol Industry Volume (K Tons) Forecast, by Application 2019 & 2032
- Table 59: Africa Polyester Polyol Industry Revenue (Billion) Forecast, by Application 2019 & 2032
- Table 60: Africa Polyester Polyol Industry Volume (K Tons) Forecast, by Application 2019 & 2032
- Table 61: Global Polyester Polyol Industry Revenue Billion Forecast, by Type 2019 & 2032
- Table 62: Global Polyester Polyol Industry Volume K Tons Forecast, by Type 2019 & 2032
- Table 63: Global Polyester Polyol Industry Revenue Billion Forecast, by Application 2019 & 2032
- Table 64: Global Polyester Polyol Industry Volume K Tons Forecast, by Application 2019 & 2032
- Table 65: Global Polyester Polyol Industry Revenue Billion Forecast, by Country 2019 & 2032
- Table 66: Global Polyester Polyol Industry Volume K Tons Forecast, by Country 2019 & 2032
- Table 67: China Polyester Polyol Industry Revenue (Billion) Forecast, by Application 2019 & 2032
- Table 68: China Polyester Polyol Industry Volume (K Tons) Forecast, by Application 2019 & 2032
- Table 69: India Polyester Polyol Industry Revenue (Billion) Forecast, by Application 2019 & 2032
- Table 70: India Polyester Polyol Industry Volume (K Tons) Forecast, by Application 2019 & 2032
- Table 71: Japan Polyester Polyol Industry Revenue (Billion) Forecast, by Application 2019 & 2032
- Table 72: Japan Polyester Polyol Industry Volume (K Tons) Forecast, by Application 2019 & 2032
- Table 73: South Korea Polyester Polyol Industry Revenue (Billion) Forecast, by Application 2019 & 2032
- Table 74: South Korea Polyester Polyol Industry Volume (K Tons) Forecast, by Application 2019 & 2032
- Table 75: Rest of Asia Pacific Polyester Polyol Industry Revenue (Billion) Forecast, by Application 2019 & 2032
- Table 76: Rest of Asia Pacific Polyester Polyol Industry Volume (K Tons) Forecast, by Application 2019 & 2032
- Table 77: Global Polyester Polyol Industry Revenue Billion Forecast, by Type 2019 & 2032
- Table 78: Global Polyester Polyol Industry Volume K Tons Forecast, by Type 2019 & 2032
- Table 79: Global Polyester Polyol Industry Revenue Billion Forecast, by Application 2019 & 2032
- Table 80: Global Polyester Polyol Industry Volume K Tons Forecast, by Application 2019 & 2032
- Table 81: Global Polyester Polyol Industry Revenue Billion Forecast, by Country 2019 & 2032
- Table 82: Global Polyester Polyol Industry Volume K Tons Forecast, by Country 2019 & 2032
- Table 83: United States Polyester Polyol Industry Revenue (Billion) Forecast, by Application 2019 & 2032
- Table 84: United States Polyester Polyol Industry Volume (K Tons) Forecast, by Application 2019 & 2032
- Table 85: Canada Polyester Polyol Industry Revenue (Billion) Forecast, by Application 2019 & 2032
- Table 86: Canada Polyester Polyol Industry Volume (K Tons) Forecast, by Application 2019 & 2032
- Table 87: Mexico Polyester Polyol Industry Revenue (Billion) Forecast, by Application 2019 & 2032
- Table 88: Mexico Polyester Polyol Industry Volume (K Tons) Forecast, by Application 2019 & 2032
- Table 89: Global Polyester Polyol Industry Revenue Billion Forecast, by Type 2019 & 2032
- Table 90: Global Polyester Polyol Industry Volume K Tons Forecast, by Type 2019 & 2032
- Table 91: Global Polyester Polyol Industry Revenue Billion Forecast, by Application 2019 & 2032
- Table 92: Global Polyester Polyol Industry Volume K Tons Forecast, by Application 2019 & 2032
- Table 93: Global Polyester Polyol Industry Revenue Billion Forecast, by Country 2019 & 2032
- Table 94: Global Polyester Polyol Industry Volume K Tons Forecast, by Country 2019 & 2032
- Table 95: Germany Polyester Polyol Industry Revenue (Billion) Forecast, by Application 2019 & 2032
- Table 96: Germany Polyester Polyol Industry Volume (K Tons) Forecast, by Application 2019 & 2032
- Table 97: United Kingdom Polyester Polyol Industry Revenue (Billion) Forecast, by Application 2019 & 2032
- Table 98: United Kingdom Polyester Polyol Industry Volume (K Tons) Forecast, by Application 2019 & 2032
- Table 99: Italy Polyester Polyol Industry Revenue (Billion) Forecast, by Application 2019 & 2032
- Table 100: Italy Polyester Polyol Industry Volume (K Tons) Forecast, by Application 2019 & 2032
- Table 101: France Polyester Polyol Industry Revenue (Billion) Forecast, by Application 2019 & 2032
- Table 102: France Polyester Polyol Industry Volume (K Tons) Forecast, by Application 2019 & 2032
- Table 103: Rest of Europe Polyester Polyol Industry Revenue (Billion) Forecast, by Application 2019 & 2032
- Table 104: Rest of Europe Polyester Polyol Industry Volume (K Tons) Forecast, by Application 2019 & 2032
- Table 105: Global Polyester Polyol Industry Revenue Billion Forecast, by Type 2019 & 2032
- Table 106: Global Polyester Polyol Industry Volume K Tons Forecast, by Type 2019 & 2032
- Table 107: Global Polyester Polyol Industry Revenue Billion Forecast, by Application 2019 & 2032
- Table 108: Global Polyester Polyol Industry Volume K Tons Forecast, by Application 2019 & 2032
- Table 109: Global Polyester Polyol Industry Revenue Billion Forecast, by Country 2019 & 2032
- Table 110: Global Polyester Polyol Industry Volume K Tons Forecast, by Country 2019 & 2032
- Table 111: Brazil Polyester Polyol Industry Revenue (Billion) Forecast, by Application 2019 & 2032
- Table 112: Brazil Polyester Polyol Industry Volume (K Tons) Forecast, by Application 2019 & 2032
- Table 113: Argentina Polyester Polyol Industry Revenue (Billion) Forecast, by Application 2019 & 2032
- Table 114: Argentina Polyester Polyol Industry Volume (K Tons) Forecast, by Application 2019 & 2032
- Table 115: Rest of South America Polyester Polyol Industry Revenue (Billion) Forecast, by Application 2019 & 2032
- Table 116: Rest of South America Polyester Polyol Industry Volume (K Tons) Forecast, by Application 2019 & 2032
- Table 117: Global Polyester Polyol Industry Revenue Billion Forecast, by Type 2019 & 2032
- Table 118: Global Polyester Polyol Industry Volume K Tons Forecast, by Type 2019 & 2032
- Table 119: Global Polyester Polyol Industry Revenue Billion Forecast, by Application 2019 & 2032
- Table 120: Global Polyester Polyol Industry Volume K Tons Forecast, by Application 2019 & 2032
- Table 121: Global Polyester Polyol Industry Revenue Billion Forecast, by Country 2019 & 2032
- Table 122: Global Polyester Polyol Industry Volume K Tons Forecast, by Country 2019 & 2032
- Table 123: Saudi Arabia Polyester Polyol Industry Revenue (Billion) Forecast, by Application 2019 & 2032
- Table 124: Saudi Arabia Polyester Polyol Industry Volume (K Tons) Forecast, by Application 2019 & 2032
- Table 125: South Africa Polyester Polyol Industry Revenue (Billion) Forecast, by Application 2019 & 2032
- Table 126: South Africa Polyester Polyol Industry Volume (K Tons) Forecast, by Application 2019 & 2032
- Table 127: Rest of Middle East and Africa Polyester Polyol Industry Revenue (Billion) Forecast, by Application 2019 & 2032
- Table 128: Rest of Middle East and Africa Polyester Polyol Industry Volume (K Tons) Forecast, by Application 2019 & 2032
Frequently Asked Questions
1. What is the projected Compound Annual Growth Rate (CAGR) of the Polyester Polyol Industry?
The projected CAGR is approximately 5.5%.
2. Which companies are prominent players in the Polyester Polyol Industry?
Key companies in the market include Arkema, BASF, Townsend Chemicals P/L, Arpadis, Stepan Company, Alfa Chemicals, TRiiSO LLC, Dow, TER HELL & Co GmbH, Oleon NV, DIC CORPORATION, Huntsman Corporation, PCC SE, Purinova Sp z o o, Evonik.
3. What are the main segments of the Polyester Polyol Industry?
The market segments include Type, Application.
4. Can you provide details about the market size?
The market size is estimated to be USD 7.5 Billion as of 2022.
5. What are some drivers contributing to market growth?
Increase Usage for Aromatic Polyester polyol; Increasing Demand for PU Foam in Various Applications.
6. What are the notable trends driving market growth?
Flexible Foam Segment Dominates the Market.
7. Are there any restraints impacting market growth?
Increasing Price of Raw Material.
8. Can you provide examples of recent developments in the market?
In December 2020, Huntsman Corporation, based in Kuan Yin, Taiwan, opened a new Terol aromatic polyester polyols factory with a capacity of 22,000 tonnes.
9. What pricing options are available for accessing the report?
Pricing options include single-user, multi-user, and enterprise licenses priced at USD 4750, USD 5250, and USD 8750 respectively.
10. Is the market size provided in terms of value or volume?
The market size is provided in terms of value, measured in Billion and volume, measured in K Tons.
11. Are there any specific market keywords associated with the report?
Yes, the market keyword associated with the report is "Polyester Polyol Industry," which aids in identifying and referencing the specific market segment covered.
12. How do I determine which pricing option suits my needs best?
The pricing options vary based on user requirements and access needs. Individual users may opt for single-user licenses, while businesses requiring broader access may choose multi-user or enterprise licenses for cost-effective access to the report.
13. Are there any additional resources or data provided in the Polyester Polyol Industry report?
While the report offers comprehensive insights, it's advisable to review the specific contents or supplementary materials provided to ascertain if additional resources or data are available.
14. How can I stay updated on further developments or reports in the Polyester Polyol Industry?
To stay informed about further developments, trends, and reports in the Polyester Polyol Industry, consider subscribing to industry newsletters, following relevant companies and organizations, or regularly checking reputable industry news sources and publications.
Methodology
Step 1 - Identification of Relevant Samples Size from Population Database


Step 2 - Approaches for Defining Global Market Size (Value, Volume* & Price*)

Note*: In applicable scenarios
Step 3 - Data Sources
Primary Research
- Web Analytics
- Survey Reports
- Research Institute
- Latest Research Reports
- Opinion Leaders
Secondary Research
- Annual Reports
- White Paper
- Latest Press Release
- Industry Association
- Paid Database
- Investor Presentations

Step 4 - Data Triangulation
Involves using different sources of information in order to increase the validity of a study
These sources are likely to be stakeholders in a program - participants, other researchers, program staff, other community members, and so on.
Then we put all data in single framework & apply various statistical tools to find out the dynamic on the market.
During the analysis stage, feedback from the stakeholder groups would be compared to determine areas of agreement as well as areas of divergence


