
Key Insights
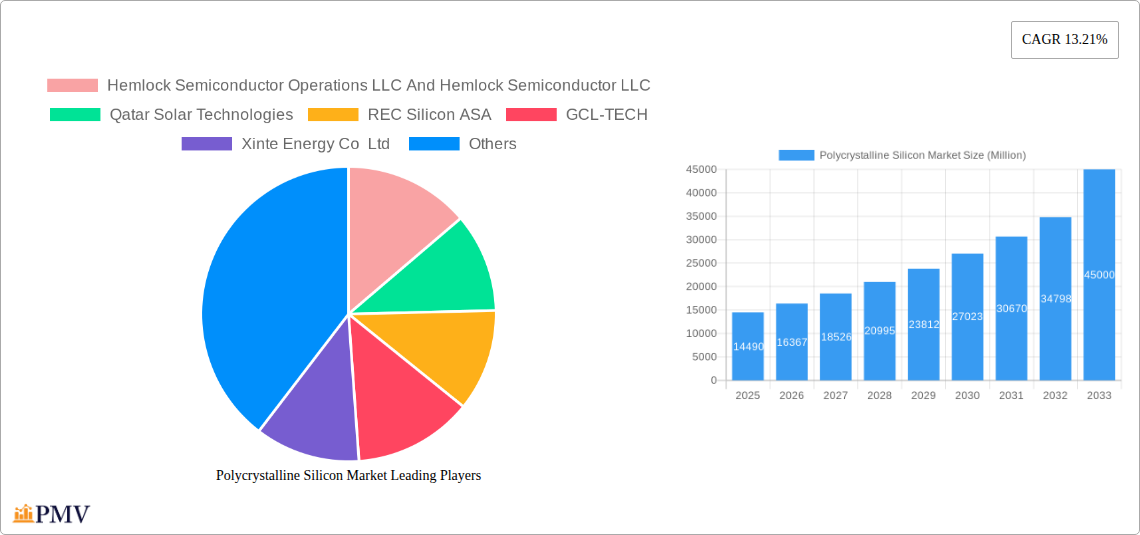
The polycrystalline silicon (polysilicon) market, valued at $14.49 billion in 2025, is projected to experience robust growth, driven primarily by the burgeoning solar photovoltaic (PV) industry and increasing demand for semiconductors. A compound annual growth rate (CAGR) of 13.21% from 2025 to 2033 indicates a significant expansion of the market, reaching an estimated $45 billion by 2033. This growth is fueled by several key factors, including the global shift towards renewable energy sources, supportive government policies promoting solar energy adoption, and continuous technological advancements improving polysilicon efficiency and reducing production costs. The increasing demand for electronics, particularly in emerging economies, further contributes to the market's expansion. However, challenges remain, such as fluctuating raw material prices, geopolitical uncertainties impacting supply chains, and potential environmental concerns related to polysilicon production. These factors necessitate a careful balance between sustainable production practices and meeting the ever-growing market demand.
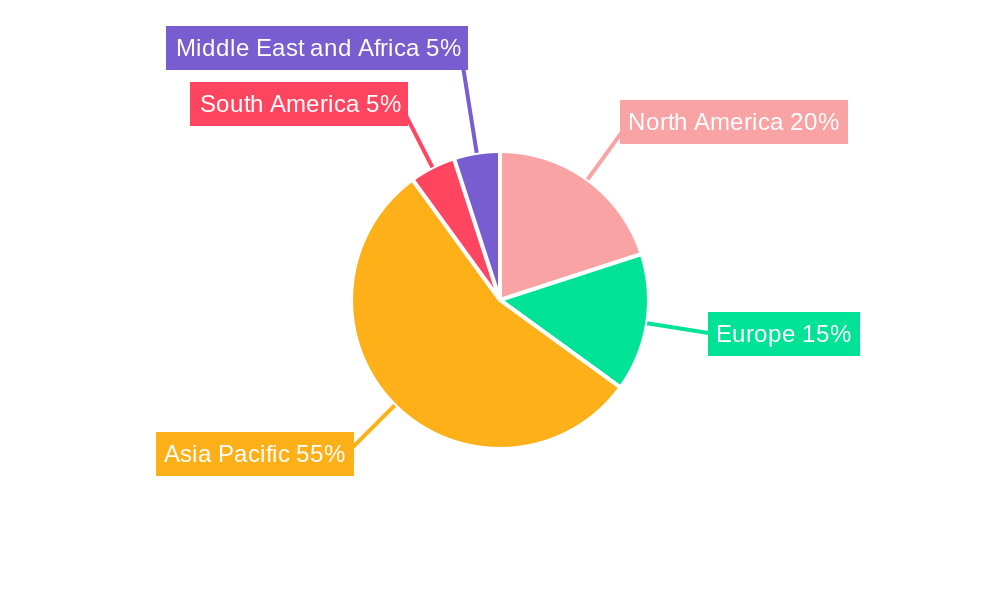
Significant regional variations exist within the polysilicon market. Asia-Pacific, particularly China, dominates the market due to its substantial manufacturing capacity and robust domestic demand for solar PV installations. North America and Europe also represent significant markets, driven by strong government initiatives and a growing awareness of climate change. The market is further segmented by end-user industry, with solar PV holding the largest share, followed by the electronics sector for semiconductor applications. Key players in this dynamic market landscape include established players like Hemlock Semiconductor, REC Silicon, and Tokuyama Corporation, as well as emerging companies actively investing in advanced production technologies and capacity expansion. The competitive landscape is marked by both consolidation and innovation, pushing the boundaries of polysilicon production and efficiency. The forecast period suggests a continued expansion of the market, with opportunities for companies that can efficiently address the challenges while meeting the increasing demand for polysilicon globally.
Polycrystalline Silicon Market: A Comprehensive Analysis (2019-2033)
This detailed report provides a comprehensive analysis of the polycrystalline silicon market, encompassing market structure, competitive dynamics, industry trends, dominant segments, product innovations, and future growth prospects. The study period covers 2019-2033, with 2025 as the base and estimated year. This report is essential for industry stakeholders, investors, and researchers seeking actionable insights into this rapidly evolving market.
Polycrystalline Silicon Market Structure & Competitive Dynamics
The polycrystalline silicon market exhibits a moderately concentrated structure, with several key players holding significant market share. The competitive landscape is characterized by intense rivalry, driven by factors such as technological innovation, pricing pressures, and capacity expansion. The market’s innovation ecosystem is vibrant, with ongoing research and development efforts focused on enhancing polysilicon purity, improving production efficiency, and reducing costs. Stringent regulatory frameworks, particularly regarding environmental compliance and safety standards, shape market dynamics. Product substitutes, such as monocrystalline silicon, pose a competitive challenge, though polycrystalline silicon remains cost-competitive for many applications. End-user trends, notably the strong growth of the solar photovoltaic (PV) industry, are a primary driver of market expansion. Mergers and acquisitions (M&A) activity is noteworthy, with significant deals impacting market share distribution and competitive positioning. For instance, while precise M&A deal values vary year to year and are not publicly available for all transactions, the industry has seen several multi-Million USD deals in recent years, reflecting consolidation efforts. The market share of the top five players is estimated at xx%.
- Market Concentration: Moderately concentrated.
- Innovation Ecosystem: Highly active, focusing on efficiency and cost reduction.
- Regulatory Framework: Stringent environmental and safety regulations.
- Product Substitutes: Monocrystalline silicon poses a competitive threat.
- End-User Trends: Strong growth in solar PV is a major driver.
- M&A Activity: Significant deals shaping market dynamics (xx Million USD in total deal value estimated for the study period).
Polycrystalline Silicon Market Industry Trends & Insights
The global polycrystalline silicon market is experiencing robust growth, driven by the expanding demand from the solar PV industry. The compound annual growth rate (CAGR) is projected to be xx% during the forecast period (2025-2033). Technological advancements, such as improvements in production processes and enhanced material properties, are contributing to increased efficiency and reduced costs. Consumer preferences are shifting towards renewable energy sources, fueling the demand for solar PV systems and consequently, polycrystalline silicon. However, the market faces challenges like fluctuating raw material prices and geopolitical uncertainties that can impact supply chains. The market penetration of polycrystalline silicon in the solar PV sector remains high, despite the increasing adoption of monocrystalline silicon. Competitive dynamics are marked by price competition and strategic alliances, with companies focusing on expanding capacity and securing long-term supply agreements. The overall market is characterized by a dynamic interplay of technological advancements, economic factors, and regulatory policies.

Dominant Markets & Segments in Polycrystalline Silicon Market
The solar PV segment dominates the polycrystalline silicon market, driven by the global shift towards renewable energy. China is currently the leading market for polycrystalline silicon consumption, attributed to its substantial investments in renewable energy infrastructure and supportive government policies.
- Key Drivers in China:
- Massive investments in renewable energy infrastructure.
- Supportive government policies promoting solar energy adoption.
- Cost-competitive manufacturing capabilities.
- Growing domestic demand for solar energy solutions.
The electronics (semiconductor) segment, though smaller than solar PV, showcases steady growth fueled by the rising demand for electronic devices and semiconductor components. Other regions such as Southeast Asia and Europe are also witnessing substantial growth due to favorable government initiatives and increasing energy demands. The multicrystalline solar panel segment holds a significant share, benefiting from its cost-effectiveness compared to monocrystalline counterparts. The continued dominance of polycrystalline silicon in the solar industry indicates a significant future for this market, despite the rise of monocrystalline options.
Polycrystalline Silicon Market Product Innovations
Recent innovations in polycrystalline silicon production focus on improving purity, increasing yield, and enhancing material properties. These advancements lead to greater efficiency in solar cells and improved performance in semiconductor applications. Companies are also exploring new applications for polycrystalline silicon, expanding its market reach beyond traditional sectors. The competitive advantage lies in achieving higher purity levels at lower costs, optimizing production processes, and developing tailored materials for specific applications.
Report Segmentation & Scope
The report segments the polycrystalline silicon market by end-user industry (Solar PV, Electronics (Semiconductor)) and by product type (Multicrystalline Solar Panel). The Solar PV segment is expected to witness significant growth due to increased demand for renewable energy. The Electronics (Semiconductor) segment displays steady growth driven by the electronics industry. Growth projections for each segment are provided in the full report, alongside detailed market size estimations and competitive landscape analyses. The report covers the historical period (2019-2024), the base year (2025), and the forecast period (2025-2033).
Key Drivers of Polycrystalline Silicon Market Growth
The polycrystalline silicon market is propelled by several key factors: the rising global demand for renewable energy sources (particularly solar power), leading to increased solar panel manufacturing; technological advancements driving down production costs and improving efficiency; supportive government policies and incentives promoting renewable energy adoption globally; and the cost-competitiveness of polycrystalline silicon compared to other silicon types in certain applications.
Challenges in the Polycrystalline Silicon Market Sector
The polycrystalline silicon market faces challenges like fluctuating raw material prices, impacting production costs; geopolitical uncertainties and supply chain disruptions affecting availability; and intense competition from established players and emerging entrants. These factors can lead to price volatility and margin compression for some producers. Additionally, environmental regulations and sustainable production practices need careful consideration and investment.
Leading Players in the Polycrystalline Silicon Market Market
- Hemlock Semiconductor Operations LLC And Hemlock Semiconductor LLC
- Qatar Solar Technologies
- REC Silicon ASA
- GCL-TECH
- Xinte Energy Co Ltd
- Tokuyama Corporation
- Asia Silicon (Qinghai) Co Ltd
- Daqo New Energy Co Ltd
- Sichuan Yongxiang Co Ltd (Tongwei)
- OCI Company Ltd
- Wacker Chemie AG
- Mitsubishi Polycrystalline Silicon America Corporation
Key Developments in Polycrystalline Silicon Market Sector
- April 2022: OCI Company Ltd signed a USD 1.2 Billion MoU with Hanwha Solutions for polysilicon supply, boosting profit margins.
- August 2022: REC Silicon ASA and Mississippi Silicon collaborated to develop a US solar supply chain from raw silicon to modules.
Strategic Polycrystalline Silicon Market Outlook
The polycrystalline silicon market is poised for sustained growth, driven by the continued expansion of the solar PV industry and ongoing technological advancements. Strategic opportunities lie in expanding production capacity, securing long-term supply contracts, investing in R&D to enhance efficiency and reduce costs, and exploring new applications for polycrystalline silicon. The market’s future success hinges on navigating the challenges posed by supply chain disruptions, price volatility, and intense competition.
Polycrystalline Silicon Market Segmentation
-
1. End-user Industry
-
1.1. Solar PV
- 1.1.1. Monocrystalline Solar Panel
- 1.1.2. Multicrystalline Solar Panel
- 1.2. Electronics (Semiconductor)
-
1.1. Solar PV
Polycrystalline Silicon Market Segmentation By Geography
-
1. Asia Pacific
- 1.1. China
- 1.2. India
- 1.3. Japan
- 1.4. South Korea
- 1.5. Rest of Asia Pacific
-
2. North America
- 2.1. United States
- 2.2. Canada
- 2.3. Mexico
-
3. Europe
- 3.1. Germany
- 3.2. United Kingdom
- 3.3. Italy
- 3.4. France
- 3.5. Rest of Europe
-
4. South America
- 4.1. Brazil
- 4.2. Argentina
- 4.3. Rest of South America
-
5. Middle East and Africa
- 5.1. Saudi Arabia
- 5.2. South Africa
- 5.3. Rest of Middle East and Africa
Polycrystalline Silicon Market REPORT HIGHLIGHTS
| Aspects | Details |
|---|---|
| Study Period | 2019-2033 |
| Base Year | 2024 |
| Estimated Year | 2025 |
| Forecast Period | 2025-2033 |
| Historical Period | 2019-2024 |
| Growth Rate | CAGR of 13.21% from 2019-2033 |
| Segmentation |
|
Table of Contents
- 1. Introduction
- 1.1. Research Scope
- 1.2. Market Segmentation
- 1.3. Research Methodology
- 1.4. Definitions and Assumptions
- 2. Executive Summary
- 2.1. Introduction
- 3. Market Dynamics
- 3.1. Introduction
- 3.2. Market Drivers
- 3.2.1. Increasing Number of Solar PV Installation; Growth in the Semiconductor Industry
- 3.3. Market Restrains
- 3.3.1 Emerging Competitors
- 3.3.2 such as Upgraded Metallurgical-grade Silicon (UMG-Si) Solar Cell; High Capital Expenditure
- 3.4. Market Trends
- 3.4.1. Growing Demand from the Solar PV Industry
- 4. Market Factor Analysis
- 4.1. Porters Five Forces
- 4.2. Supply/Value Chain
- 4.3. PESTEL analysis
- 4.4. Market Entropy
- 4.5. Patent/Trademark Analysis
- 5. Global Polycrystalline Silicon Market Analysis, Insights and Forecast, 2019-2031
- 5.1. Market Analysis, Insights and Forecast - by End-user Industry
- 5.1.1. Solar PV
- 5.1.1.1. Monocrystalline Solar Panel
- 5.1.1.2. Multicrystalline Solar Panel
- 5.1.2. Electronics (Semiconductor)
- 5.1.1. Solar PV
- 5.2. Market Analysis, Insights and Forecast - by Region
- 5.2.1. Asia Pacific
- 5.2.2. North America
- 5.2.3. Europe
- 5.2.4. South America
- 5.2.5. Middle East and Africa
- 5.1. Market Analysis, Insights and Forecast - by End-user Industry
- 6. Asia Pacific Polycrystalline Silicon Market Analysis, Insights and Forecast, 2019-2031
- 6.1. Market Analysis, Insights and Forecast - by End-user Industry
- 6.1.1. Solar PV
- 6.1.1.1. Monocrystalline Solar Panel
- 6.1.1.2. Multicrystalline Solar Panel
- 6.1.2. Electronics (Semiconductor)
- 6.1.1. Solar PV
- 6.1. Market Analysis, Insights and Forecast - by End-user Industry
- 7. North America Polycrystalline Silicon Market Analysis, Insights and Forecast, 2019-2031
- 7.1. Market Analysis, Insights and Forecast - by End-user Industry
- 7.1.1. Solar PV
- 7.1.1.1. Monocrystalline Solar Panel
- 7.1.1.2. Multicrystalline Solar Panel
- 7.1.2. Electronics (Semiconductor)
- 7.1.1. Solar PV
- 7.1. Market Analysis, Insights and Forecast - by End-user Industry
- 8. Europe Polycrystalline Silicon Market Analysis, Insights and Forecast, 2019-2031
- 8.1. Market Analysis, Insights and Forecast - by End-user Industry
- 8.1.1. Solar PV
- 8.1.1.1. Monocrystalline Solar Panel
- 8.1.1.2. Multicrystalline Solar Panel
- 8.1.2. Electronics (Semiconductor)
- 8.1.1. Solar PV
- 8.1. Market Analysis, Insights and Forecast - by End-user Industry
- 9. South America Polycrystalline Silicon Market Analysis, Insights and Forecast, 2019-2031
- 9.1. Market Analysis, Insights and Forecast - by End-user Industry
- 9.1.1. Solar PV
- 9.1.1.1. Monocrystalline Solar Panel
- 9.1.1.2. Multicrystalline Solar Panel
- 9.1.2. Electronics (Semiconductor)
- 9.1.1. Solar PV
- 9.1. Market Analysis, Insights and Forecast - by End-user Industry
- 10. Middle East and Africa Polycrystalline Silicon Market Analysis, Insights and Forecast, 2019-2031
- 10.1. Market Analysis, Insights and Forecast - by End-user Industry
- 10.1.1. Solar PV
- 10.1.1.1. Monocrystalline Solar Panel
- 10.1.1.2. Multicrystalline Solar Panel
- 10.1.2. Electronics (Semiconductor)
- 10.1.1. Solar PV
- 10.1. Market Analysis, Insights and Forecast - by End-user Industry
- 11. Asia Pacific Polycrystalline Silicon Market Analysis, Insights and Forecast, 2019-2031
- 11.1. Market Analysis, Insights and Forecast - By Country/Sub-region
- 11.1.1 China
- 11.1.2 India
- 11.1.3 Japan
- 11.1.4 South Korea
- 11.1.5 Rest of Asia Pacific
- 12. North America Polycrystalline Silicon Market Analysis, Insights and Forecast, 2019-2031
- 12.1. Market Analysis, Insights and Forecast - By Country/Sub-region
- 12.1.1 United States
- 12.1.2 Canada
- 12.1.3 Mexico
- 13. Europe Polycrystalline Silicon Market Analysis, Insights and Forecast, 2019-2031
- 13.1. Market Analysis, Insights and Forecast - By Country/Sub-region
- 13.1.1 Germany
- 13.1.2 United Kingdom
- 13.1.3 Italy
- 13.1.4 France
- 13.1.5 Rest of Europe
- 14. South America Polycrystalline Silicon Market Analysis, Insights and Forecast, 2019-2031
- 14.1. Market Analysis, Insights and Forecast - By Country/Sub-region
- 14.1.1 Brazil
- 14.1.2 Argentina
- 14.1.3 Rest of South America
- 15. Middle East and Africa Polycrystalline Silicon Market Analysis, Insights and Forecast, 2019-2031
- 15.1. Market Analysis, Insights and Forecast - By Country/Sub-region
- 15.1.1 Saudi Arabia
- 15.1.2 South Africa
- 15.1.3 Rest of Middle East and Africa
- 16. Competitive Analysis
- 16.1. Global Market Share Analysis 2024
- 16.2. Company Profiles
- 16.2.1 Hemlock Semiconductor Operations LLC And Hemlock Semiconductor LLC
- 16.2.1.1. Overview
- 16.2.1.2. Products
- 16.2.1.3. SWOT Analysis
- 16.2.1.4. Recent Developments
- 16.2.1.5. Financials (Based on Availability)
- 16.2.2 Qatar Solar Technologies
- 16.2.2.1. Overview
- 16.2.2.2. Products
- 16.2.2.3. SWOT Analysis
- 16.2.2.4. Recent Developments
- 16.2.2.5. Financials (Based on Availability)
- 16.2.3 REC Silicon ASA
- 16.2.3.1. Overview
- 16.2.3.2. Products
- 16.2.3.3. SWOT Analysis
- 16.2.3.4. Recent Developments
- 16.2.3.5. Financials (Based on Availability)
- 16.2.4 GCL-TECH
- 16.2.4.1. Overview
- 16.2.4.2. Products
- 16.2.4.3. SWOT Analysis
- 16.2.4.4. Recent Developments
- 16.2.4.5. Financials (Based on Availability)
- 16.2.5 Xinte Energy Co Ltd
- 16.2.5.1. Overview
- 16.2.5.2. Products
- 16.2.5.3. SWOT Analysis
- 16.2.5.4. Recent Developments
- 16.2.5.5. Financials (Based on Availability)
- 16.2.6 Tokuyama Corporation
- 16.2.6.1. Overview
- 16.2.6.2. Products
- 16.2.6.3. SWOT Analysis
- 16.2.6.4. Recent Developments
- 16.2.6.5. Financials (Based on Availability)
- 16.2.7 Asia Silicon (Qinghai) Co Ltd
- 16.2.7.1. Overview
- 16.2.7.2. Products
- 16.2.7.3. SWOT Analysis
- 16.2.7.4. Recent Developments
- 16.2.7.5. Financials (Based on Availability)
- 16.2.8 Daqo New Energy Co Ltd
- 16.2.8.1. Overview
- 16.2.8.2. Products
- 16.2.8.3. SWOT Analysis
- 16.2.8.4. Recent Developments
- 16.2.8.5. Financials (Based on Availability)
- 16.2.9 Sichuan Yongxiang Co Ltd (Tongwei)
- 16.2.9.1. Overview
- 16.2.9.2. Products
- 16.2.9.3. SWOT Analysis
- 16.2.9.4. Recent Developments
- 16.2.9.5. Financials (Based on Availability)
- 16.2.10 OCI Company Ltd
- 16.2.10.1. Overview
- 16.2.10.2. Products
- 16.2.10.3. SWOT Analysis
- 16.2.10.4. Recent Developments
- 16.2.10.5. Financials (Based on Availability)
- 16.2.11 Wacker Chemie AG
- 16.2.11.1. Overview
- 16.2.11.2. Products
- 16.2.11.3. SWOT Analysis
- 16.2.11.4. Recent Developments
- 16.2.11.5. Financials (Based on Availability)
- 16.2.12 Mitsubishi Polycrystalline Silicon America Corporation
- 16.2.12.1. Overview
- 16.2.12.2. Products
- 16.2.12.3. SWOT Analysis
- 16.2.12.4. Recent Developments
- 16.2.12.5. Financials (Based on Availability)
- 16.2.1 Hemlock Semiconductor Operations LLC And Hemlock Semiconductor LLC
List of Figures
- Figure 1: Global Polycrystalline Silicon Market Revenue Breakdown (Million, %) by Region 2024 & 2032
- Figure 2: Global Polycrystalline Silicon Market Volume Breakdown (K Tons, %) by Region 2024 & 2032
- Figure 3: Asia Pacific Polycrystalline Silicon Market Revenue (Million), by Country 2024 & 2032
- Figure 4: Asia Pacific Polycrystalline Silicon Market Volume (K Tons), by Country 2024 & 2032
- Figure 5: Asia Pacific Polycrystalline Silicon Market Revenue Share (%), by Country 2024 & 2032
- Figure 6: Asia Pacific Polycrystalline Silicon Market Volume Share (%), by Country 2024 & 2032
- Figure 7: North America Polycrystalline Silicon Market Revenue (Million), by Country 2024 & 2032
- Figure 8: North America Polycrystalline Silicon Market Volume (K Tons), by Country 2024 & 2032
- Figure 9: North America Polycrystalline Silicon Market Revenue Share (%), by Country 2024 & 2032
- Figure 10: North America Polycrystalline Silicon Market Volume Share (%), by Country 2024 & 2032
- Figure 11: Europe Polycrystalline Silicon Market Revenue (Million), by Country 2024 & 2032
- Figure 12: Europe Polycrystalline Silicon Market Volume (K Tons), by Country 2024 & 2032
- Figure 13: Europe Polycrystalline Silicon Market Revenue Share (%), by Country 2024 & 2032
- Figure 14: Europe Polycrystalline Silicon Market Volume Share (%), by Country 2024 & 2032
- Figure 15: South America Polycrystalline Silicon Market Revenue (Million), by Country 2024 & 2032
- Figure 16: South America Polycrystalline Silicon Market Volume (K Tons), by Country 2024 & 2032
- Figure 17: South America Polycrystalline Silicon Market Revenue Share (%), by Country 2024 & 2032
- Figure 18: South America Polycrystalline Silicon Market Volume Share (%), by Country 2024 & 2032
- Figure 19: Middle East and Africa Polycrystalline Silicon Market Revenue (Million), by Country 2024 & 2032
- Figure 20: Middle East and Africa Polycrystalline Silicon Market Volume (K Tons), by Country 2024 & 2032
- Figure 21: Middle East and Africa Polycrystalline Silicon Market Revenue Share (%), by Country 2024 & 2032
- Figure 22: Middle East and Africa Polycrystalline Silicon Market Volume Share (%), by Country 2024 & 2032
- Figure 23: Asia Pacific Polycrystalline Silicon Market Revenue (Million), by End-user Industry 2024 & 2032
- Figure 24: Asia Pacific Polycrystalline Silicon Market Volume (K Tons), by End-user Industry 2024 & 2032
- Figure 25: Asia Pacific Polycrystalline Silicon Market Revenue Share (%), by End-user Industry 2024 & 2032
- Figure 26: Asia Pacific Polycrystalline Silicon Market Volume Share (%), by End-user Industry 2024 & 2032
- Figure 27: Asia Pacific Polycrystalline Silicon Market Revenue (Million), by Country 2024 & 2032
- Figure 28: Asia Pacific Polycrystalline Silicon Market Volume (K Tons), by Country 2024 & 2032
- Figure 29: Asia Pacific Polycrystalline Silicon Market Revenue Share (%), by Country 2024 & 2032
- Figure 30: Asia Pacific Polycrystalline Silicon Market Volume Share (%), by Country 2024 & 2032
- Figure 31: North America Polycrystalline Silicon Market Revenue (Million), by End-user Industry 2024 & 2032
- Figure 32: North America Polycrystalline Silicon Market Volume (K Tons), by End-user Industry 2024 & 2032
- Figure 33: North America Polycrystalline Silicon Market Revenue Share (%), by End-user Industry 2024 & 2032
- Figure 34: North America Polycrystalline Silicon Market Volume Share (%), by End-user Industry 2024 & 2032
- Figure 35: North America Polycrystalline Silicon Market Revenue (Million), by Country 2024 & 2032
- Figure 36: North America Polycrystalline Silicon Market Volume (K Tons), by Country 2024 & 2032
- Figure 37: North America Polycrystalline Silicon Market Revenue Share (%), by Country 2024 & 2032
- Figure 38: North America Polycrystalline Silicon Market Volume Share (%), by Country 2024 & 2032
- Figure 39: Europe Polycrystalline Silicon Market Revenue (Million), by End-user Industry 2024 & 2032
- Figure 40: Europe Polycrystalline Silicon Market Volume (K Tons), by End-user Industry 2024 & 2032
- Figure 41: Europe Polycrystalline Silicon Market Revenue Share (%), by End-user Industry 2024 & 2032
- Figure 42: Europe Polycrystalline Silicon Market Volume Share (%), by End-user Industry 2024 & 2032
- Figure 43: Europe Polycrystalline Silicon Market Revenue (Million), by Country 2024 & 2032
- Figure 44: Europe Polycrystalline Silicon Market Volume (K Tons), by Country 2024 & 2032
- Figure 45: Europe Polycrystalline Silicon Market Revenue Share (%), by Country 2024 & 2032
- Figure 46: Europe Polycrystalline Silicon Market Volume Share (%), by Country 2024 & 2032
- Figure 47: South America Polycrystalline Silicon Market Revenue (Million), by End-user Industry 2024 & 2032
- Figure 48: South America Polycrystalline Silicon Market Volume (K Tons), by End-user Industry 2024 & 2032
- Figure 49: South America Polycrystalline Silicon Market Revenue Share (%), by End-user Industry 2024 & 2032
- Figure 50: South America Polycrystalline Silicon Market Volume Share (%), by End-user Industry 2024 & 2032
- Figure 51: South America Polycrystalline Silicon Market Revenue (Million), by Country 2024 & 2032
- Figure 52: South America Polycrystalline Silicon Market Volume (K Tons), by Country 2024 & 2032
- Figure 53: South America Polycrystalline Silicon Market Revenue Share (%), by Country 2024 & 2032
- Figure 54: South America Polycrystalline Silicon Market Volume Share (%), by Country 2024 & 2032
- Figure 55: Middle East and Africa Polycrystalline Silicon Market Revenue (Million), by End-user Industry 2024 & 2032
- Figure 56: Middle East and Africa Polycrystalline Silicon Market Volume (K Tons), by End-user Industry 2024 & 2032
- Figure 57: Middle East and Africa Polycrystalline Silicon Market Revenue Share (%), by End-user Industry 2024 & 2032
- Figure 58: Middle East and Africa Polycrystalline Silicon Market Volume Share (%), by End-user Industry 2024 & 2032
- Figure 59: Middle East and Africa Polycrystalline Silicon Market Revenue (Million), by Country 2024 & 2032
- Figure 60: Middle East and Africa Polycrystalline Silicon Market Volume (K Tons), by Country 2024 & 2032
- Figure 61: Middle East and Africa Polycrystalline Silicon Market Revenue Share (%), by Country 2024 & 2032
- Figure 62: Middle East and Africa Polycrystalline Silicon Market Volume Share (%), by Country 2024 & 2032
List of Tables
- Table 1: Global Polycrystalline Silicon Market Revenue Million Forecast, by Region 2019 & 2032
- Table 2: Global Polycrystalline Silicon Market Volume K Tons Forecast, by Region 2019 & 2032
- Table 3: Global Polycrystalline Silicon Market Revenue Million Forecast, by End-user Industry 2019 & 2032
- Table 4: Global Polycrystalline Silicon Market Volume K Tons Forecast, by End-user Industry 2019 & 2032
- Table 5: Global Polycrystalline Silicon Market Revenue Million Forecast, by Region 2019 & 2032
- Table 6: Global Polycrystalline Silicon Market Volume K Tons Forecast, by Region 2019 & 2032
- Table 7: Global Polycrystalline Silicon Market Revenue Million Forecast, by Country 2019 & 2032
- Table 8: Global Polycrystalline Silicon Market Volume K Tons Forecast, by Country 2019 & 2032
- Table 9: China Polycrystalline Silicon Market Revenue (Million) Forecast, by Application 2019 & 2032
- Table 10: China Polycrystalline Silicon Market Volume (K Tons) Forecast, by Application 2019 & 2032
- Table 11: India Polycrystalline Silicon Market Revenue (Million) Forecast, by Application 2019 & 2032
- Table 12: India Polycrystalline Silicon Market Volume (K Tons) Forecast, by Application 2019 & 2032
- Table 13: Japan Polycrystalline Silicon Market Revenue (Million) Forecast, by Application 2019 & 2032
- Table 14: Japan Polycrystalline Silicon Market Volume (K Tons) Forecast, by Application 2019 & 2032
- Table 15: South Korea Polycrystalline Silicon Market Revenue (Million) Forecast, by Application 2019 & 2032
- Table 16: South Korea Polycrystalline Silicon Market Volume (K Tons) Forecast, by Application 2019 & 2032
- Table 17: Rest of Asia Pacific Polycrystalline Silicon Market Revenue (Million) Forecast, by Application 2019 & 2032
- Table 18: Rest of Asia Pacific Polycrystalline Silicon Market Volume (K Tons) Forecast, by Application 2019 & 2032
- Table 19: Global Polycrystalline Silicon Market Revenue Million Forecast, by Country 2019 & 2032
- Table 20: Global Polycrystalline Silicon Market Volume K Tons Forecast, by Country 2019 & 2032
- Table 21: United States Polycrystalline Silicon Market Revenue (Million) Forecast, by Application 2019 & 2032
- Table 22: United States Polycrystalline Silicon Market Volume (K Tons) Forecast, by Application 2019 & 2032
- Table 23: Canada Polycrystalline Silicon Market Revenue (Million) Forecast, by Application 2019 & 2032
- Table 24: Canada Polycrystalline Silicon Market Volume (K Tons) Forecast, by Application 2019 & 2032
- Table 25: Mexico Polycrystalline Silicon Market Revenue (Million) Forecast, by Application 2019 & 2032
- Table 26: Mexico Polycrystalline Silicon Market Volume (K Tons) Forecast, by Application 2019 & 2032
- Table 27: Global Polycrystalline Silicon Market Revenue Million Forecast, by Country 2019 & 2032
- Table 28: Global Polycrystalline Silicon Market Volume K Tons Forecast, by Country 2019 & 2032
- Table 29: Germany Polycrystalline Silicon Market Revenue (Million) Forecast, by Application 2019 & 2032
- Table 30: Germany Polycrystalline Silicon Market Volume (K Tons) Forecast, by Application 2019 & 2032
- Table 31: United Kingdom Polycrystalline Silicon Market Revenue (Million) Forecast, by Application 2019 & 2032
- Table 32: United Kingdom Polycrystalline Silicon Market Volume (K Tons) Forecast, by Application 2019 & 2032
- Table 33: Italy Polycrystalline Silicon Market Revenue (Million) Forecast, by Application 2019 & 2032
- Table 34: Italy Polycrystalline Silicon Market Volume (K Tons) Forecast, by Application 2019 & 2032
- Table 35: France Polycrystalline Silicon Market Revenue (Million) Forecast, by Application 2019 & 2032
- Table 36: France Polycrystalline Silicon Market Volume (K Tons) Forecast, by Application 2019 & 2032
- Table 37: Rest of Europe Polycrystalline Silicon Market Revenue (Million) Forecast, by Application 2019 & 2032
- Table 38: Rest of Europe Polycrystalline Silicon Market Volume (K Tons) Forecast, by Application 2019 & 2032
- Table 39: Global Polycrystalline Silicon Market Revenue Million Forecast, by Country 2019 & 2032
- Table 40: Global Polycrystalline Silicon Market Volume K Tons Forecast, by Country 2019 & 2032
- Table 41: Brazil Polycrystalline Silicon Market Revenue (Million) Forecast, by Application 2019 & 2032
- Table 42: Brazil Polycrystalline Silicon Market Volume (K Tons) Forecast, by Application 2019 & 2032
- Table 43: Argentina Polycrystalline Silicon Market Revenue (Million) Forecast, by Application 2019 & 2032
- Table 44: Argentina Polycrystalline Silicon Market Volume (K Tons) Forecast, by Application 2019 & 2032
- Table 45: Rest of South America Polycrystalline Silicon Market Revenue (Million) Forecast, by Application 2019 & 2032
- Table 46: Rest of South America Polycrystalline Silicon Market Volume (K Tons) Forecast, by Application 2019 & 2032
- Table 47: Global Polycrystalline Silicon Market Revenue Million Forecast, by Country 2019 & 2032
- Table 48: Global Polycrystalline Silicon Market Volume K Tons Forecast, by Country 2019 & 2032
- Table 49: Saudi Arabia Polycrystalline Silicon Market Revenue (Million) Forecast, by Application 2019 & 2032
- Table 50: Saudi Arabia Polycrystalline Silicon Market Volume (K Tons) Forecast, by Application 2019 & 2032
- Table 51: South Africa Polycrystalline Silicon Market Revenue (Million) Forecast, by Application 2019 & 2032
- Table 52: South Africa Polycrystalline Silicon Market Volume (K Tons) Forecast, by Application 2019 & 2032
- Table 53: Rest of Middle East and Africa Polycrystalline Silicon Market Revenue (Million) Forecast, by Application 2019 & 2032
- Table 54: Rest of Middle East and Africa Polycrystalline Silicon Market Volume (K Tons) Forecast, by Application 2019 & 2032
- Table 55: Global Polycrystalline Silicon Market Revenue Million Forecast, by End-user Industry 2019 & 2032
- Table 56: Global Polycrystalline Silicon Market Volume K Tons Forecast, by End-user Industry 2019 & 2032
- Table 57: Global Polycrystalline Silicon Market Revenue Million Forecast, by Country 2019 & 2032
- Table 58: Global Polycrystalline Silicon Market Volume K Tons Forecast, by Country 2019 & 2032
- Table 59: China Polycrystalline Silicon Market Revenue (Million) Forecast, by Application 2019 & 2032
- Table 60: China Polycrystalline Silicon Market Volume (K Tons) Forecast, by Application 2019 & 2032
- Table 61: India Polycrystalline Silicon Market Revenue (Million) Forecast, by Application 2019 & 2032
- Table 62: India Polycrystalline Silicon Market Volume (K Tons) Forecast, by Application 2019 & 2032
- Table 63: Japan Polycrystalline Silicon Market Revenue (Million) Forecast, by Application 2019 & 2032
- Table 64: Japan Polycrystalline Silicon Market Volume (K Tons) Forecast, by Application 2019 & 2032
- Table 65: South Korea Polycrystalline Silicon Market Revenue (Million) Forecast, by Application 2019 & 2032
- Table 66: South Korea Polycrystalline Silicon Market Volume (K Tons) Forecast, by Application 2019 & 2032
- Table 67: Rest of Asia Pacific Polycrystalline Silicon Market Revenue (Million) Forecast, by Application 2019 & 2032
- Table 68: Rest of Asia Pacific Polycrystalline Silicon Market Volume (K Tons) Forecast, by Application 2019 & 2032
- Table 69: Global Polycrystalline Silicon Market Revenue Million Forecast, by End-user Industry 2019 & 2032
- Table 70: Global Polycrystalline Silicon Market Volume K Tons Forecast, by End-user Industry 2019 & 2032
- Table 71: Global Polycrystalline Silicon Market Revenue Million Forecast, by Country 2019 & 2032
- Table 72: Global Polycrystalline Silicon Market Volume K Tons Forecast, by Country 2019 & 2032
- Table 73: United States Polycrystalline Silicon Market Revenue (Million) Forecast, by Application 2019 & 2032
- Table 74: United States Polycrystalline Silicon Market Volume (K Tons) Forecast, by Application 2019 & 2032
- Table 75: Canada Polycrystalline Silicon Market Revenue (Million) Forecast, by Application 2019 & 2032
- Table 76: Canada Polycrystalline Silicon Market Volume (K Tons) Forecast, by Application 2019 & 2032
- Table 77: Mexico Polycrystalline Silicon Market Revenue (Million) Forecast, by Application 2019 & 2032
- Table 78: Mexico Polycrystalline Silicon Market Volume (K Tons) Forecast, by Application 2019 & 2032
- Table 79: Global Polycrystalline Silicon Market Revenue Million Forecast, by End-user Industry 2019 & 2032
- Table 80: Global Polycrystalline Silicon Market Volume K Tons Forecast, by End-user Industry 2019 & 2032
- Table 81: Global Polycrystalline Silicon Market Revenue Million Forecast, by Country 2019 & 2032
- Table 82: Global Polycrystalline Silicon Market Volume K Tons Forecast, by Country 2019 & 2032
- Table 83: Germany Polycrystalline Silicon Market Revenue (Million) Forecast, by Application 2019 & 2032
- Table 84: Germany Polycrystalline Silicon Market Volume (K Tons) Forecast, by Application 2019 & 2032
- Table 85: United Kingdom Polycrystalline Silicon Market Revenue (Million) Forecast, by Application 2019 & 2032
- Table 86: United Kingdom Polycrystalline Silicon Market Volume (K Tons) Forecast, by Application 2019 & 2032
- Table 87: Italy Polycrystalline Silicon Market Revenue (Million) Forecast, by Application 2019 & 2032
- Table 88: Italy Polycrystalline Silicon Market Volume (K Tons) Forecast, by Application 2019 & 2032
- Table 89: France Polycrystalline Silicon Market Revenue (Million) Forecast, by Application 2019 & 2032
- Table 90: France Polycrystalline Silicon Market Volume (K Tons) Forecast, by Application 2019 & 2032
- Table 91: Rest of Europe Polycrystalline Silicon Market Revenue (Million) Forecast, by Application 2019 & 2032
- Table 92: Rest of Europe Polycrystalline Silicon Market Volume (K Tons) Forecast, by Application 2019 & 2032
- Table 93: Global Polycrystalline Silicon Market Revenue Million Forecast, by End-user Industry 2019 & 2032
- Table 94: Global Polycrystalline Silicon Market Volume K Tons Forecast, by End-user Industry 2019 & 2032
- Table 95: Global Polycrystalline Silicon Market Revenue Million Forecast, by Country 2019 & 2032
- Table 96: Global Polycrystalline Silicon Market Volume K Tons Forecast, by Country 2019 & 2032
- Table 97: Brazil Polycrystalline Silicon Market Revenue (Million) Forecast, by Application 2019 & 2032
- Table 98: Brazil Polycrystalline Silicon Market Volume (K Tons) Forecast, by Application 2019 & 2032
- Table 99: Argentina Polycrystalline Silicon Market Revenue (Million) Forecast, by Application 2019 & 2032
- Table 100: Argentina Polycrystalline Silicon Market Volume (K Tons) Forecast, by Application 2019 & 2032
- Table 101: Rest of South America Polycrystalline Silicon Market Revenue (Million) Forecast, by Application 2019 & 2032
- Table 102: Rest of South America Polycrystalline Silicon Market Volume (K Tons) Forecast, by Application 2019 & 2032
- Table 103: Global Polycrystalline Silicon Market Revenue Million Forecast, by End-user Industry 2019 & 2032
- Table 104: Global Polycrystalline Silicon Market Volume K Tons Forecast, by End-user Industry 2019 & 2032
- Table 105: Global Polycrystalline Silicon Market Revenue Million Forecast, by Country 2019 & 2032
- Table 106: Global Polycrystalline Silicon Market Volume K Tons Forecast, by Country 2019 & 2032
- Table 107: Saudi Arabia Polycrystalline Silicon Market Revenue (Million) Forecast, by Application 2019 & 2032
- Table 108: Saudi Arabia Polycrystalline Silicon Market Volume (K Tons) Forecast, by Application 2019 & 2032
- Table 109: South Africa Polycrystalline Silicon Market Revenue (Million) Forecast, by Application 2019 & 2032
- Table 110: South Africa Polycrystalline Silicon Market Volume (K Tons) Forecast, by Application 2019 & 2032
- Table 111: Rest of Middle East and Africa Polycrystalline Silicon Market Revenue (Million) Forecast, by Application 2019 & 2032
- Table 112: Rest of Middle East and Africa Polycrystalline Silicon Market Volume (K Tons) Forecast, by Application 2019 & 2032
Frequently Asked Questions
1. What is the projected Compound Annual Growth Rate (CAGR) of the Polycrystalline Silicon Market?
The projected CAGR is approximately 13.21%.
2. Which companies are prominent players in the Polycrystalline Silicon Market?
Key companies in the market include Hemlock Semiconductor Operations LLC And Hemlock Semiconductor LLC, Qatar Solar Technologies, REC Silicon ASA, GCL-TECH, Xinte Energy Co Ltd , Tokuyama Corporation, Asia Silicon (Qinghai) Co Ltd, Daqo New Energy Co Ltd, Sichuan Yongxiang Co Ltd (Tongwei), OCI Company Ltd, Wacker Chemie AG, Mitsubishi Polycrystalline Silicon America Corporation.
3. What are the main segments of the Polycrystalline Silicon Market?
The market segments include End-user Industry.
4. Can you provide details about the market size?
The market size is estimated to be USD 14.49 Million as of 2022.
5. What are some drivers contributing to market growth?
Increasing Number of Solar PV Installation; Growth in the Semiconductor Industry.
6. What are the notable trends driving market growth?
Growing Demand from the Solar PV Industry.
7. Are there any restraints impacting market growth?
Emerging Competitors. such as Upgraded Metallurgical-grade Silicon (UMG-Si) Solar Cell; High Capital Expenditure.
8. Can you provide examples of recent developments in the market?
August 2022: REC Silicon ASA and Mississippi Silicon collaborated to develop a solar supply chain in the United States. They plan to develop this solar supply chain from raw silicon to polysilicon and finally to fully assembled modules.
9. What pricing options are available for accessing the report?
Pricing options include single-user, multi-user, and enterprise licenses priced at USD 4750, USD 5250, and USD 8750 respectively.
10. Is the market size provided in terms of value or volume?
The market size is provided in terms of value, measured in Million and volume, measured in K Tons.
11. Are there any specific market keywords associated with the report?
Yes, the market keyword associated with the report is "Polycrystalline Silicon Market," which aids in identifying and referencing the specific market segment covered.
12. How do I determine which pricing option suits my needs best?
The pricing options vary based on user requirements and access needs. Individual users may opt for single-user licenses, while businesses requiring broader access may choose multi-user or enterprise licenses for cost-effective access to the report.
13. Are there any additional resources or data provided in the Polycrystalline Silicon Market report?
While the report offers comprehensive insights, it's advisable to review the specific contents or supplementary materials provided to ascertain if additional resources or data are available.
14. How can I stay updated on further developments or reports in the Polycrystalline Silicon Market?
To stay informed about further developments, trends, and reports in the Polycrystalline Silicon Market, consider subscribing to industry newsletters, following relevant companies and organizations, or regularly checking reputable industry news sources and publications.
Methodology
Step 1 - Identification of Relevant Samples Size from Population Database


Step 2 - Approaches for Defining Global Market Size (Value, Volume* & Price*)

Note*: In applicable scenarios
Step 3 - Data Sources
Primary Research
- Web Analytics
- Survey Reports
- Research Institute
- Latest Research Reports
- Opinion Leaders
Secondary Research
- Annual Reports
- White Paper
- Latest Press Release
- Industry Association
- Paid Database
- Investor Presentations

Step 4 - Data Triangulation
Involves using different sources of information in order to increase the validity of a study
These sources are likely to be stakeholders in a program - participants, other researchers, program staff, other community members, and so on.
Then we put all data in single framework & apply various statistical tools to find out the dynamic on the market.
During the analysis stage, feedback from the stakeholder groups would be compared to determine areas of agreement as well as areas of divergence


