
Key Insights
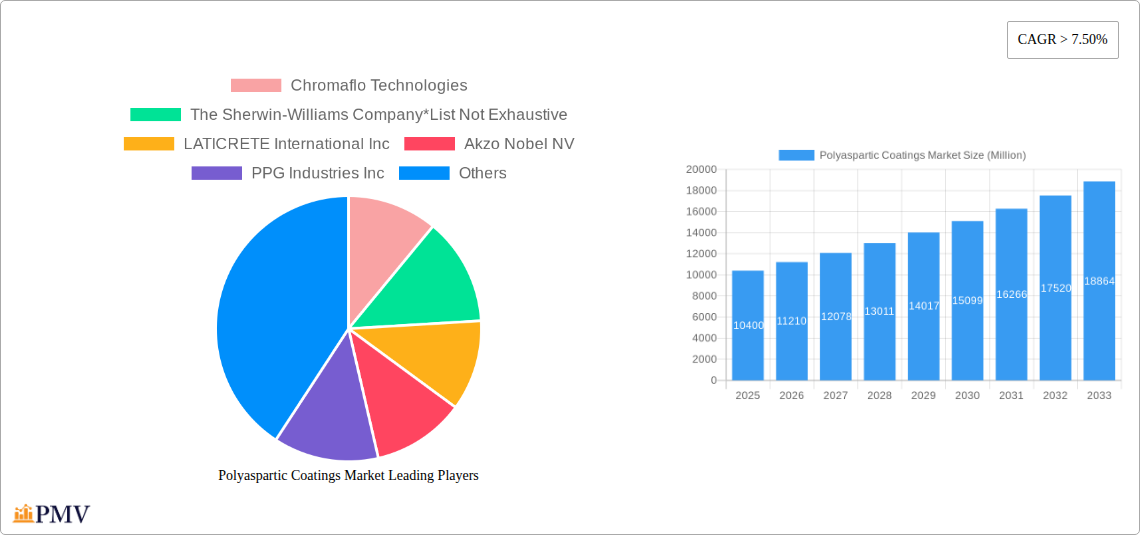
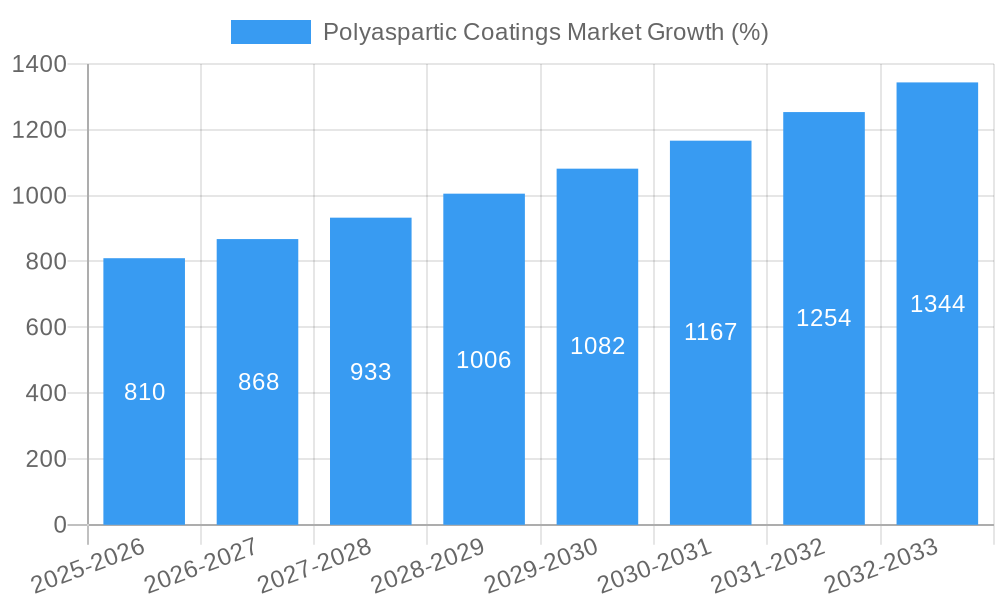
The global polyaspartic coatings market, valued at $10,400 million in 2025, is projected to experience robust growth, exhibiting a Compound Annual Growth Rate (CAGR) exceeding 7.50% from 2025 to 2033. This expansion is fueled by several key drivers. The increasing demand for high-performance coatings in infrastructure projects, particularly in rapidly developing economies of Asia-Pacific, is a significant factor. Furthermore, the inherent advantages of polyaspartic coatings, such as rapid curing times, exceptional durability, and superior chemical resistance, make them increasingly attractive across diverse end-use industries including building and construction, marine applications, and power generation. The shift towards sustainable construction practices and the growing need for corrosion protection also contribute to market growth. While the market faces some restraints, such as the relatively higher initial cost compared to conventional coatings and potential supply chain challenges, these are expected to be offset by the long-term cost savings and performance benefits offered by polyaspartic coatings. Technological advancements, including the development of innovative hybrid polyaspartic formulations, are further bolstering market expansion. The market segmentation reveals a strong presence across various technologies (water-borne, solvent-borne, powder coatings), types (pure and hybrid), and end-user industries, indicating a diversified and robust market landscape.
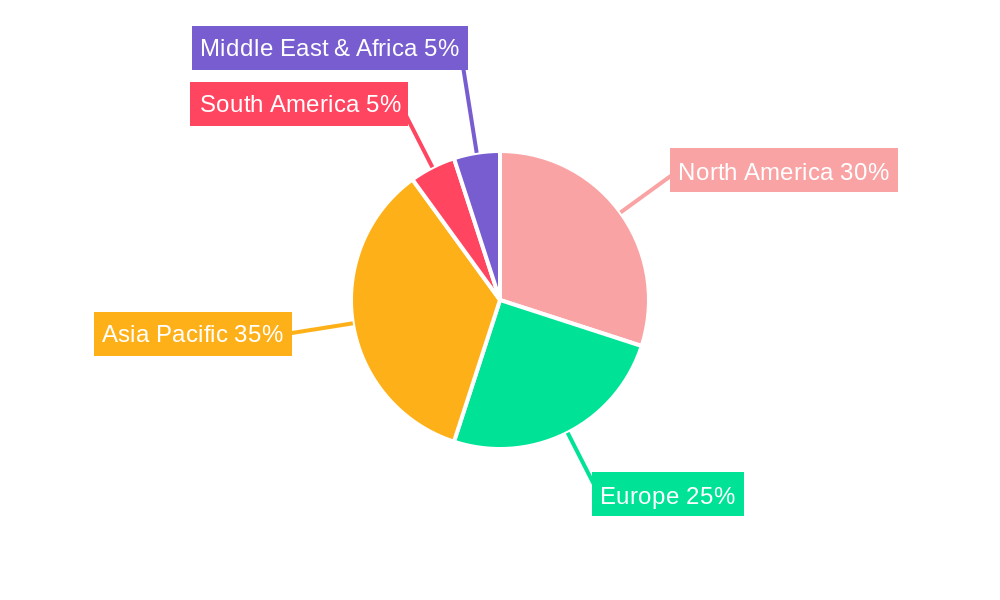
Market segmentation analysis reveals the Building and Construction sector as a dominant end-user, driven by the need for durable and protective coatings in various applications like flooring, roofing, and infrastructure projects. The marine sector's adoption of polyaspartic coatings is increasing due to their superior resistance to saltwater corrosion and harsh marine environments. The Asia-Pacific region is anticipated to lead market growth, propelled by significant infrastructure development and industrialization in countries like China and India. North America and Europe represent established markets with steady growth, while other regions, such as South America and the Middle East, are poised for expansion driven by increasing awareness of the benefits of these high-performance coatings. The competitive landscape features both established players like Sherwin-Williams and BASF, and specialized manufacturers, indicating a dynamic market with both established and emerging players vying for market share. The forecast period indicates continued growth driven by sustained demand and technological innovations within the polyaspartic coatings industry.
Polyaspartic Coatings Market: A Comprehensive Analysis (2019-2033)
This comprehensive report provides an in-depth analysis of the global Polyaspartic Coatings market, offering invaluable insights for stakeholders across the value chain. The study covers the period 2019-2033, with 2025 serving as the base and estimated year. The forecast period extends from 2025 to 2033, while the historical period encompasses 2019-2024. The market is segmented by technology (water-borne, solvent-borne, powder coatings, other technologies), type (pure polyaspartic coatings, hybrid polyaspartic coatings), and end-user industry (building and construction, marine, infrastructure, power generation, other end-user industries). Key players analyzed include Chromaflo Technologies, The Sherwin-Williams Company, LATICRETE International Inc, Akzo Nobel NV, PPG Industries Inc, Enviro Epoxy Products Inc, BASF SE, Iron Man Coatings, Carboline Inc, Polyval Coatings Inc, Flexmar Polyaspartics, NEOGARD, Sika AG, Covestro AG, Duraamen Engineered Products Inc, RPM International, and Florock. This report is crucial for businesses seeking to understand market dynamics, identify growth opportunities, and make informed strategic decisions.
Polyaspartic Coatings Market Structure & Competitive Dynamics
The global polyaspartic coatings market exhibits a moderately consolidated structure, with several major players holding significant market share. Market concentration is influenced by factors such as economies of scale, technological advancements, and brand recognition. The innovation ecosystem is dynamic, with ongoing R&D efforts focused on improving coating performance, durability, and sustainability. Regulatory frameworks, including environmental regulations and safety standards, play a crucial role in shaping market dynamics. Product substitutes, such as epoxy and polyurethane coatings, pose competitive pressure. End-user trends, particularly the growing demand for high-performance coatings in diverse applications, drive market growth. M&A activities have played a role in shaping market consolidation, with deal values reaching xx Million in recent years. Key metrics such as market share, calculated using revenue figures, and M&A deal values are presented and analyzed within the report. The competitive landscape is further analyzed through Porter's Five Forces framework, revealing the intensity of competition and the bargaining power of buyers and suppliers.
- Market Share: The top five players collectively hold approximately xx% of the global market share in 2025.
- M&A Activity: A significant M&A deal involving two major players resulted in a market valuation shift of approximately xx Million in 2024.
Polyaspartic Coatings Market Industry Trends & Insights
The polyaspartic coatings market is experiencing robust growth, driven by several key factors. The increasing demand for durable and high-performance coatings across various industries, including construction, marine, and infrastructure, is a major growth driver. Technological advancements, such as the development of water-borne and hybrid polyaspartic coatings, are enhancing product properties and expanding application possibilities. The rising awareness of environmental concerns is also influencing market trends, with manufacturers focusing on developing more sustainable and eco-friendly coating solutions. Consumer preferences are shifting towards coatings with enhanced aesthetic appeal, improved durability, and ease of application. Competitive dynamics, including price competition, product differentiation, and innovation, significantly shape market evolution. The market is projected to register a Compound Annual Growth Rate (CAGR) of xx% during the forecast period (2025-2033), driven by factors including rising infrastructure investment, construction activities, and increasing demand for corrosion-resistant coatings in various sectors. Market penetration in key end-user industries is also increasing.
Dominant Markets & Segments in Polyaspartic Coatings Market
The building and construction segment represents the largest end-user market for polyaspartic coatings, driven by the rising demand for protective and decorative coatings in residential, commercial, and industrial applications. Geographically, North America currently holds the largest market share, primarily due to substantial investments in infrastructure projects and construction activities, favorable regulatory policies, and a well-established construction industry.
- Key Drivers for Building & Construction Segment: Strong economic growth, increasing urbanization, and robust infrastructure development initiatives.
- Key Drivers for North America: High construction spending, stringent building codes requiring durable coatings, and early adoption of innovative technologies.
Within the technology segment, water-borne polyaspartic coatings are gaining significant traction due to their low VOC content and environmentally friendly nature. Pure polyaspartic coatings dominate the type segment because of their superior performance characteristics compared to hybrid versions. However, hybrid coatings are projected to experience faster growth in the forecast period due to enhanced flexibility and cost-effectiveness.
Polyaspartic Coatings Market Product Innovations
Recent product developments have focused on enhancing the performance characteristics of polyaspartic coatings, including improved durability, UV resistance, and chemical resistance. New applications are emerging in areas such as protective coatings for pipelines and industrial equipment, owing to the unique properties of polyaspartic coatings. The introduction of water-borne formulations addresses environmental concerns and expands the product's application scope. This focus on technological advancements ensures that polyaspartic coatings remain a competitive choice within the broader coatings market, attracting new consumers.
Report Segmentation & Scope
This report provides a detailed segmentation of the polyaspartic coatings market across various parameters:
Technology: Water-borne polyaspartic coatings are expected to witness significant growth due to their low VOC emissions and environmental friendliness, while solvent-borne coatings are forecast to maintain a stable market share. Powder coatings are a niche segment experiencing moderate growth. Other technologies, including UV-curable coatings, are emerging as promising areas of innovation.
Type: Pure polyaspartic coatings currently hold the larger market share, due to their superior properties. However, hybrid polyaspartic coatings are expected to demonstrate higher growth rates.
End-user Industry: The building and construction sector is the leading end-user market, followed by the marine and infrastructure sectors. The power generation and other end-user industries also show promising potential for growth. The report provides detailed market size estimations and growth projections for each segment, along with competitive analysis.
Key Drivers of Polyaspartic Coatings Market Growth
Several factors fuel the growth of the polyaspartic coatings market. Technological advancements continuously enhance the properties of these coatings, leading to broader applications. Strong economic growth in various regions drives infrastructure development and construction activities, boosting demand for high-performance coatings. Stringent environmental regulations are driving the adoption of eco-friendly water-borne coatings. Furthermore, the rising need for corrosion and abrasion-resistant coatings in diverse industries is fueling market growth.
Challenges in the Polyaspartic Coatings Market Sector
Despite the positive outlook, several factors challenge the polyaspartic coatings market. The high initial investment for production facilities and specialized equipment can act as a barrier to market entry for new players. Fluctuations in raw material prices can impact profitability. Stringent regulatory approvals for new coating formulations can slow down product launches. Intense competition from established players with extensive distribution networks poses a significant challenge. Supply chain disruptions can cause delays and impact the overall market dynamics.
Leading Players in the Polyaspartic Coatings Market
- Chromaflo Technologies
- The Sherwin-Williams Company
- LATICRETE International Inc
- Akzo Nobel NV
- PPG Industries Inc
- Enviro Epoxy Products Inc
- BASF SE
- Iron Man Coatings
- Carboline Inc
- Polyval Coatings Inc
- Flexmar Polyaspartics
- NEOGARD
- Sika AG
- Covestro AG
- Duraamen Engineered Products Inc
- RPM International
- Florock
Key Developments in Polyaspartic Coatings Market Sector
- 2024 Q4: The Sherwin-Williams Company launched a new line of high-performance water-borne polyaspartic coatings.
- 2023 Q3: BASF SE announced a strategic partnership with a leading raw material supplier to enhance supply chain security.
- 2022 Q2: Akzo Nobel NV acquired a smaller polyaspartic coatings manufacturer to expand its market reach.
- (Further details on specific developments will be included in the full report.)
Strategic Polyaspartic Coatings Market Outlook
The polyaspartic coatings market is poised for continued growth driven by technological advancements, increasing demand across various end-use industries, and favorable regulatory policies. Strategic opportunities lie in developing innovative, sustainable, and cost-effective coating solutions. Companies focused on research and development, expansion into new markets, and strategic partnerships are expected to thrive in this growing sector. The market's future success will be contingent on continued innovation, sustainability initiatives, and a focus on customer needs.
Polyaspartic Coatings Market Segmentation
-
1. Technology
- 1.1. Water-borne
- 1.2. Solvent-borne
- 1.3. Powder Coatings
- 1.4. Other Technologies
-
2. Type
- 2.1. Pure Polyaspartic Coatings
- 2.2. Hybrid Polyaspartic Coatings
-
3. End-user Industry
- 3.1. Building and Construction
- 3.2. Marine
- 3.3. Infrastructure
- 3.4. Power Generation
- 3.5. Other End-user Industries
Polyaspartic Coatings Market Segmentation By Geography
-
1. Asia Pacific
- 1.1. China
- 1.2. India
- 1.3. Japan
- 1.4. South Korea
- 1.5. Rest of Asia Pacific
-
2. North America
- 2.1. United States
- 2.2. Canada
- 2.3. Mexico
-
3. Europe
- 3.1. Germany
- 3.2. United Kingdom
- 3.3. Italy
- 3.4. France
- 3.5. Rest of Europe
-
4. South America
- 4.1. Brazil
- 4.2. Argentina
- 4.3. Rest of South America
- 5. Middle East
-
6. Saudi Arabia
- 6.1. South Africa
- 6.2. Rest of Middle East
Polyaspartic Coatings Market REPORT HIGHLIGHTS
| Aspects | Details |
|---|---|
| Study Period | 2019-2033 |
| Base Year | 2024 |
| Estimated Year | 2025 |
| Forecast Period | 2025-2033 |
| Historical Period | 2019-2024 |
| Growth Rate | CAGR of > 7.50% from 2019-2033 |
| Segmentation |
|
Table of Contents
- 1. Introduction
- 1.1. Research Scope
- 1.2. Market Segmentation
- 1.3. Research Methodology
- 1.4. Definitions and Assumptions
- 2. Executive Summary
- 2.1. Introduction
- 3. Market Dynamics
- 3.1. Introduction
- 3.2. Market Drivers
- 3.2.1. ; Rapidly Increasing Demand from the Building and Construction Industry; Other Drivers
- 3.3. Market Restrains
- 3.3.1. ; Stringent Environmental Regulations Regarding VOC Emissions
- 3.4. Market Trends
- 3.4.1. Marine Segment to Dominate the Market
- 4. Market Factor Analysis
- 4.1. Porters Five Forces
- 4.2. Supply/Value Chain
- 4.3. PESTEL analysis
- 4.4. Market Entropy
- 4.5. Patent/Trademark Analysis
- 5. Global Polyaspartic Coatings Market Analysis, Insights and Forecast, 2019-2031
- 5.1. Market Analysis, Insights and Forecast - by Technology
- 5.1.1. Water-borne
- 5.1.2. Solvent-borne
- 5.1.3. Powder Coatings
- 5.1.4. Other Technologies
- 5.2. Market Analysis, Insights and Forecast - by Type
- 5.2.1. Pure Polyaspartic Coatings
- 5.2.2. Hybrid Polyaspartic Coatings
- 5.3. Market Analysis, Insights and Forecast - by End-user Industry
- 5.3.1. Building and Construction
- 5.3.2. Marine
- 5.3.3. Infrastructure
- 5.3.4. Power Generation
- 5.3.5. Other End-user Industries
- 5.4. Market Analysis, Insights and Forecast - by Region
- 5.4.1. Asia Pacific
- 5.4.2. North America
- 5.4.3. Europe
- 5.4.4. South America
- 5.4.5. Middle East
- 5.4.6. Saudi Arabia
- 5.1. Market Analysis, Insights and Forecast - by Technology
- 6. Asia Pacific Polyaspartic Coatings Market Analysis, Insights and Forecast, 2019-2031
- 6.1. Market Analysis, Insights and Forecast - by Technology
- 6.1.1. Water-borne
- 6.1.2. Solvent-borne
- 6.1.3. Powder Coatings
- 6.1.4. Other Technologies
- 6.2. Market Analysis, Insights and Forecast - by Type
- 6.2.1. Pure Polyaspartic Coatings
- 6.2.2. Hybrid Polyaspartic Coatings
- 6.3. Market Analysis, Insights and Forecast - by End-user Industry
- 6.3.1. Building and Construction
- 6.3.2. Marine
- 6.3.3. Infrastructure
- 6.3.4. Power Generation
- 6.3.5. Other End-user Industries
- 6.1. Market Analysis, Insights and Forecast - by Technology
- 7. North America Polyaspartic Coatings Market Analysis, Insights and Forecast, 2019-2031
- 7.1. Market Analysis, Insights and Forecast - by Technology
- 7.1.1. Water-borne
- 7.1.2. Solvent-borne
- 7.1.3. Powder Coatings
- 7.1.4. Other Technologies
- 7.2. Market Analysis, Insights and Forecast - by Type
- 7.2.1. Pure Polyaspartic Coatings
- 7.2.2. Hybrid Polyaspartic Coatings
- 7.3. Market Analysis, Insights and Forecast - by End-user Industry
- 7.3.1. Building and Construction
- 7.3.2. Marine
- 7.3.3. Infrastructure
- 7.3.4. Power Generation
- 7.3.5. Other End-user Industries
- 7.1. Market Analysis, Insights and Forecast - by Technology
- 8. Europe Polyaspartic Coatings Market Analysis, Insights and Forecast, 2019-2031
- 8.1. Market Analysis, Insights and Forecast - by Technology
- 8.1.1. Water-borne
- 8.1.2. Solvent-borne
- 8.1.3. Powder Coatings
- 8.1.4. Other Technologies
- 8.2. Market Analysis, Insights and Forecast - by Type
- 8.2.1. Pure Polyaspartic Coatings
- 8.2.2. Hybrid Polyaspartic Coatings
- 8.3. Market Analysis, Insights and Forecast - by End-user Industry
- 8.3.1. Building and Construction
- 8.3.2. Marine
- 8.3.3. Infrastructure
- 8.3.4. Power Generation
- 8.3.5. Other End-user Industries
- 8.1. Market Analysis, Insights and Forecast - by Technology
- 9. South America Polyaspartic Coatings Market Analysis, Insights and Forecast, 2019-2031
- 9.1. Market Analysis, Insights and Forecast - by Technology
- 9.1.1. Water-borne
- 9.1.2. Solvent-borne
- 9.1.3. Powder Coatings
- 9.1.4. Other Technologies
- 9.2. Market Analysis, Insights and Forecast - by Type
- 9.2.1. Pure Polyaspartic Coatings
- 9.2.2. Hybrid Polyaspartic Coatings
- 9.3. Market Analysis, Insights and Forecast - by End-user Industry
- 9.3.1. Building and Construction
- 9.3.2. Marine
- 9.3.3. Infrastructure
- 9.3.4. Power Generation
- 9.3.5. Other End-user Industries
- 9.1. Market Analysis, Insights and Forecast - by Technology
- 10. Middle East Polyaspartic Coatings Market Analysis, Insights and Forecast, 2019-2031
- 10.1. Market Analysis, Insights and Forecast - by Technology
- 10.1.1. Water-borne
- 10.1.2. Solvent-borne
- 10.1.3. Powder Coatings
- 10.1.4. Other Technologies
- 10.2. Market Analysis, Insights and Forecast - by Type
- 10.2.1. Pure Polyaspartic Coatings
- 10.2.2. Hybrid Polyaspartic Coatings
- 10.3. Market Analysis, Insights and Forecast - by End-user Industry
- 10.3.1. Building and Construction
- 10.3.2. Marine
- 10.3.3. Infrastructure
- 10.3.4. Power Generation
- 10.3.5. Other End-user Industries
- 10.1. Market Analysis, Insights and Forecast - by Technology
- 11. Saudi Arabia Polyaspartic Coatings Market Analysis, Insights and Forecast, 2019-2031
- 11.1. Market Analysis, Insights and Forecast - by Technology
- 11.1.1. Water-borne
- 11.1.2. Solvent-borne
- 11.1.3. Powder Coatings
- 11.1.4. Other Technologies
- 11.2. Market Analysis, Insights and Forecast - by Type
- 11.2.1. Pure Polyaspartic Coatings
- 11.2.2. Hybrid Polyaspartic Coatings
- 11.3. Market Analysis, Insights and Forecast - by End-user Industry
- 11.3.1. Building and Construction
- 11.3.2. Marine
- 11.3.3. Infrastructure
- 11.3.4. Power Generation
- 11.3.5. Other End-user Industries
- 11.1. Market Analysis, Insights and Forecast - by Technology
- 12. Asia Pacific Polyaspartic Coatings Market Analysis, Insights and Forecast, 2019-2031
- 12.1. Market Analysis, Insights and Forecast - By Country/Sub-region
- 12.1.1 China
- 12.1.2 India
- 12.1.3 Japan
- 12.1.4 South Korea
- 12.1.5 Rest of Asia Pacific
- 13. North America Polyaspartic Coatings Market Analysis, Insights and Forecast, 2019-2031
- 13.1. Market Analysis, Insights and Forecast - By Country/Sub-region
- 13.1.1 United States
- 13.1.2 Canada
- 13.1.3 Mexico
- 14. Europe Polyaspartic Coatings Market Analysis, Insights and Forecast, 2019-2031
- 14.1. Market Analysis, Insights and Forecast - By Country/Sub-region
- 14.1.1 Germany
- 14.1.2 United Kingdom
- 14.1.3 Italy
- 14.1.4 France
- 14.1.5 Rest of Europe
- 15. South America Polyaspartic Coatings Market Analysis, Insights and Forecast, 2019-2031
- 15.1. Market Analysis, Insights and Forecast - By Country/Sub-region
- 15.1.1 Brazil
- 15.1.2 Argentina
- 15.1.3 Rest of South America
- 16. Middle East Polyaspartic Coatings Market Analysis, Insights and Forecast, 2019-2031
- 16.1. Market Analysis, Insights and Forecast - By Country/Sub-region
- 16.1.1 Middle East
- 16.1.2 Africa
- 17. Saudi Arabia Polyaspartic Coatings Market Analysis, Insights and Forecast, 2019-2031
- 17.1. Market Analysis, Insights and Forecast - By Country/Sub-region
- 17.1.1 South Africa
- 17.1.2 Rest of Middle East
- 18. Competitive Analysis
- 18.1. Global Market Share Analysis 2024
- 18.2. Company Profiles
- 18.2.1 Chromaflo Technologies
- 18.2.1.1. Overview
- 18.2.1.2. Products
- 18.2.1.3. SWOT Analysis
- 18.2.1.4. Recent Developments
- 18.2.1.5. Financials (Based on Availability)
- 18.2.2 The Sherwin-Williams Company*List Not Exhaustive
- 18.2.2.1. Overview
- 18.2.2.2. Products
- 18.2.2.3. SWOT Analysis
- 18.2.2.4. Recent Developments
- 18.2.2.5. Financials (Based on Availability)
- 18.2.3 LATICRETE International Inc
- 18.2.3.1. Overview
- 18.2.3.2. Products
- 18.2.3.3. SWOT Analysis
- 18.2.3.4. Recent Developments
- 18.2.3.5. Financials (Based on Availability)
- 18.2.4 Akzo Nobel NV
- 18.2.4.1. Overview
- 18.2.4.2. Products
- 18.2.4.3. SWOT Analysis
- 18.2.4.4. Recent Developments
- 18.2.4.5. Financials (Based on Availability)
- 18.2.5 PPG Industries Inc
- 18.2.5.1. Overview
- 18.2.5.2. Products
- 18.2.5.3. SWOT Analysis
- 18.2.5.4. Recent Developments
- 18.2.5.5. Financials (Based on Availability)
- 18.2.6 Enviro Epoxy Products Inc
- 18.2.6.1. Overview
- 18.2.6.2. Products
- 18.2.6.3. SWOT Analysis
- 18.2.6.4. Recent Developments
- 18.2.6.5. Financials (Based on Availability)
- 18.2.7 BASF SE
- 18.2.7.1. Overview
- 18.2.7.2. Products
- 18.2.7.3. SWOT Analysis
- 18.2.7.4. Recent Developments
- 18.2.7.5. Financials (Based on Availability)
- 18.2.8 Iron Man Coatings
- 18.2.8.1. Overview
- 18.2.8.2. Products
- 18.2.8.3. SWOT Analysis
- 18.2.8.4. Recent Developments
- 18.2.8.5. Financials (Based on Availability)
- 18.2.9 Carboline Inc
- 18.2.9.1. Overview
- 18.2.9.2. Products
- 18.2.9.3. SWOT Analysis
- 18.2.9.4. Recent Developments
- 18.2.9.5. Financials (Based on Availability)
- 18.2.10 Polyval Coatings Inc
- 18.2.10.1. Overview
- 18.2.10.2. Products
- 18.2.10.3. SWOT Analysis
- 18.2.10.4. Recent Developments
- 18.2.10.5. Financials (Based on Availability)
- 18.2.11 Flexmar Polyaspartics
- 18.2.11.1. Overview
- 18.2.11.2. Products
- 18.2.11.3. SWOT Analysis
- 18.2.11.4. Recent Developments
- 18.2.11.5. Financials (Based on Availability)
- 18.2.12 NEOGARD
- 18.2.12.1. Overview
- 18.2.12.2. Products
- 18.2.12.3. SWOT Analysis
- 18.2.12.4. Recent Developments
- 18.2.12.5. Financials (Based on Availability)
- 18.2.13 Sika AG
- 18.2.13.1. Overview
- 18.2.13.2. Products
- 18.2.13.3. SWOT Analysis
- 18.2.13.4. Recent Developments
- 18.2.13.5. Financials (Based on Availability)
- 18.2.14 Covestro AG
- 18.2.14.1. Overview
- 18.2.14.2. Products
- 18.2.14.3. SWOT Analysis
- 18.2.14.4. Recent Developments
- 18.2.14.5. Financials (Based on Availability)
- 18.2.15 Duraamen Engineered Products Inc
- 18.2.15.1. Overview
- 18.2.15.2. Products
- 18.2.15.3. SWOT Analysis
- 18.2.15.4. Recent Developments
- 18.2.15.5. Financials (Based on Availability)
- 18.2.16 RPM International
- 18.2.16.1. Overview
- 18.2.16.2. Products
- 18.2.16.3. SWOT Analysis
- 18.2.16.4. Recent Developments
- 18.2.16.5. Financials (Based on Availability)
- 18.2.17 Florock
- 18.2.17.1. Overview
- 18.2.17.2. Products
- 18.2.17.3. SWOT Analysis
- 18.2.17.4. Recent Developments
- 18.2.17.5. Financials (Based on Availability)
- 18.2.1 Chromaflo Technologies
List of Figures
- Figure 1: Global Polyaspartic Coatings Market Revenue Breakdown (Million, %) by Region 2024 & 2032
- Figure 2: Global Polyaspartic Coatings Market Volume Breakdown (liter , %) by Region 2024 & 2032
- Figure 3: Asia Pacific Polyaspartic Coatings Market Revenue (Million), by Country 2024 & 2032
- Figure 4: Asia Pacific Polyaspartic Coatings Market Volume (liter ), by Country 2024 & 2032
- Figure 5: Asia Pacific Polyaspartic Coatings Market Revenue Share (%), by Country 2024 & 2032
- Figure 6: Asia Pacific Polyaspartic Coatings Market Volume Share (%), by Country 2024 & 2032
- Figure 7: North America Polyaspartic Coatings Market Revenue (Million), by Country 2024 & 2032
- Figure 8: North America Polyaspartic Coatings Market Volume (liter ), by Country 2024 & 2032
- Figure 9: North America Polyaspartic Coatings Market Revenue Share (%), by Country 2024 & 2032
- Figure 10: North America Polyaspartic Coatings Market Volume Share (%), by Country 2024 & 2032
- Figure 11: Europe Polyaspartic Coatings Market Revenue (Million), by Country 2024 & 2032
- Figure 12: Europe Polyaspartic Coatings Market Volume (liter ), by Country 2024 & 2032
- Figure 13: Europe Polyaspartic Coatings Market Revenue Share (%), by Country 2024 & 2032
- Figure 14: Europe Polyaspartic Coatings Market Volume Share (%), by Country 2024 & 2032
- Figure 15: South America Polyaspartic Coatings Market Revenue (Million), by Country 2024 & 2032
- Figure 16: South America Polyaspartic Coatings Market Volume (liter ), by Country 2024 & 2032
- Figure 17: South America Polyaspartic Coatings Market Revenue Share (%), by Country 2024 & 2032
- Figure 18: South America Polyaspartic Coatings Market Volume Share (%), by Country 2024 & 2032
- Figure 19: Middle East Polyaspartic Coatings Market Revenue (Million), by Country 2024 & 2032
- Figure 20: Middle East Polyaspartic Coatings Market Volume (liter ), by Country 2024 & 2032
- Figure 21: Middle East Polyaspartic Coatings Market Revenue Share (%), by Country 2024 & 2032
- Figure 22: Middle East Polyaspartic Coatings Market Volume Share (%), by Country 2024 & 2032
- Figure 23: Saudi Arabia Polyaspartic Coatings Market Revenue (Million), by Country 2024 & 2032
- Figure 24: Saudi Arabia Polyaspartic Coatings Market Volume (liter ), by Country 2024 & 2032
- Figure 25: Saudi Arabia Polyaspartic Coatings Market Revenue Share (%), by Country 2024 & 2032
- Figure 26: Saudi Arabia Polyaspartic Coatings Market Volume Share (%), by Country 2024 & 2032
- Figure 27: Asia Pacific Polyaspartic Coatings Market Revenue (Million), by Technology 2024 & 2032
- Figure 28: Asia Pacific Polyaspartic Coatings Market Volume (liter ), by Technology 2024 & 2032
- Figure 29: Asia Pacific Polyaspartic Coatings Market Revenue Share (%), by Technology 2024 & 2032
- Figure 30: Asia Pacific Polyaspartic Coatings Market Volume Share (%), by Technology 2024 & 2032
- Figure 31: Asia Pacific Polyaspartic Coatings Market Revenue (Million), by Type 2024 & 2032
- Figure 32: Asia Pacific Polyaspartic Coatings Market Volume (liter ), by Type 2024 & 2032
- Figure 33: Asia Pacific Polyaspartic Coatings Market Revenue Share (%), by Type 2024 & 2032
- Figure 34: Asia Pacific Polyaspartic Coatings Market Volume Share (%), by Type 2024 & 2032
- Figure 35: Asia Pacific Polyaspartic Coatings Market Revenue (Million), by End-user Industry 2024 & 2032
- Figure 36: Asia Pacific Polyaspartic Coatings Market Volume (liter ), by End-user Industry 2024 & 2032
- Figure 37: Asia Pacific Polyaspartic Coatings Market Revenue Share (%), by End-user Industry 2024 & 2032
- Figure 38: Asia Pacific Polyaspartic Coatings Market Volume Share (%), by End-user Industry 2024 & 2032
- Figure 39: Asia Pacific Polyaspartic Coatings Market Revenue (Million), by Country 2024 & 2032
- Figure 40: Asia Pacific Polyaspartic Coatings Market Volume (liter ), by Country 2024 & 2032
- Figure 41: Asia Pacific Polyaspartic Coatings Market Revenue Share (%), by Country 2024 & 2032
- Figure 42: Asia Pacific Polyaspartic Coatings Market Volume Share (%), by Country 2024 & 2032
- Figure 43: North America Polyaspartic Coatings Market Revenue (Million), by Technology 2024 & 2032
- Figure 44: North America Polyaspartic Coatings Market Volume (liter ), by Technology 2024 & 2032
- Figure 45: North America Polyaspartic Coatings Market Revenue Share (%), by Technology 2024 & 2032
- Figure 46: North America Polyaspartic Coatings Market Volume Share (%), by Technology 2024 & 2032
- Figure 47: North America Polyaspartic Coatings Market Revenue (Million), by Type 2024 & 2032
- Figure 48: North America Polyaspartic Coatings Market Volume (liter ), by Type 2024 & 2032
- Figure 49: North America Polyaspartic Coatings Market Revenue Share (%), by Type 2024 & 2032
- Figure 50: North America Polyaspartic Coatings Market Volume Share (%), by Type 2024 & 2032
- Figure 51: North America Polyaspartic Coatings Market Revenue (Million), by End-user Industry 2024 & 2032
- Figure 52: North America Polyaspartic Coatings Market Volume (liter ), by End-user Industry 2024 & 2032
- Figure 53: North America Polyaspartic Coatings Market Revenue Share (%), by End-user Industry 2024 & 2032
- Figure 54: North America Polyaspartic Coatings Market Volume Share (%), by End-user Industry 2024 & 2032
- Figure 55: North America Polyaspartic Coatings Market Revenue (Million), by Country 2024 & 2032
- Figure 56: North America Polyaspartic Coatings Market Volume (liter ), by Country 2024 & 2032
- Figure 57: North America Polyaspartic Coatings Market Revenue Share (%), by Country 2024 & 2032
- Figure 58: North America Polyaspartic Coatings Market Volume Share (%), by Country 2024 & 2032
- Figure 59: Europe Polyaspartic Coatings Market Revenue (Million), by Technology 2024 & 2032
- Figure 60: Europe Polyaspartic Coatings Market Volume (liter ), by Technology 2024 & 2032
- Figure 61: Europe Polyaspartic Coatings Market Revenue Share (%), by Technology 2024 & 2032
- Figure 62: Europe Polyaspartic Coatings Market Volume Share (%), by Technology 2024 & 2032
- Figure 63: Europe Polyaspartic Coatings Market Revenue (Million), by Type 2024 & 2032
- Figure 64: Europe Polyaspartic Coatings Market Volume (liter ), by Type 2024 & 2032
- Figure 65: Europe Polyaspartic Coatings Market Revenue Share (%), by Type 2024 & 2032
- Figure 66: Europe Polyaspartic Coatings Market Volume Share (%), by Type 2024 & 2032
- Figure 67: Europe Polyaspartic Coatings Market Revenue (Million), by End-user Industry 2024 & 2032
- Figure 68: Europe Polyaspartic Coatings Market Volume (liter ), by End-user Industry 2024 & 2032
- Figure 69: Europe Polyaspartic Coatings Market Revenue Share (%), by End-user Industry 2024 & 2032
- Figure 70: Europe Polyaspartic Coatings Market Volume Share (%), by End-user Industry 2024 & 2032
- Figure 71: Europe Polyaspartic Coatings Market Revenue (Million), by Country 2024 & 2032
- Figure 72: Europe Polyaspartic Coatings Market Volume (liter ), by Country 2024 & 2032
- Figure 73: Europe Polyaspartic Coatings Market Revenue Share (%), by Country 2024 & 2032
- Figure 74: Europe Polyaspartic Coatings Market Volume Share (%), by Country 2024 & 2032
- Figure 75: South America Polyaspartic Coatings Market Revenue (Million), by Technology 2024 & 2032
- Figure 76: South America Polyaspartic Coatings Market Volume (liter ), by Technology 2024 & 2032
- Figure 77: South America Polyaspartic Coatings Market Revenue Share (%), by Technology 2024 & 2032
- Figure 78: South America Polyaspartic Coatings Market Volume Share (%), by Technology 2024 & 2032
- Figure 79: South America Polyaspartic Coatings Market Revenue (Million), by Type 2024 & 2032
- Figure 80: South America Polyaspartic Coatings Market Volume (liter ), by Type 2024 & 2032
- Figure 81: South America Polyaspartic Coatings Market Revenue Share (%), by Type 2024 & 2032
- Figure 82: South America Polyaspartic Coatings Market Volume Share (%), by Type 2024 & 2032
- Figure 83: South America Polyaspartic Coatings Market Revenue (Million), by End-user Industry 2024 & 2032
- Figure 84: South America Polyaspartic Coatings Market Volume (liter ), by End-user Industry 2024 & 2032
- Figure 85: South America Polyaspartic Coatings Market Revenue Share (%), by End-user Industry 2024 & 2032
- Figure 86: South America Polyaspartic Coatings Market Volume Share (%), by End-user Industry 2024 & 2032
- Figure 87: South America Polyaspartic Coatings Market Revenue (Million), by Country 2024 & 2032
- Figure 88: South America Polyaspartic Coatings Market Volume (liter ), by Country 2024 & 2032
- Figure 89: South America Polyaspartic Coatings Market Revenue Share (%), by Country 2024 & 2032
- Figure 90: South America Polyaspartic Coatings Market Volume Share (%), by Country 2024 & 2032
- Figure 91: Middle East Polyaspartic Coatings Market Revenue (Million), by Technology 2024 & 2032
- Figure 92: Middle East Polyaspartic Coatings Market Volume (liter ), by Technology 2024 & 2032
- Figure 93: Middle East Polyaspartic Coatings Market Revenue Share (%), by Technology 2024 & 2032
- Figure 94: Middle East Polyaspartic Coatings Market Volume Share (%), by Technology 2024 & 2032
- Figure 95: Middle East Polyaspartic Coatings Market Revenue (Million), by Type 2024 & 2032
- Figure 96: Middle East Polyaspartic Coatings Market Volume (liter ), by Type 2024 & 2032
- Figure 97: Middle East Polyaspartic Coatings Market Revenue Share (%), by Type 2024 & 2032
- Figure 98: Middle East Polyaspartic Coatings Market Volume Share (%), by Type 2024 & 2032
- Figure 99: Middle East Polyaspartic Coatings Market Revenue (Million), by End-user Industry 2024 & 2032
- Figure 100: Middle East Polyaspartic Coatings Market Volume (liter ), by End-user Industry 2024 & 2032
- Figure 101: Middle East Polyaspartic Coatings Market Revenue Share (%), by End-user Industry 2024 & 2032
- Figure 102: Middle East Polyaspartic Coatings Market Volume Share (%), by End-user Industry 2024 & 2032
- Figure 103: Middle East Polyaspartic Coatings Market Revenue (Million), by Country 2024 & 2032
- Figure 104: Middle East Polyaspartic Coatings Market Volume (liter ), by Country 2024 & 2032
- Figure 105: Middle East Polyaspartic Coatings Market Revenue Share (%), by Country 2024 & 2032
- Figure 106: Middle East Polyaspartic Coatings Market Volume Share (%), by Country 2024 & 2032
- Figure 107: Saudi Arabia Polyaspartic Coatings Market Revenue (Million), by Technology 2024 & 2032
- Figure 108: Saudi Arabia Polyaspartic Coatings Market Volume (liter ), by Technology 2024 & 2032
- Figure 109: Saudi Arabia Polyaspartic Coatings Market Revenue Share (%), by Technology 2024 & 2032
- Figure 110: Saudi Arabia Polyaspartic Coatings Market Volume Share (%), by Technology 2024 & 2032
- Figure 111: Saudi Arabia Polyaspartic Coatings Market Revenue (Million), by Type 2024 & 2032
- Figure 112: Saudi Arabia Polyaspartic Coatings Market Volume (liter ), by Type 2024 & 2032
- Figure 113: Saudi Arabia Polyaspartic Coatings Market Revenue Share (%), by Type 2024 & 2032
- Figure 114: Saudi Arabia Polyaspartic Coatings Market Volume Share (%), by Type 2024 & 2032
- Figure 115: Saudi Arabia Polyaspartic Coatings Market Revenue (Million), by End-user Industry 2024 & 2032
- Figure 116: Saudi Arabia Polyaspartic Coatings Market Volume (liter ), by End-user Industry 2024 & 2032
- Figure 117: Saudi Arabia Polyaspartic Coatings Market Revenue Share (%), by End-user Industry 2024 & 2032
- Figure 118: Saudi Arabia Polyaspartic Coatings Market Volume Share (%), by End-user Industry 2024 & 2032
- Figure 119: Saudi Arabia Polyaspartic Coatings Market Revenue (Million), by Country 2024 & 2032
- Figure 120: Saudi Arabia Polyaspartic Coatings Market Volume (liter ), by Country 2024 & 2032
- Figure 121: Saudi Arabia Polyaspartic Coatings Market Revenue Share (%), by Country 2024 & 2032
- Figure 122: Saudi Arabia Polyaspartic Coatings Market Volume Share (%), by Country 2024 & 2032
List of Tables
- Table 1: Global Polyaspartic Coatings Market Revenue Million Forecast, by Region 2019 & 2032
- Table 2: Global Polyaspartic Coatings Market Volume liter Forecast, by Region 2019 & 2032
- Table 3: Global Polyaspartic Coatings Market Revenue Million Forecast, by Technology 2019 & 2032
- Table 4: Global Polyaspartic Coatings Market Volume liter Forecast, by Technology 2019 & 2032
- Table 5: Global Polyaspartic Coatings Market Revenue Million Forecast, by Type 2019 & 2032
- Table 6: Global Polyaspartic Coatings Market Volume liter Forecast, by Type 2019 & 2032
- Table 7: Global Polyaspartic Coatings Market Revenue Million Forecast, by End-user Industry 2019 & 2032
- Table 8: Global Polyaspartic Coatings Market Volume liter Forecast, by End-user Industry 2019 & 2032
- Table 9: Global Polyaspartic Coatings Market Revenue Million Forecast, by Region 2019 & 2032
- Table 10: Global Polyaspartic Coatings Market Volume liter Forecast, by Region 2019 & 2032
- Table 11: Global Polyaspartic Coatings Market Revenue Million Forecast, by Country 2019 & 2032
- Table 12: Global Polyaspartic Coatings Market Volume liter Forecast, by Country 2019 & 2032
- Table 13: China Polyaspartic Coatings Market Revenue (Million) Forecast, by Application 2019 & 2032
- Table 14: China Polyaspartic Coatings Market Volume (liter ) Forecast, by Application 2019 & 2032
- Table 15: India Polyaspartic Coatings Market Revenue (Million) Forecast, by Application 2019 & 2032
- Table 16: India Polyaspartic Coatings Market Volume (liter ) Forecast, by Application 2019 & 2032
- Table 17: Japan Polyaspartic Coatings Market Revenue (Million) Forecast, by Application 2019 & 2032
- Table 18: Japan Polyaspartic Coatings Market Volume (liter ) Forecast, by Application 2019 & 2032
- Table 19: South Korea Polyaspartic Coatings Market Revenue (Million) Forecast, by Application 2019 & 2032
- Table 20: South Korea Polyaspartic Coatings Market Volume (liter ) Forecast, by Application 2019 & 2032
- Table 21: Rest of Asia Pacific Polyaspartic Coatings Market Revenue (Million) Forecast, by Application 2019 & 2032
- Table 22: Rest of Asia Pacific Polyaspartic Coatings Market Volume (liter ) Forecast, by Application 2019 & 2032
- Table 23: Global Polyaspartic Coatings Market Revenue Million Forecast, by Country 2019 & 2032
- Table 24: Global Polyaspartic Coatings Market Volume liter Forecast, by Country 2019 & 2032
- Table 25: United States Polyaspartic Coatings Market Revenue (Million) Forecast, by Application 2019 & 2032
- Table 26: United States Polyaspartic Coatings Market Volume (liter ) Forecast, by Application 2019 & 2032
- Table 27: Canada Polyaspartic Coatings Market Revenue (Million) Forecast, by Application 2019 & 2032
- Table 28: Canada Polyaspartic Coatings Market Volume (liter ) Forecast, by Application 2019 & 2032
- Table 29: Mexico Polyaspartic Coatings Market Revenue (Million) Forecast, by Application 2019 & 2032
- Table 30: Mexico Polyaspartic Coatings Market Volume (liter ) Forecast, by Application 2019 & 2032
- Table 31: Global Polyaspartic Coatings Market Revenue Million Forecast, by Country 2019 & 2032
- Table 32: Global Polyaspartic Coatings Market Volume liter Forecast, by Country 2019 & 2032
- Table 33: Germany Polyaspartic Coatings Market Revenue (Million) Forecast, by Application 2019 & 2032
- Table 34: Germany Polyaspartic Coatings Market Volume (liter ) Forecast, by Application 2019 & 2032
- Table 35: United Kingdom Polyaspartic Coatings Market Revenue (Million) Forecast, by Application 2019 & 2032
- Table 36: United Kingdom Polyaspartic Coatings Market Volume (liter ) Forecast, by Application 2019 & 2032
- Table 37: Italy Polyaspartic Coatings Market Revenue (Million) Forecast, by Application 2019 & 2032
- Table 38: Italy Polyaspartic Coatings Market Volume (liter ) Forecast, by Application 2019 & 2032
- Table 39: France Polyaspartic Coatings Market Revenue (Million) Forecast, by Application 2019 & 2032
- Table 40: France Polyaspartic Coatings Market Volume (liter ) Forecast, by Application 2019 & 2032
- Table 41: Rest of Europe Polyaspartic Coatings Market Revenue (Million) Forecast, by Application 2019 & 2032
- Table 42: Rest of Europe Polyaspartic Coatings Market Volume (liter ) Forecast, by Application 2019 & 2032
- Table 43: Global Polyaspartic Coatings Market Revenue Million Forecast, by Country 2019 & 2032
- Table 44: Global Polyaspartic Coatings Market Volume liter Forecast, by Country 2019 & 2032
- Table 45: Brazil Polyaspartic Coatings Market Revenue (Million) Forecast, by Application 2019 & 2032
- Table 46: Brazil Polyaspartic Coatings Market Volume (liter ) Forecast, by Application 2019 & 2032
- Table 47: Argentina Polyaspartic Coatings Market Revenue (Million) Forecast, by Application 2019 & 2032
- Table 48: Argentina Polyaspartic Coatings Market Volume (liter ) Forecast, by Application 2019 & 2032
- Table 49: Rest of South America Polyaspartic Coatings Market Revenue (Million) Forecast, by Application 2019 & 2032
- Table 50: Rest of South America Polyaspartic Coatings Market Volume (liter ) Forecast, by Application 2019 & 2032
- Table 51: Global Polyaspartic Coatings Market Revenue Million Forecast, by Country 2019 & 2032
- Table 52: Global Polyaspartic Coatings Market Volume liter Forecast, by Country 2019 & 2032
- Table 53: Middle East Polyaspartic Coatings Market Revenue (Million) Forecast, by Application 2019 & 2032
- Table 54: Middle East Polyaspartic Coatings Market Volume (liter ) Forecast, by Application 2019 & 2032
- Table 55: Africa Polyaspartic Coatings Market Revenue (Million) Forecast, by Application 2019 & 2032
- Table 56: Africa Polyaspartic Coatings Market Volume (liter ) Forecast, by Application 2019 & 2032
- Table 57: Global Polyaspartic Coatings Market Revenue Million Forecast, by Country 2019 & 2032
- Table 58: Global Polyaspartic Coatings Market Volume liter Forecast, by Country 2019 & 2032
- Table 59: South Africa Polyaspartic Coatings Market Revenue (Million) Forecast, by Application 2019 & 2032
- Table 60: South Africa Polyaspartic Coatings Market Volume (liter ) Forecast, by Application 2019 & 2032
- Table 61: Rest of Middle East Polyaspartic Coatings Market Revenue (Million) Forecast, by Application 2019 & 2032
- Table 62: Rest of Middle East Polyaspartic Coatings Market Volume (liter ) Forecast, by Application 2019 & 2032
- Table 63: Global Polyaspartic Coatings Market Revenue Million Forecast, by Technology 2019 & 2032
- Table 64: Global Polyaspartic Coatings Market Volume liter Forecast, by Technology 2019 & 2032
- Table 65: Global Polyaspartic Coatings Market Revenue Million Forecast, by Type 2019 & 2032
- Table 66: Global Polyaspartic Coatings Market Volume liter Forecast, by Type 2019 & 2032
- Table 67: Global Polyaspartic Coatings Market Revenue Million Forecast, by End-user Industry 2019 & 2032
- Table 68: Global Polyaspartic Coatings Market Volume liter Forecast, by End-user Industry 2019 & 2032
- Table 69: Global Polyaspartic Coatings Market Revenue Million Forecast, by Country 2019 & 2032
- Table 70: Global Polyaspartic Coatings Market Volume liter Forecast, by Country 2019 & 2032
- Table 71: China Polyaspartic Coatings Market Revenue (Million) Forecast, by Application 2019 & 2032
- Table 72: China Polyaspartic Coatings Market Volume (liter ) Forecast, by Application 2019 & 2032
- Table 73: India Polyaspartic Coatings Market Revenue (Million) Forecast, by Application 2019 & 2032
- Table 74: India Polyaspartic Coatings Market Volume (liter ) Forecast, by Application 2019 & 2032
- Table 75: Japan Polyaspartic Coatings Market Revenue (Million) Forecast, by Application 2019 & 2032
- Table 76: Japan Polyaspartic Coatings Market Volume (liter ) Forecast, by Application 2019 & 2032
- Table 77: South Korea Polyaspartic Coatings Market Revenue (Million) Forecast, by Application 2019 & 2032
- Table 78: South Korea Polyaspartic Coatings Market Volume (liter ) Forecast, by Application 2019 & 2032
- Table 79: Rest of Asia Pacific Polyaspartic Coatings Market Revenue (Million) Forecast, by Application 2019 & 2032
- Table 80: Rest of Asia Pacific Polyaspartic Coatings Market Volume (liter ) Forecast, by Application 2019 & 2032
- Table 81: Global Polyaspartic Coatings Market Revenue Million Forecast, by Technology 2019 & 2032
- Table 82: Global Polyaspartic Coatings Market Volume liter Forecast, by Technology 2019 & 2032
- Table 83: Global Polyaspartic Coatings Market Revenue Million Forecast, by Type 2019 & 2032
- Table 84: Global Polyaspartic Coatings Market Volume liter Forecast, by Type 2019 & 2032
- Table 85: Global Polyaspartic Coatings Market Revenue Million Forecast, by End-user Industry 2019 & 2032
- Table 86: Global Polyaspartic Coatings Market Volume liter Forecast, by End-user Industry 2019 & 2032
- Table 87: Global Polyaspartic Coatings Market Revenue Million Forecast, by Country 2019 & 2032
- Table 88: Global Polyaspartic Coatings Market Volume liter Forecast, by Country 2019 & 2032
- Table 89: United States Polyaspartic Coatings Market Revenue (Million) Forecast, by Application 2019 & 2032
- Table 90: United States Polyaspartic Coatings Market Volume (liter ) Forecast, by Application 2019 & 2032
- Table 91: Canada Polyaspartic Coatings Market Revenue (Million) Forecast, by Application 2019 & 2032
- Table 92: Canada Polyaspartic Coatings Market Volume (liter ) Forecast, by Application 2019 & 2032
- Table 93: Mexico Polyaspartic Coatings Market Revenue (Million) Forecast, by Application 2019 & 2032
- Table 94: Mexico Polyaspartic Coatings Market Volume (liter ) Forecast, by Application 2019 & 2032
- Table 95: Global Polyaspartic Coatings Market Revenue Million Forecast, by Technology 2019 & 2032
- Table 96: Global Polyaspartic Coatings Market Volume liter Forecast, by Technology 2019 & 2032
- Table 97: Global Polyaspartic Coatings Market Revenue Million Forecast, by Type 2019 & 2032
- Table 98: Global Polyaspartic Coatings Market Volume liter Forecast, by Type 2019 & 2032
- Table 99: Global Polyaspartic Coatings Market Revenue Million Forecast, by End-user Industry 2019 & 2032
- Table 100: Global Polyaspartic Coatings Market Volume liter Forecast, by End-user Industry 2019 & 2032
- Table 101: Global Polyaspartic Coatings Market Revenue Million Forecast, by Country 2019 & 2032
- Table 102: Global Polyaspartic Coatings Market Volume liter Forecast, by Country 2019 & 2032
- Table 103: Germany Polyaspartic Coatings Market Revenue (Million) Forecast, by Application 2019 & 2032
- Table 104: Germany Polyaspartic Coatings Market Volume (liter ) Forecast, by Application 2019 & 2032
- Table 105: United Kingdom Polyaspartic Coatings Market Revenue (Million) Forecast, by Application 2019 & 2032
- Table 106: United Kingdom Polyaspartic Coatings Market Volume (liter ) Forecast, by Application 2019 & 2032
- Table 107: Italy Polyaspartic Coatings Market Revenue (Million) Forecast, by Application 2019 & 2032
- Table 108: Italy Polyaspartic Coatings Market Volume (liter ) Forecast, by Application 2019 & 2032
- Table 109: France Polyaspartic Coatings Market Revenue (Million) Forecast, by Application 2019 & 2032
- Table 110: France Polyaspartic Coatings Market Volume (liter ) Forecast, by Application 2019 & 2032
- Table 111: Rest of Europe Polyaspartic Coatings Market Revenue (Million) Forecast, by Application 2019 & 2032
- Table 112: Rest of Europe Polyaspartic Coatings Market Volume (liter ) Forecast, by Application 2019 & 2032
- Table 113: Global Polyaspartic Coatings Market Revenue Million Forecast, by Technology 2019 & 2032
- Table 114: Global Polyaspartic Coatings Market Volume liter Forecast, by Technology 2019 & 2032
- Table 115: Global Polyaspartic Coatings Market Revenue Million Forecast, by Type 2019 & 2032
- Table 116: Global Polyaspartic Coatings Market Volume liter Forecast, by Type 2019 & 2032
- Table 117: Global Polyaspartic Coatings Market Revenue Million Forecast, by End-user Industry 2019 & 2032
- Table 118: Global Polyaspartic Coatings Market Volume liter Forecast, by End-user Industry 2019 & 2032
- Table 119: Global Polyaspartic Coatings Market Revenue Million Forecast, by Country 2019 & 2032
- Table 120: Global Polyaspartic Coatings Market Volume liter Forecast, by Country 2019 & 2032
- Table 121: Brazil Polyaspartic Coatings Market Revenue (Million) Forecast, by Application 2019 & 2032
- Table 122: Brazil Polyaspartic Coatings Market Volume (liter ) Forecast, by Application 2019 & 2032
- Table 123: Argentina Polyaspartic Coatings Market Revenue (Million) Forecast, by Application 2019 & 2032
- Table 124: Argentina Polyaspartic Coatings Market Volume (liter ) Forecast, by Application 2019 & 2032
- Table 125: Rest of South America Polyaspartic Coatings Market Revenue (Million) Forecast, by Application 2019 & 2032
- Table 126: Rest of South America Polyaspartic Coatings Market Volume (liter ) Forecast, by Application 2019 & 2032
- Table 127: Global Polyaspartic Coatings Market Revenue Million Forecast, by Technology 2019 & 2032
- Table 128: Global Polyaspartic Coatings Market Volume liter Forecast, by Technology 2019 & 2032
- Table 129: Global Polyaspartic Coatings Market Revenue Million Forecast, by Type 2019 & 2032
- Table 130: Global Polyaspartic Coatings Market Volume liter Forecast, by Type 2019 & 2032
- Table 131: Global Polyaspartic Coatings Market Revenue Million Forecast, by End-user Industry 2019 & 2032
- Table 132: Global Polyaspartic Coatings Market Volume liter Forecast, by End-user Industry 2019 & 2032
- Table 133: Global Polyaspartic Coatings Market Revenue Million Forecast, by Country 2019 & 2032
- Table 134: Global Polyaspartic Coatings Market Volume liter Forecast, by Country 2019 & 2032
- Table 135: Global Polyaspartic Coatings Market Revenue Million Forecast, by Technology 2019 & 2032
- Table 136: Global Polyaspartic Coatings Market Volume liter Forecast, by Technology 2019 & 2032
- Table 137: Global Polyaspartic Coatings Market Revenue Million Forecast, by Type 2019 & 2032
- Table 138: Global Polyaspartic Coatings Market Volume liter Forecast, by Type 2019 & 2032
- Table 139: Global Polyaspartic Coatings Market Revenue Million Forecast, by End-user Industry 2019 & 2032
- Table 140: Global Polyaspartic Coatings Market Volume liter Forecast, by End-user Industry 2019 & 2032
- Table 141: Global Polyaspartic Coatings Market Revenue Million Forecast, by Country 2019 & 2032
- Table 142: Global Polyaspartic Coatings Market Volume liter Forecast, by Country 2019 & 2032
- Table 143: South Africa Polyaspartic Coatings Market Revenue (Million) Forecast, by Application 2019 & 2032
- Table 144: South Africa Polyaspartic Coatings Market Volume (liter ) Forecast, by Application 2019 & 2032
- Table 145: Rest of Middle East Polyaspartic Coatings Market Revenue (Million) Forecast, by Application 2019 & 2032
- Table 146: Rest of Middle East Polyaspartic Coatings Market Volume (liter ) Forecast, by Application 2019 & 2032
Frequently Asked Questions
1. What is the projected Compound Annual Growth Rate (CAGR) of the Polyaspartic Coatings Market?
The projected CAGR is approximately > 7.50%.
2. Which companies are prominent players in the Polyaspartic Coatings Market?
Key companies in the market include Chromaflo Technologies, The Sherwin-Williams Company*List Not Exhaustive, LATICRETE International Inc, Akzo Nobel NV, PPG Industries Inc, Enviro Epoxy Products Inc, BASF SE, Iron Man Coatings, Carboline Inc, Polyval Coatings Inc, Flexmar Polyaspartics, NEOGARD, Sika AG, Covestro AG, Duraamen Engineered Products Inc, RPM International, Florock.
3. What are the main segments of the Polyaspartic Coatings Market?
The market segments include Technology, Type, End-user Industry.
4. Can you provide details about the market size?
The market size is estimated to be USD 10400 Million as of 2022.
5. What are some drivers contributing to market growth?
; Rapidly Increasing Demand from the Building and Construction Industry; Other Drivers.
6. What are the notable trends driving market growth?
Marine Segment to Dominate the Market.
7. Are there any restraints impacting market growth?
; Stringent Environmental Regulations Regarding VOC Emissions.
8. Can you provide examples of recent developments in the market?
N/A
9. What pricing options are available for accessing the report?
Pricing options include single-user, multi-user, and enterprise licenses priced at USD 4750, USD 5250, and USD 8750 respectively.
10. Is the market size provided in terms of value or volume?
The market size is provided in terms of value, measured in Million and volume, measured in liter .
11. Are there any specific market keywords associated with the report?
Yes, the market keyword associated with the report is "Polyaspartic Coatings Market," which aids in identifying and referencing the specific market segment covered.
12. How do I determine which pricing option suits my needs best?
The pricing options vary based on user requirements and access needs. Individual users may opt for single-user licenses, while businesses requiring broader access may choose multi-user or enterprise licenses for cost-effective access to the report.
13. Are there any additional resources or data provided in the Polyaspartic Coatings Market report?
While the report offers comprehensive insights, it's advisable to review the specific contents or supplementary materials provided to ascertain if additional resources or data are available.
14. How can I stay updated on further developments or reports in the Polyaspartic Coatings Market?
To stay informed about further developments, trends, and reports in the Polyaspartic Coatings Market, consider subscribing to industry newsletters, following relevant companies and organizations, or regularly checking reputable industry news sources and publications.
Methodology
Step 1 - Identification of Relevant Samples Size from Population Database


Step 2 - Approaches for Defining Global Market Size (Value, Volume* & Price*)

Note*: In applicable scenarios
Step 3 - Data Sources
Primary Research
- Web Analytics
- Survey Reports
- Research Institute
- Latest Research Reports
- Opinion Leaders
Secondary Research
- Annual Reports
- White Paper
- Latest Press Release
- Industry Association
- Paid Database
- Investor Presentations

Step 4 - Data Triangulation
Involves using different sources of information in order to increase the validity of a study
These sources are likely to be stakeholders in a program - participants, other researchers, program staff, other community members, and so on.
Then we put all data in single framework & apply various statistical tools to find out the dynamic on the market.
During the analysis stage, feedback from the stakeholder groups would be compared to determine areas of agreement as well as areas of divergence


