
Key Insights
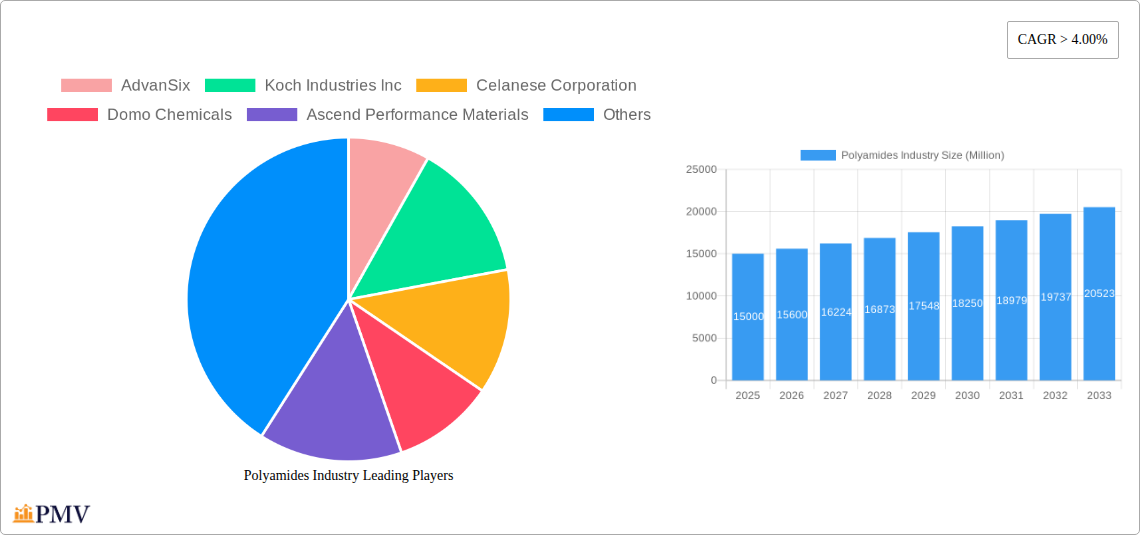
The global polyamides market, valued at approximately $15 billion in 2025, is projected to experience robust growth, exhibiting a Compound Annual Growth Rate (CAGR) exceeding 4% from 2025 to 2033. This expansion is driven by several key factors. The automotive industry's increasing demand for lightweight and high-performance materials, coupled with the burgeoning construction sector's need for durable and versatile polymers, fuels significant polyamide consumption. Furthermore, advancements in engineering plastics are leading to innovative applications in electronics and packaging, expanding the market's reach. The growing preference for sustainable materials is also influencing market dynamics, with manufacturers focusing on bio-based and recycled polyamide options. While rising raw material prices and potential supply chain disruptions pose challenges, the overall market outlook remains positive, driven by the enduring need for high-performance polymers across diverse sectors.
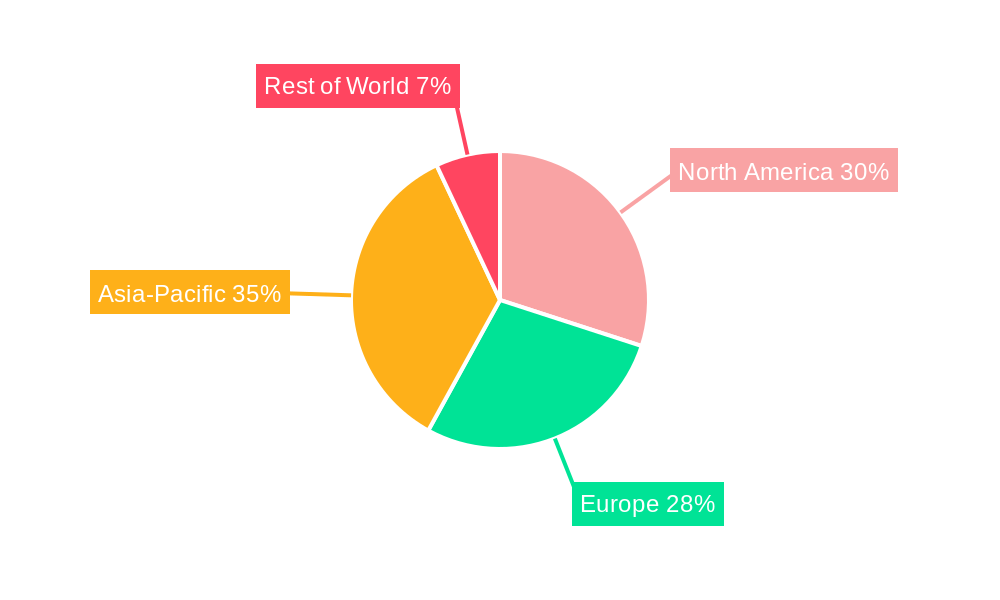
Segment-wise, the automotive and electronics industries are major consumers, followed by building and construction. Within resin types, polyamide 6 and polyamide 66 hold significant market share due to their versatile properties and established applications. However, the increasing adoption of specialty polyamides, such as aramid fibers for high-strength applications, is fostering segment growth. Geographically, North America and Europe currently dominate the market, but regions like Asia-Pacific are witnessing rapid expansion fueled by increasing industrialization and infrastructure development. Competitive landscape analysis reveals the presence of established global players like BASF, DuPont, and Celanese, alongside several regional manufacturers. The market's future depends on innovation in material science, sustainable sourcing practices, and strategic partnerships to cater to the evolving needs of diverse end-use industries.
Polyamides Industry Market Report: 2019-2033
This comprehensive report provides a detailed analysis of the global polyamides industry, offering invaluable insights for stakeholders across the value chain. With a study period spanning 2019-2033, a base year of 2025, and a forecast period of 2025-2033, this report leverages extensive data analysis to project market trends and growth opportunities. The report covers key segments including Aramid, Polyamide (PA), and Polyphthalamide, across diverse end-user industries such as aerospace, automotive, building and construction, electrical and electronics, industrial and machinery, and packaging. Leading players like AdvanSix, Koch Industries Inc, Celanese Corporation, Domo Chemicals, Ascend Performance Materials, LANXESS, Highsun Holding Group, BASF SE, LIBOLO, and Hangzhou Juheshun New Materials Co Ltd are profiled, providing a granular understanding of the competitive landscape.
Polyamides Industry Market Structure & Competitive Dynamics
The global polyamides market exhibits a moderately concentrated structure, with several major players holding significant market share. Competition is intense, driven by innovation in materials science, cost optimization strategies, and efforts to capture market share in high-growth segments. Market concentration is further influenced by regional variations in production capacity and consumer demand. Key metrics impacting market structure include:
- Market Share: While precise figures for individual company market share vary and are commercially sensitive, the top 10 companies are estimated to collectively hold approximately xx% of the global market in 2025.
- M&A Activity: The industry has witnessed significant M&A activity in recent years. For instance, Celanese Corporation's acquisition of DuPont's Mobility & Materials business in November 2022, valued at xx Million USD, demonstrates the strategic importance of expanding product portfolios and technological capabilities. Other significant deals have contributed to market consolidation.
- Regulatory Landscape: Government regulations related to environmental sustainability and product safety significantly influence the market. Stringent environmental regulations are driving the adoption of sustainable polyamide resins and increasing the focus on reducing carbon footprints.
Furthermore, the development of innovative product substitutes and shifting end-user preferences constantly reshape the competitive landscape. Advancements in bio-based polymers and other high-performance materials pose challenges to traditional polyamide applications. Companies are responding by investing in R&D to develop next-generation polyamides with enhanced properties, such as improved durability, lighter weight, and recyclability. These innovations contribute to ongoing shifts in market share and competitive dynamics. The current regulatory environment favors companies that proactively address environmental concerns and adopt sustainable manufacturing practices.
Polyamides Industry Industry Trends & Insights
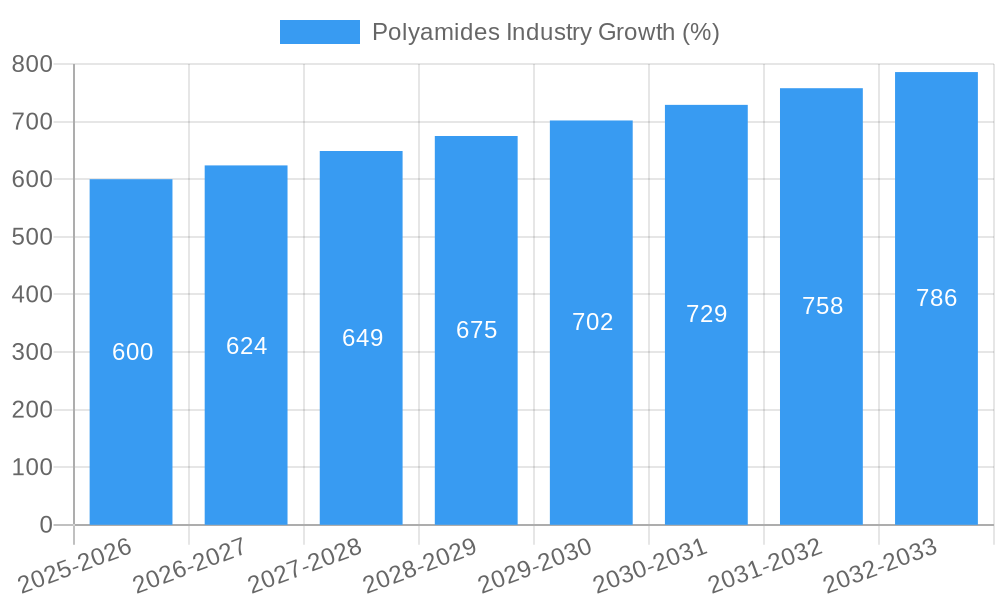
The global polyamides market is poised for robust growth, driven by several key factors. Increasing demand from diverse end-user sectors, coupled with advancements in materials science, contributes to a positive market outlook. The compound annual growth rate (CAGR) is projected to be xx% during the forecast period (2025-2033), reaching a market value of xx Million USD by 2033.
Technological disruptions, such as the development of high-performance polyamides with enhanced thermal and mechanical properties, are reshaping the industry. The rising adoption of sustainable and eco-friendly materials, particularly bio-based polyamides, is further fueling market growth. Consumer preferences are increasingly shifting towards products with superior performance, sustainability features, and cost-effectiveness. This trend necessitates continued innovation and investment in R&D to meet evolving customer demands. The intensifying competitive landscape, characterized by product differentiation strategies, mergers and acquisitions, and strategic partnerships, further influences market dynamics. Market penetration of sustainable polyamides, while still relatively low, is expected to rise significantly over the next decade, driven by growing environmental awareness and regulatory pressures.
Dominant Markets & Segments in Polyamides Industry
The automotive and electrical and electronics sectors are currently the dominant end-use segments for polyamides. Polyamide (PA) remains the most widely used resin type due to its versatility and cost-effectiveness. Geographically, Asia Pacific is the leading region, fueled by robust industrial growth and high demand from automotive and electronics manufacturers.
Key Drivers in Asia Pacific:
- Rapid industrialization and infrastructure development.
- Growing automotive and electronics manufacturing sectors.
- Favorable government policies supporting industrial growth.
Dominance Analysis: Asia Pacific's dominance is primarily attributable to the large manufacturing base and rapidly expanding consumer markets. The region's cost-competitive manufacturing environment makes it an attractive hub for polyamide production and consumption. Europe and North America are also significant markets, characterized by a focus on high-performance polyamides and stringent environmental regulations.
Other Segments: The building and construction sector presents a growing opportunity for polyamides, particularly in applications requiring high strength and durability. The aerospace industry utilizes specialized polyamides in high-performance components.
Polyamides Industry Product Innovations
Recent innovations in polyamides focus on enhancing material properties, sustainability, and processing efficiency. New grades with improved thermal stability, chemical resistance, and mechanical strength are being introduced. The development of sustainable polyamides, such as LANXESS's Durethan ECO, utilizing recycled materials, addresses growing environmental concerns and offers competitive advantages. These innovations are tailored to specific end-user applications, catering to the needs of various industries. The market fit of these new products hinges on balancing performance, cost-effectiveness, and sustainability.
Report Segmentation & Scope
This report segments the polyamides market across various end-user industries (Aerospace, Automotive, Building and Construction, Electrical and Electronics, Industrial and Machinery, Packaging, Other End-user Industries) and sub-resin types (Aramid, Polyamide (PA), Polyphthalamide). Each segment is analyzed individually, considering growth projections, market sizes, and competitive dynamics. The report provides detailed insights into the market size and growth potential of each segment, along with an in-depth analysis of the competitive landscape.
Key Drivers of Polyamides Industry Growth
Several factors contribute to the growth of the polyamides industry: rising demand from the automotive and electronics industries for lightweight and high-performance materials; growing adoption of polyamides in the building and construction sector due to their durability and strength; and the increasing development of sustainable polyamides that meet environmental regulations. Further growth is driven by technological advancements, leading to improved material properties and processing techniques.
Challenges in the Polyamides Industry Sector
Challenges include fluctuations in raw material prices, stringent environmental regulations, and intense competition from alternative materials. Supply chain disruptions can significantly impact production and cost. Meeting increasingly stringent regulatory requirements regarding sustainability and product safety poses a challenge. Competitive pressure from substitute materials necessitates continuous innovation and cost optimization to maintain market share.
Leading Players in the Polyamides Industry Market
- AdvanSix
- Koch Industries Inc
- Celanese Corporation
- Domo Chemicals
- Ascend Performance Materials
- LANXESS
- Highsun Holding Group
- BASF SE
- LIBOLO
- Hangzhou Juheshun New Materials Co Ltd
Key Developments in Polyamides Industry Sector
- July 2022: BASF SE announced plans to expand its ultramid polyamide grade production capacity in India. This expansion aims to cater to the growing demand from the automotive, electrical and electronics, and industrial sectors.
- September 2022: LANXESS introduced Durethan ECO, a sustainable polyamide resin made from recycled fibers. This launch highlights the increasing focus on eco-friendly materials within the industry.
- November 2022: Celanese Corporation completed the acquisition of DuPont's Mobility & Materials business. This acquisition significantly strengthened Celanese's product portfolio and market position.
Strategic Polyamides Industry Market Outlook
The future of the polyamides market is promising, driven by ongoing technological advancements, increasing demand from diverse industries, and a growing focus on sustainable materials. Strategic opportunities exist for companies that can effectively leverage innovation, optimize supply chains, and cater to the evolving needs of their customers. The market is expected to witness significant growth over the coming years, presenting attractive opportunities for both established players and new entrants.
Polyamides Industry Segmentation
-
1. End User Industry
- 1.1. Aerospace
- 1.2. Automotive
- 1.3. Building and Construction
- 1.4. Electrical and Electronics
- 1.5. Industrial and Machinery
- 1.6. Packaging
- 1.7. Other End-user Industries
-
2. Sub Resin Type
- 2.1. Aramid
- 2.2. Polyamide (PA) 6
- 2.3. Polyamide (PA) 66
- 2.4. Polyphthalamide
Polyamides Industry Segmentation By Geography
-
1. North America
- 1.1. United States
- 1.2. Canada
- 1.3. Mexico
-
2. South America
- 2.1. Brazil
- 2.2. Argentina
- 2.3. Rest of South America
-
3. Europe
- 3.1. United Kingdom
- 3.2. Germany
- 3.3. France
- 3.4. Italy
- 3.5. Spain
- 3.6. Russia
- 3.7. Benelux
- 3.8. Nordics
- 3.9. Rest of Europe
-
4. Middle East & Africa
- 4.1. Turkey
- 4.2. Israel
- 4.3. GCC
- 4.4. North Africa
- 4.5. South Africa
- 4.6. Rest of Middle East & Africa
-
5. Asia Pacific
- 5.1. China
- 5.2. India
- 5.3. Japan
- 5.4. South Korea
- 5.5. ASEAN
- 5.6. Oceania
- 5.7. Rest of Asia Pacific
Polyamides Industry REPORT HIGHLIGHTS
| Aspects | Details |
|---|---|
| Study Period | 2019-2033 |
| Base Year | 2024 |
| Estimated Year | 2025 |
| Forecast Period | 2025-2033 |
| Historical Period | 2019-2024 |
| Growth Rate | CAGR of > 4.00% from 2019-2033 |
| Segmentation |
|
Table of Contents
- 1. Introduction
- 1.1. Research Scope
- 1.2. Market Segmentation
- 1.3. Research Methodology
- 1.4. Definitions and Assumptions
- 2. Executive Summary
- 2.1. Introduction
- 3. Market Dynamics
- 3.1. Introduction
- 3.2. Market Drivers
- 3.2.1. Rapidly Growing Demand from the Poultry Industry; Increased Intake of Human Nutritional Supplements; Other Drivers
- 3.3. Market Restrains
- 3.3.1. Outbreak of Animal Diseases; Other Restraints
- 3.4. Market Trends
- 3.4.1. shift toward innovation and sustainability
- 4. Market Factor Analysis
- 4.1. Porters Five Forces
- 4.2. Supply/Value Chain
- 4.3. PESTEL analysis
- 4.4. Market Entropy
- 4.5. Patent/Trademark Analysis
- 5. Global Polyamides Industry Analysis, Insights and Forecast, 2019-2031
- 5.1. Market Analysis, Insights and Forecast - by End User Industry
- 5.1.1. Aerospace
- 5.1.2. Automotive
- 5.1.3. Building and Construction
- 5.1.4. Electrical and Electronics
- 5.1.5. Industrial and Machinery
- 5.1.6. Packaging
- 5.1.7. Other End-user Industries
- 5.2. Market Analysis, Insights and Forecast - by Sub Resin Type
- 5.2.1. Aramid
- 5.2.2. Polyamide (PA) 6
- 5.2.3. Polyamide (PA) 66
- 5.2.4. Polyphthalamide
- 5.3. Market Analysis, Insights and Forecast - by Region
- 5.3.1. North America
- 5.3.2. South America
- 5.3.3. Europe
- 5.3.4. Middle East & Africa
- 5.3.5. Asia Pacific
- 5.1. Market Analysis, Insights and Forecast - by End User Industry
- 6. North America Polyamides Industry Analysis, Insights and Forecast, 2019-2031
- 6.1. Market Analysis, Insights and Forecast - by End User Industry
- 6.1.1. Aerospace
- 6.1.2. Automotive
- 6.1.3. Building and Construction
- 6.1.4. Electrical and Electronics
- 6.1.5. Industrial and Machinery
- 6.1.6. Packaging
- 6.1.7. Other End-user Industries
- 6.2. Market Analysis, Insights and Forecast - by Sub Resin Type
- 6.2.1. Aramid
- 6.2.2. Polyamide (PA) 6
- 6.2.3. Polyamide (PA) 66
- 6.2.4. Polyphthalamide
- 6.1. Market Analysis, Insights and Forecast - by End User Industry
- 7. South America Polyamides Industry Analysis, Insights and Forecast, 2019-2031
- 7.1. Market Analysis, Insights and Forecast - by End User Industry
- 7.1.1. Aerospace
- 7.1.2. Automotive
- 7.1.3. Building and Construction
- 7.1.4. Electrical and Electronics
- 7.1.5. Industrial and Machinery
- 7.1.6. Packaging
- 7.1.7. Other End-user Industries
- 7.2. Market Analysis, Insights and Forecast - by Sub Resin Type
- 7.2.1. Aramid
- 7.2.2. Polyamide (PA) 6
- 7.2.3. Polyamide (PA) 66
- 7.2.4. Polyphthalamide
- 7.1. Market Analysis, Insights and Forecast - by End User Industry
- 8. Europe Polyamides Industry Analysis, Insights and Forecast, 2019-2031
- 8.1. Market Analysis, Insights and Forecast - by End User Industry
- 8.1.1. Aerospace
- 8.1.2. Automotive
- 8.1.3. Building and Construction
- 8.1.4. Electrical and Electronics
- 8.1.5. Industrial and Machinery
- 8.1.6. Packaging
- 8.1.7. Other End-user Industries
- 8.2. Market Analysis, Insights and Forecast - by Sub Resin Type
- 8.2.1. Aramid
- 8.2.2. Polyamide (PA) 6
- 8.2.3. Polyamide (PA) 66
- 8.2.4. Polyphthalamide
- 8.1. Market Analysis, Insights and Forecast - by End User Industry
- 9. Middle East & Africa Polyamides Industry Analysis, Insights and Forecast, 2019-2031
- 9.1. Market Analysis, Insights and Forecast - by End User Industry
- 9.1.1. Aerospace
- 9.1.2. Automotive
- 9.1.3. Building and Construction
- 9.1.4. Electrical and Electronics
- 9.1.5. Industrial and Machinery
- 9.1.6. Packaging
- 9.1.7. Other End-user Industries
- 9.2. Market Analysis, Insights and Forecast - by Sub Resin Type
- 9.2.1. Aramid
- 9.2.2. Polyamide (PA) 6
- 9.2.3. Polyamide (PA) 66
- 9.2.4. Polyphthalamide
- 9.1. Market Analysis, Insights and Forecast - by End User Industry
- 10. Asia Pacific Polyamides Industry Analysis, Insights and Forecast, 2019-2031
- 10.1. Market Analysis, Insights and Forecast - by End User Industry
- 10.1.1. Aerospace
- 10.1.2. Automotive
- 10.1.3. Building and Construction
- 10.1.4. Electrical and Electronics
- 10.1.5. Industrial and Machinery
- 10.1.6. Packaging
- 10.1.7. Other End-user Industries
- 10.2. Market Analysis, Insights and Forecast - by Sub Resin Type
- 10.2.1. Aramid
- 10.2.2. Polyamide (PA) 6
- 10.2.3. Polyamide (PA) 66
- 10.2.4. Polyphthalamide
- 10.1. Market Analysis, Insights and Forecast - by End User Industry
- 11. Competitive Analysis
- 11.1. Global Market Share Analysis 2024
- 11.2. Company Profiles
- 11.2.1 AdvanSix
- 11.2.1.1. Overview
- 11.2.1.2. Products
- 11.2.1.3. SWOT Analysis
- 11.2.1.4. Recent Developments
- 11.2.1.5. Financials (Based on Availability)
- 11.2.2 Koch Industries Inc
- 11.2.2.1. Overview
- 11.2.2.2. Products
- 11.2.2.3. SWOT Analysis
- 11.2.2.4. Recent Developments
- 11.2.2.5. Financials (Based on Availability)
- 11.2.3 Celanese Corporation
- 11.2.3.1. Overview
- 11.2.3.2. Products
- 11.2.3.3. SWOT Analysis
- 11.2.3.4. Recent Developments
- 11.2.3.5. Financials (Based on Availability)
- 11.2.4 Domo Chemicals
- 11.2.4.1. Overview
- 11.2.4.2. Products
- 11.2.4.3. SWOT Analysis
- 11.2.4.4. Recent Developments
- 11.2.4.5. Financials (Based on Availability)
- 11.2.5 Ascend Performance Materials
- 11.2.5.1. Overview
- 11.2.5.2. Products
- 11.2.5.3. SWOT Analysis
- 11.2.5.4. Recent Developments
- 11.2.5.5. Financials (Based on Availability)
- 11.2.6 LANXESS
- 11.2.6.1. Overview
- 11.2.6.2. Products
- 11.2.6.3. SWOT Analysis
- 11.2.6.4. Recent Developments
- 11.2.6.5. Financials (Based on Availability)
- 11.2.7 Highsun Holding Group
- 11.2.7.1. Overview
- 11.2.7.2. Products
- 11.2.7.3. SWOT Analysis
- 11.2.7.4. Recent Developments
- 11.2.7.5. Financials (Based on Availability)
- 11.2.8 BASF SE
- 11.2.8.1. Overview
- 11.2.8.2. Products
- 11.2.8.3. SWOT Analysis
- 11.2.8.4. Recent Developments
- 11.2.8.5. Financials (Based on Availability)
- 11.2.9 LIBOLO
- 11.2.9.1. Overview
- 11.2.9.2. Products
- 11.2.9.3. SWOT Analysis
- 11.2.9.4. Recent Developments
- 11.2.9.5. Financials (Based on Availability)
- 11.2.10 Hangzhou Juheshun New Materials Co Ltd
- 11.2.10.1. Overview
- 11.2.10.2. Products
- 11.2.10.3. SWOT Analysis
- 11.2.10.4. Recent Developments
- 11.2.10.5. Financials (Based on Availability)
- 11.2.1 AdvanSix
List of Figures
- Figure 1: Global Polyamides Industry Revenue Breakdown (Million, %) by Region 2024 & 2032
- Figure 2: Global Polyamides Industry Volume Breakdown (K Tons, %) by Region 2024 & 2032
- Figure 3: North America Polyamides Industry Revenue (Million), by End User Industry 2024 & 2032
- Figure 4: North America Polyamides Industry Volume (K Tons), by End User Industry 2024 & 2032
- Figure 5: North America Polyamides Industry Revenue Share (%), by End User Industry 2024 & 2032
- Figure 6: North America Polyamides Industry Volume Share (%), by End User Industry 2024 & 2032
- Figure 7: North America Polyamides Industry Revenue (Million), by Sub Resin Type 2024 & 2032
- Figure 8: North America Polyamides Industry Volume (K Tons), by Sub Resin Type 2024 & 2032
- Figure 9: North America Polyamides Industry Revenue Share (%), by Sub Resin Type 2024 & 2032
- Figure 10: North America Polyamides Industry Volume Share (%), by Sub Resin Type 2024 & 2032
- Figure 11: North America Polyamides Industry Revenue (Million), by Country 2024 & 2032
- Figure 12: North America Polyamides Industry Volume (K Tons), by Country 2024 & 2032
- Figure 13: North America Polyamides Industry Revenue Share (%), by Country 2024 & 2032
- Figure 14: North America Polyamides Industry Volume Share (%), by Country 2024 & 2032
- Figure 15: South America Polyamides Industry Revenue (Million), by End User Industry 2024 & 2032
- Figure 16: South America Polyamides Industry Volume (K Tons), by End User Industry 2024 & 2032
- Figure 17: South America Polyamides Industry Revenue Share (%), by End User Industry 2024 & 2032
- Figure 18: South America Polyamides Industry Volume Share (%), by End User Industry 2024 & 2032
- Figure 19: South America Polyamides Industry Revenue (Million), by Sub Resin Type 2024 & 2032
- Figure 20: South America Polyamides Industry Volume (K Tons), by Sub Resin Type 2024 & 2032
- Figure 21: South America Polyamides Industry Revenue Share (%), by Sub Resin Type 2024 & 2032
- Figure 22: South America Polyamides Industry Volume Share (%), by Sub Resin Type 2024 & 2032
- Figure 23: South America Polyamides Industry Revenue (Million), by Country 2024 & 2032
- Figure 24: South America Polyamides Industry Volume (K Tons), by Country 2024 & 2032
- Figure 25: South America Polyamides Industry Revenue Share (%), by Country 2024 & 2032
- Figure 26: South America Polyamides Industry Volume Share (%), by Country 2024 & 2032
- Figure 27: Europe Polyamides Industry Revenue (Million), by End User Industry 2024 & 2032
- Figure 28: Europe Polyamides Industry Volume (K Tons), by End User Industry 2024 & 2032
- Figure 29: Europe Polyamides Industry Revenue Share (%), by End User Industry 2024 & 2032
- Figure 30: Europe Polyamides Industry Volume Share (%), by End User Industry 2024 & 2032
- Figure 31: Europe Polyamides Industry Revenue (Million), by Sub Resin Type 2024 & 2032
- Figure 32: Europe Polyamides Industry Volume (K Tons), by Sub Resin Type 2024 & 2032
- Figure 33: Europe Polyamides Industry Revenue Share (%), by Sub Resin Type 2024 & 2032
- Figure 34: Europe Polyamides Industry Volume Share (%), by Sub Resin Type 2024 & 2032
- Figure 35: Europe Polyamides Industry Revenue (Million), by Country 2024 & 2032
- Figure 36: Europe Polyamides Industry Volume (K Tons), by Country 2024 & 2032
- Figure 37: Europe Polyamides Industry Revenue Share (%), by Country 2024 & 2032
- Figure 38: Europe Polyamides Industry Volume Share (%), by Country 2024 & 2032
- Figure 39: Middle East & Africa Polyamides Industry Revenue (Million), by End User Industry 2024 & 2032
- Figure 40: Middle East & Africa Polyamides Industry Volume (K Tons), by End User Industry 2024 & 2032
- Figure 41: Middle East & Africa Polyamides Industry Revenue Share (%), by End User Industry 2024 & 2032
- Figure 42: Middle East & Africa Polyamides Industry Volume Share (%), by End User Industry 2024 & 2032
- Figure 43: Middle East & Africa Polyamides Industry Revenue (Million), by Sub Resin Type 2024 & 2032
- Figure 44: Middle East & Africa Polyamides Industry Volume (K Tons), by Sub Resin Type 2024 & 2032
- Figure 45: Middle East & Africa Polyamides Industry Revenue Share (%), by Sub Resin Type 2024 & 2032
- Figure 46: Middle East & Africa Polyamides Industry Volume Share (%), by Sub Resin Type 2024 & 2032
- Figure 47: Middle East & Africa Polyamides Industry Revenue (Million), by Country 2024 & 2032
- Figure 48: Middle East & Africa Polyamides Industry Volume (K Tons), by Country 2024 & 2032
- Figure 49: Middle East & Africa Polyamides Industry Revenue Share (%), by Country 2024 & 2032
- Figure 50: Middle East & Africa Polyamides Industry Volume Share (%), by Country 2024 & 2032
- Figure 51: Asia Pacific Polyamides Industry Revenue (Million), by End User Industry 2024 & 2032
- Figure 52: Asia Pacific Polyamides Industry Volume (K Tons), by End User Industry 2024 & 2032
- Figure 53: Asia Pacific Polyamides Industry Revenue Share (%), by End User Industry 2024 & 2032
- Figure 54: Asia Pacific Polyamides Industry Volume Share (%), by End User Industry 2024 & 2032
- Figure 55: Asia Pacific Polyamides Industry Revenue (Million), by Sub Resin Type 2024 & 2032
- Figure 56: Asia Pacific Polyamides Industry Volume (K Tons), by Sub Resin Type 2024 & 2032
- Figure 57: Asia Pacific Polyamides Industry Revenue Share (%), by Sub Resin Type 2024 & 2032
- Figure 58: Asia Pacific Polyamides Industry Volume Share (%), by Sub Resin Type 2024 & 2032
- Figure 59: Asia Pacific Polyamides Industry Revenue (Million), by Country 2024 & 2032
- Figure 60: Asia Pacific Polyamides Industry Volume (K Tons), by Country 2024 & 2032
- Figure 61: Asia Pacific Polyamides Industry Revenue Share (%), by Country 2024 & 2032
- Figure 62: Asia Pacific Polyamides Industry Volume Share (%), by Country 2024 & 2032
List of Tables
- Table 1: Global Polyamides Industry Revenue Million Forecast, by Region 2019 & 2032
- Table 2: Global Polyamides Industry Volume K Tons Forecast, by Region 2019 & 2032
- Table 3: Global Polyamides Industry Revenue Million Forecast, by End User Industry 2019 & 2032
- Table 4: Global Polyamides Industry Volume K Tons Forecast, by End User Industry 2019 & 2032
- Table 5: Global Polyamides Industry Revenue Million Forecast, by Sub Resin Type 2019 & 2032
- Table 6: Global Polyamides Industry Volume K Tons Forecast, by Sub Resin Type 2019 & 2032
- Table 7: Global Polyamides Industry Revenue Million Forecast, by Region 2019 & 2032
- Table 8: Global Polyamides Industry Volume K Tons Forecast, by Region 2019 & 2032
- Table 9: Global Polyamides Industry Revenue Million Forecast, by End User Industry 2019 & 2032
- Table 10: Global Polyamides Industry Volume K Tons Forecast, by End User Industry 2019 & 2032
- Table 11: Global Polyamides Industry Revenue Million Forecast, by Sub Resin Type 2019 & 2032
- Table 12: Global Polyamides Industry Volume K Tons Forecast, by Sub Resin Type 2019 & 2032
- Table 13: Global Polyamides Industry Revenue Million Forecast, by Country 2019 & 2032
- Table 14: Global Polyamides Industry Volume K Tons Forecast, by Country 2019 & 2032
- Table 15: United States Polyamides Industry Revenue (Million) Forecast, by Application 2019 & 2032
- Table 16: United States Polyamides Industry Volume (K Tons) Forecast, by Application 2019 & 2032
- Table 17: Canada Polyamides Industry Revenue (Million) Forecast, by Application 2019 & 2032
- Table 18: Canada Polyamides Industry Volume (K Tons) Forecast, by Application 2019 & 2032
- Table 19: Mexico Polyamides Industry Revenue (Million) Forecast, by Application 2019 & 2032
- Table 20: Mexico Polyamides Industry Volume (K Tons) Forecast, by Application 2019 & 2032
- Table 21: Global Polyamides Industry Revenue Million Forecast, by End User Industry 2019 & 2032
- Table 22: Global Polyamides Industry Volume K Tons Forecast, by End User Industry 2019 & 2032
- Table 23: Global Polyamides Industry Revenue Million Forecast, by Sub Resin Type 2019 & 2032
- Table 24: Global Polyamides Industry Volume K Tons Forecast, by Sub Resin Type 2019 & 2032
- Table 25: Global Polyamides Industry Revenue Million Forecast, by Country 2019 & 2032
- Table 26: Global Polyamides Industry Volume K Tons Forecast, by Country 2019 & 2032
- Table 27: Brazil Polyamides Industry Revenue (Million) Forecast, by Application 2019 & 2032
- Table 28: Brazil Polyamides Industry Volume (K Tons) Forecast, by Application 2019 & 2032
- Table 29: Argentina Polyamides Industry Revenue (Million) Forecast, by Application 2019 & 2032
- Table 30: Argentina Polyamides Industry Volume (K Tons) Forecast, by Application 2019 & 2032
- Table 31: Rest of South America Polyamides Industry Revenue (Million) Forecast, by Application 2019 & 2032
- Table 32: Rest of South America Polyamides Industry Volume (K Tons) Forecast, by Application 2019 & 2032
- Table 33: Global Polyamides Industry Revenue Million Forecast, by End User Industry 2019 & 2032
- Table 34: Global Polyamides Industry Volume K Tons Forecast, by End User Industry 2019 & 2032
- Table 35: Global Polyamides Industry Revenue Million Forecast, by Sub Resin Type 2019 & 2032
- Table 36: Global Polyamides Industry Volume K Tons Forecast, by Sub Resin Type 2019 & 2032
- Table 37: Global Polyamides Industry Revenue Million Forecast, by Country 2019 & 2032
- Table 38: Global Polyamides Industry Volume K Tons Forecast, by Country 2019 & 2032
- Table 39: United Kingdom Polyamides Industry Revenue (Million) Forecast, by Application 2019 & 2032
- Table 40: United Kingdom Polyamides Industry Volume (K Tons) Forecast, by Application 2019 & 2032
- Table 41: Germany Polyamides Industry Revenue (Million) Forecast, by Application 2019 & 2032
- Table 42: Germany Polyamides Industry Volume (K Tons) Forecast, by Application 2019 & 2032
- Table 43: France Polyamides Industry Revenue (Million) Forecast, by Application 2019 & 2032
- Table 44: France Polyamides Industry Volume (K Tons) Forecast, by Application 2019 & 2032
- Table 45: Italy Polyamides Industry Revenue (Million) Forecast, by Application 2019 & 2032
- Table 46: Italy Polyamides Industry Volume (K Tons) Forecast, by Application 2019 & 2032
- Table 47: Spain Polyamides Industry Revenue (Million) Forecast, by Application 2019 & 2032
- Table 48: Spain Polyamides Industry Volume (K Tons) Forecast, by Application 2019 & 2032
- Table 49: Russia Polyamides Industry Revenue (Million) Forecast, by Application 2019 & 2032
- Table 50: Russia Polyamides Industry Volume (K Tons) Forecast, by Application 2019 & 2032
- Table 51: Benelux Polyamides Industry Revenue (Million) Forecast, by Application 2019 & 2032
- Table 52: Benelux Polyamides Industry Volume (K Tons) Forecast, by Application 2019 & 2032
- Table 53: Nordics Polyamides Industry Revenue (Million) Forecast, by Application 2019 & 2032
- Table 54: Nordics Polyamides Industry Volume (K Tons) Forecast, by Application 2019 & 2032
- Table 55: Rest of Europe Polyamides Industry Revenue (Million) Forecast, by Application 2019 & 2032
- Table 56: Rest of Europe Polyamides Industry Volume (K Tons) Forecast, by Application 2019 & 2032
- Table 57: Global Polyamides Industry Revenue Million Forecast, by End User Industry 2019 & 2032
- Table 58: Global Polyamides Industry Volume K Tons Forecast, by End User Industry 2019 & 2032
- Table 59: Global Polyamides Industry Revenue Million Forecast, by Sub Resin Type 2019 & 2032
- Table 60: Global Polyamides Industry Volume K Tons Forecast, by Sub Resin Type 2019 & 2032
- Table 61: Global Polyamides Industry Revenue Million Forecast, by Country 2019 & 2032
- Table 62: Global Polyamides Industry Volume K Tons Forecast, by Country 2019 & 2032
- Table 63: Turkey Polyamides Industry Revenue (Million) Forecast, by Application 2019 & 2032
- Table 64: Turkey Polyamides Industry Volume (K Tons) Forecast, by Application 2019 & 2032
- Table 65: Israel Polyamides Industry Revenue (Million) Forecast, by Application 2019 & 2032
- Table 66: Israel Polyamides Industry Volume (K Tons) Forecast, by Application 2019 & 2032
- Table 67: GCC Polyamides Industry Revenue (Million) Forecast, by Application 2019 & 2032
- Table 68: GCC Polyamides Industry Volume (K Tons) Forecast, by Application 2019 & 2032
- Table 69: North Africa Polyamides Industry Revenue (Million) Forecast, by Application 2019 & 2032
- Table 70: North Africa Polyamides Industry Volume (K Tons) Forecast, by Application 2019 & 2032
- Table 71: South Africa Polyamides Industry Revenue (Million) Forecast, by Application 2019 & 2032
- Table 72: South Africa Polyamides Industry Volume (K Tons) Forecast, by Application 2019 & 2032
- Table 73: Rest of Middle East & Africa Polyamides Industry Revenue (Million) Forecast, by Application 2019 & 2032
- Table 74: Rest of Middle East & Africa Polyamides Industry Volume (K Tons) Forecast, by Application 2019 & 2032
- Table 75: Global Polyamides Industry Revenue Million Forecast, by End User Industry 2019 & 2032
- Table 76: Global Polyamides Industry Volume K Tons Forecast, by End User Industry 2019 & 2032
- Table 77: Global Polyamides Industry Revenue Million Forecast, by Sub Resin Type 2019 & 2032
- Table 78: Global Polyamides Industry Volume K Tons Forecast, by Sub Resin Type 2019 & 2032
- Table 79: Global Polyamides Industry Revenue Million Forecast, by Country 2019 & 2032
- Table 80: Global Polyamides Industry Volume K Tons Forecast, by Country 2019 & 2032
- Table 81: China Polyamides Industry Revenue (Million) Forecast, by Application 2019 & 2032
- Table 82: China Polyamides Industry Volume (K Tons) Forecast, by Application 2019 & 2032
- Table 83: India Polyamides Industry Revenue (Million) Forecast, by Application 2019 & 2032
- Table 84: India Polyamides Industry Volume (K Tons) Forecast, by Application 2019 & 2032
- Table 85: Japan Polyamides Industry Revenue (Million) Forecast, by Application 2019 & 2032
- Table 86: Japan Polyamides Industry Volume (K Tons) Forecast, by Application 2019 & 2032
- Table 87: South Korea Polyamides Industry Revenue (Million) Forecast, by Application 2019 & 2032
- Table 88: South Korea Polyamides Industry Volume (K Tons) Forecast, by Application 2019 & 2032
- Table 89: ASEAN Polyamides Industry Revenue (Million) Forecast, by Application 2019 & 2032
- Table 90: ASEAN Polyamides Industry Volume (K Tons) Forecast, by Application 2019 & 2032
- Table 91: Oceania Polyamides Industry Revenue (Million) Forecast, by Application 2019 & 2032
- Table 92: Oceania Polyamides Industry Volume (K Tons) Forecast, by Application 2019 & 2032
- Table 93: Rest of Asia Pacific Polyamides Industry Revenue (Million) Forecast, by Application 2019 & 2032
- Table 94: Rest of Asia Pacific Polyamides Industry Volume (K Tons) Forecast, by Application 2019 & 2032
Frequently Asked Questions
1. What is the projected Compound Annual Growth Rate (CAGR) of the Polyamides Industry?
The projected CAGR is approximately > 4.00%.
2. Which companies are prominent players in the Polyamides Industry?
Key companies in the market include AdvanSix, Koch Industries Inc, Celanese Corporation, Domo Chemicals, Ascend Performance Materials, LANXESS, Highsun Holding Group, BASF SE, LIBOLO, Hangzhou Juheshun New Materials Co Ltd.
3. What are the main segments of the Polyamides Industry?
The market segments include End User Industry, Sub Resin Type.
4. Can you provide details about the market size?
The market size is estimated to be USD XX Million as of 2022.
5. What are some drivers contributing to market growth?
Rapidly Growing Demand from the Poultry Industry; Increased Intake of Human Nutritional Supplements; Other Drivers.
6. What are the notable trends driving market growth?
shift toward innovation and sustainability.
7. Are there any restraints impacting market growth?
Outbreak of Animal Diseases; Other Restraints.
8. Can you provide examples of recent developments in the market?
November 2022: Celanese Corporation completed the acquisition of the Mobility & Materials (“M&M”) business of DuPont. This acquisition enhanced the company's product portfolio of engineered thermoplastics through the addition of well-recognized brands and intellectual properties of DuPont.September 2022: LANXESS introduced a sustainable polyamide resin, Durethan ECO, which consists of recycled fibers made from waste glass to reduce its carbon footprint.July 2022: BASF SE announced plans to expand its ultramid polyamide grade production capacity in India to meet the growing demand from automotive, electrical and electronics, industrial, and consumer goods applications.
9. What pricing options are available for accessing the report?
Pricing options include single-user, multi-user, and enterprise licenses priced at USD 3800, USD 4500, and USD 5800 respectively.
10. Is the market size provided in terms of value or volume?
The market size is provided in terms of value, measured in Million and volume, measured in K Tons.
11. Are there any specific market keywords associated with the report?
Yes, the market keyword associated with the report is "Polyamides Industry," which aids in identifying and referencing the specific market segment covered.
12. How do I determine which pricing option suits my needs best?
The pricing options vary based on user requirements and access needs. Individual users may opt for single-user licenses, while businesses requiring broader access may choose multi-user or enterprise licenses for cost-effective access to the report.
13. Are there any additional resources or data provided in the Polyamides Industry report?
While the report offers comprehensive insights, it's advisable to review the specific contents or supplementary materials provided to ascertain if additional resources or data are available.
14. How can I stay updated on further developments or reports in the Polyamides Industry?
To stay informed about further developments, trends, and reports in the Polyamides Industry, consider subscribing to industry newsletters, following relevant companies and organizations, or regularly checking reputable industry news sources and publications.
Methodology
Step 1 - Identification of Relevant Samples Size from Population Database


Step 2 - Approaches for Defining Global Market Size (Value, Volume* & Price*)

Note*: In applicable scenarios
Step 3 - Data Sources
Primary Research
- Web Analytics
- Survey Reports
- Research Institute
- Latest Research Reports
- Opinion Leaders
Secondary Research
- Annual Reports
- White Paper
- Latest Press Release
- Industry Association
- Paid Database
- Investor Presentations

Step 4 - Data Triangulation
Involves using different sources of information in order to increase the validity of a study
These sources are likely to be stakeholders in a program - participants, other researchers, program staff, other community members, and so on.
Then we put all data in single framework & apply various statistical tools to find out the dynamic on the market.
During the analysis stage, feedback from the stakeholder groups would be compared to determine areas of agreement as well as areas of divergence


