
Key Insights
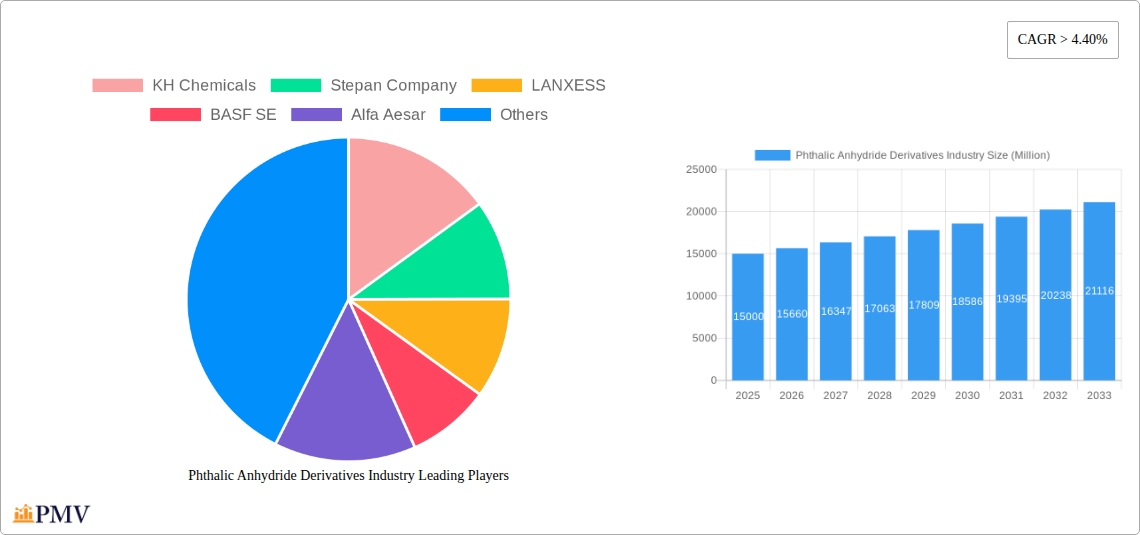
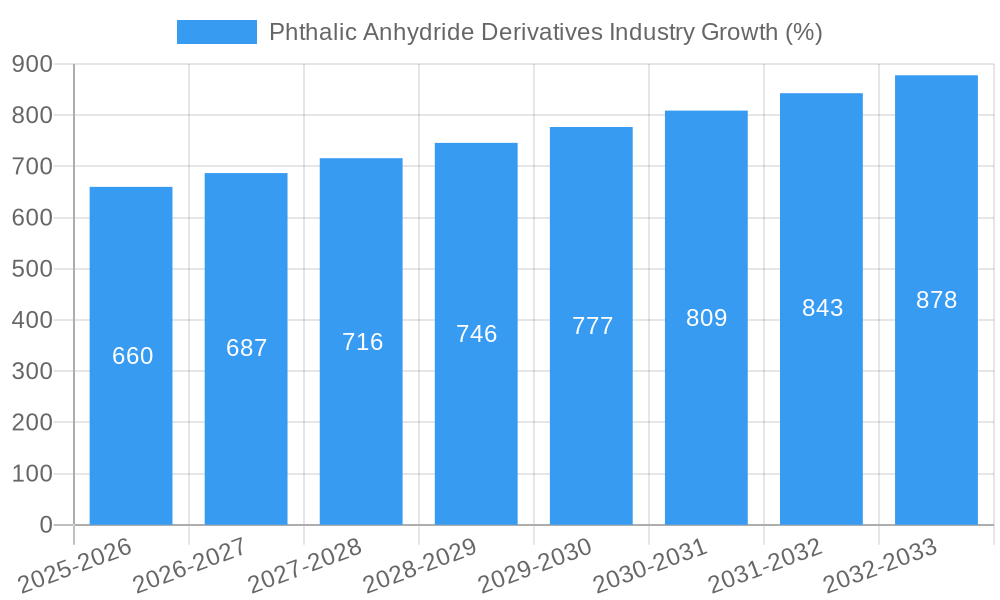
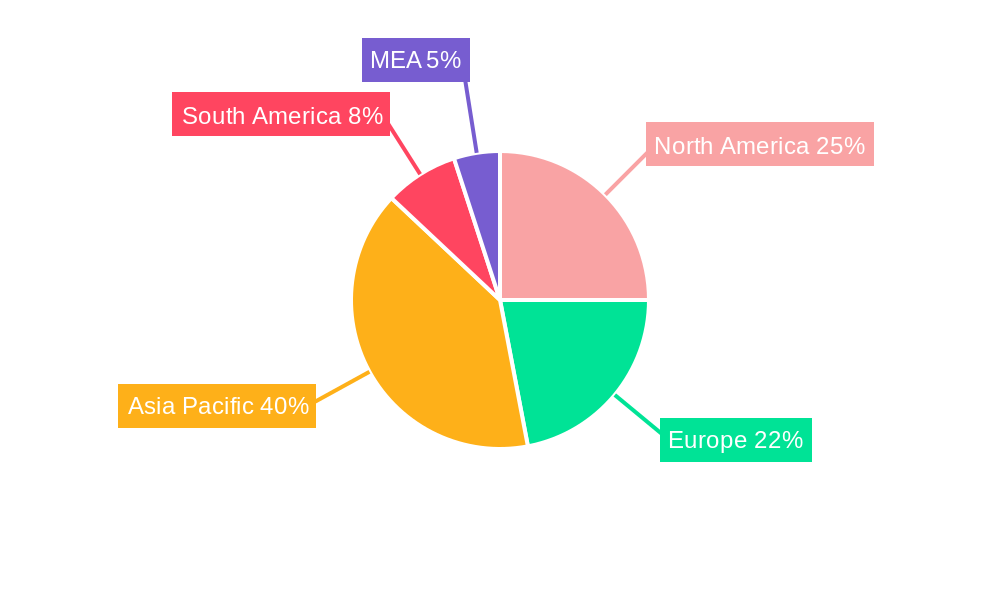
The phthalic anhydride derivatives market is experiencing robust growth, driven by the increasing demand for its diverse applications across various end-use industries. The market's Compound Annual Growth Rate (CAGR) exceeding 4.40% indicates a significant expansion trajectory through 2033. Key drivers include the burgeoning construction sector, particularly in developing economies, fueled by infrastructure development and urbanization. The automotive industry's reliance on phthalic anhydride derivatives for coatings, plastics, and other components further propels market growth. The electrical and electronics sector, with its continuous innovation and demand for high-performance materials, contributes substantially to market expansion. Growth is also supported by advancements in aerospace materials and increasing use in specialty applications. However, market growth faces some headwinds, including fluctuations in raw material prices and concerns regarding the environmental impact of certain phthalic anhydride derivatives. Market segmentation reveals that unsaturated polyester resins hold a significant share, followed by alkyd resins and plasticizers. Geographically, Asia-Pacific, driven by strong economic growth and manufacturing activity in countries like China and India, is expected to dominate the market, followed by North America and Europe. Competitive intensity is high, with major players such as BASF SE, LANXESS, and Stepan Company leading the market through innovation, strategic partnerships, and expansion into new geographical regions. The forecast period will likely witness increased focus on sustainable and eco-friendly alternatives, as well as the development of high-performance derivatives tailored to specific end-use needs.
The competitive landscape is characterized by a mix of large multinational corporations and regional players. Strategic collaborations, mergers and acquisitions, and continuous research and development efforts are key strategies employed by companies to gain a competitive edge. Future market growth will be influenced by factors such as governmental regulations on the use of certain chemicals, technological advancements leading to the development of novel derivatives, and the overall economic outlook. Despite challenges, the inherent versatility and performance characteristics of phthalic anhydride derivatives position them favorably for continued market expansion. Specific growth rates for individual segments and regions will be influenced by factors including regulatory changes, the pace of economic growth and technological advancements within each geographic region and market segment. Pricing strategies, and the overall global economic environment will also play significant roles in determining the precise market trajectory during the forecast period.
Phthalic Anhydride Derivatives Industry: A Comprehensive Market Report (2019-2033)
This in-depth report provides a comprehensive analysis of the global Phthalic Anhydride Derivatives industry, offering invaluable insights for stakeholders seeking to navigate this dynamic market. The study covers the period from 2019 to 2033, with a base year of 2025 and a forecast period from 2025 to 2033. We delve into market structure, competitive dynamics, leading players, key trends, and future growth projections, empowering businesses to make informed strategic decisions. The report utilizes rigorous data analysis and expert insights to present a clear and actionable roadmap for success in this vital sector. The global market size for Phthalic Anhydride Derivatives was valued at xx Million in 2024 and is projected to reach xx Million by 2033, exhibiting a CAGR of xx% during the forecast period.
Phthalic Anhydride Derivatives Industry Market Structure & Competitive Dynamics
The Phthalic Anhydride Derivatives market is characterized by a moderately concentrated structure, with a few major players holding significant market share. The industry exhibits a complex innovation ecosystem, driven by continuous R&D efforts to improve product performance, sustainability, and cost-effectiveness. Stringent regulatory frameworks concerning environmental impact and product safety influence market dynamics. The presence of substitute materials, such as bio-based alternatives, adds competitive pressure. End-user trends towards lightweighting in automotive and construction sectors create both challenges and opportunities for industry players. M&A activity has been moderate, with deal values fluctuating based on market conditions. For example, the acquisition of X company by Y company in 2022 for xx Million demonstrated the strategic importance of consolidating market share.
- Market Concentration: The top five players hold approximately xx% of the global market share.
- Innovation Ecosystem: Focus on developing sustainable and high-performance derivatives.
- Regulatory Framework: Compliance with REACH regulations and other environmental standards is crucial.
- Product Substitutes: Bio-based alternatives are emerging as competitive threats.
- M&A Activity: Consolidation is expected to continue, with larger players acquiring smaller companies to expand their product portfolios and geographical reach.
Phthalic Anhydride Derivatives Industry Industry Trends & Insights
The Phthalic Anhydride Derivatives market is experiencing robust growth, driven by the increasing demand from diverse end-use industries. Technological advancements, including the development of novel production processes and improved formulations, are enhancing the performance and application of these derivatives. Consumer preferences are shifting towards sustainable and eco-friendly materials, influencing the development of bio-based alternatives. Competitive dynamics are characterized by intense rivalry among established players and emerging entrants. The market is witnessing increased investment in R&D and strategic partnerships to gain a competitive edge. The construction industry's robust growth, particularly in developing economies, is a significant driver, along with the rising demand for high-performance materials in the automotive and electronics sectors. The global market is anticipated to witness a CAGR of xx% from 2025 to 2033, driven by expanding downstream applications and technological advancements. Market penetration of phthalate-free alternatives remains relatively low, presenting both a challenge and an opportunity for innovation.
Dominant Markets & Segments in Phthalic Anhydride Derivatives Industry
The unsaturated polyester resins segment dominates the derivatives market, driven by its extensive use in construction and automotive applications. Geographically, Asia-Pacific is the leading region, fueled by robust infrastructure development and industrialization.
Dominant Derivative Segment: Unsaturated Polyester Resins (xx% market share in 2024). Key drivers include the growth of construction and automotive industries.
Dominant End-Use Industry: Construction (xx% market share in 2024). Key drivers include infrastructure development and rising urbanization in developing economies.
Dominant Geographic Region: Asia-Pacific (xx% market share in 2024). Key drivers include rapid industrialization, economic growth, and significant construction activities.
Alkyd Resin: Significant demand from the coatings industry.
Plasticizer: Growth driven by the expanding plastics and packaging industries.
Other Derivatives: Niche applications in various sectors.
Automotive: High demand for lightweight and durable materials.
Electrical and Electronics: Use in insulation and other specialized applications.
Aerospace: Demand for high-performance materials with specific properties.
Others: Various niche applications across diverse industries.
Phthalic Anhydride Derivatives Industry Product Innovations
Recent product innovations focus on developing derivatives with improved properties, such as enhanced thermal stability, flame retardancy, and biodegradability. This includes the introduction of phthalate-free plasticizers and more sustainable unsaturated polyester resins. These developments cater to growing environmental concerns and stringent regulations while also meeting the evolving demands of various end-use industries. The market is also witnessing the emergence of specialized derivatives with tailored properties for niche applications.
Report Segmentation & Scope
This report segments the Phthalic Anhydride Derivatives market based on derivative type (Unsaturated Polyester Resins, Alkyd Resin, Plasticizer, Other) and end-use industry (Construction, Automotive, Electrical and Electronics, Aerospace, Others). Each segment's growth projections, market size, and competitive dynamics are thoroughly analyzed. The report also provides regional breakdowns, offering detailed insights into market trends and opportunities across different geographical areas.
Key Drivers of Phthalic Anhydride Derivatives Industry Growth
The growth of the Phthalic Anhydride Derivatives market is primarily driven by the expanding construction and automotive industries, coupled with the rising demand for high-performance materials in diverse sectors. Technological advancements, leading to improved product properties and cost-effectiveness, further fuel market growth. Favorable government policies supporting infrastructure development in various regions also contribute significantly.
Challenges in the Phthalic Anhydride Derivatives Industry Sector
The industry faces challenges from fluctuating raw material prices, stringent environmental regulations, and the emergence of bio-based alternatives. Supply chain disruptions and intense competition among established and new players also pose significant hurdles to industry growth. The increasing cost of raw materials is a notable factor influencing production costs and pricing strategies.
Leading Players in the Phthalic Anhydride Derivatives Industry Market
- KH Chemicals
- Stepan Company
- LANXESS
- BASF SE
- Alfa Aesar
- PENPET Petrochemical Trading GmbH
- JFE Chemical Corporation
- I G Petrochemicals Ltd
- Polynt SpA
- Thirumalai Chemicals Ltd
- Tokyo Chemical Industry
- S I Group Inc
- Koppers Inc
- Perstorp
- The Chemical Company
Key Developments in Phthalic Anhydride Derivatives Industry Sector
- 2022 Q4: BASF SE announced a significant investment in expanding its phthalic anhydride production capacity.
- 2023 Q1: Stepan Company launched a new line of bio-based plasticizers.
- 2023 Q2: A major merger between two smaller players reshaped the competitive landscape. (Further details to be added based on available data)
Strategic Phthalic Anhydride Derivatives Industry Market Outlook
The Phthalic Anhydride Derivatives market is poised for sustained growth, driven by ongoing technological advancements and increasing demand from key end-use sectors. Strategic opportunities exist for companies to capitalize on the growing preference for sustainable and high-performance derivatives, particularly in emerging markets. Investments in R&D and strategic partnerships will play a pivotal role in achieving long-term success within this evolving market landscape.
Phthalic Anhydride Derivatives Industry Segmentation
-
1. Derivatives
- 1.1. Unsaturated Polyester Resins
- 1.2. Alkyd Resin
- 1.3. Plasticizer
- 1.4. Other
-
2. End-user Industry
- 2.1. Construction
- 2.2. Automotive
- 2.3. Electrical and Electronics
- 2.4. Aerospace
- 2.5. Others
Phthalic Anhydride Derivatives Industry Segmentation By Geography
-
1. Asia Pacific
- 1.1. China
- 1.2. India
- 1.3. Japan
- 1.4. South Korea
- 1.5. Rest of Asia Pacific
-
2. North America
- 2.1. United States
- 2.2. Canada
- 2.3. Mexico
-
3. Europe
- 3.1. Germany
- 3.2. United Kingdom
- 3.3. France
- 3.4. Italy
- 3.5. Rest of Europe
-
4. South America
- 4.1. Brazil
- 4.2. Argentina
- 4.3. Rest of South America
-
5. Middle East and Africa
- 5.1. Saudi Arabia
- 5.2. South Africa
- 5.3. Rest of Middle East and Africa
Phthalic Anhydride Derivatives Industry REPORT HIGHLIGHTS
| Aspects | Details |
|---|---|
| Study Period | 2019-2033 |
| Base Year | 2024 |
| Estimated Year | 2025 |
| Forecast Period | 2025-2033 |
| Historical Period | 2019-2024 |
| Growth Rate | CAGR of > 4.40% from 2019-2033 |
| Segmentation |
|
Table of Contents
- 1. Introduction
- 1.1. Research Scope
- 1.2. Market Segmentation
- 1.3. Research Methodology
- 1.4. Definitions and Assumptions
- 2. Executive Summary
- 2.1. Introduction
- 3. Market Dynamics
- 3.1. Introduction
- 3.2. Market Drivers
- 3.2.1. ; Increasing Consumption of Plastics in Construction Sector; Other Drivers
- 3.3. Market Restrains
- 3.3.1. ; Toxicity related to Phthalic Anhydride; Unfavorable Conditions Arising Due to COVID-19 Outbreak
- 3.4. Market Trends
- 3.4.1. Construction Sector to Dominate the Market
- 4. Market Factor Analysis
- 4.1. Porters Five Forces
- 4.2. Supply/Value Chain
- 4.3. PESTEL analysis
- 4.4. Market Entropy
- 4.5. Patent/Trademark Analysis
- 5. Global Phthalic Anhydride Derivatives Industry Analysis, Insights and Forecast, 2019-2031
- 5.1. Market Analysis, Insights and Forecast - by Derivatives
- 5.1.1. Unsaturated Polyester Resins
- 5.1.2. Alkyd Resin
- 5.1.3. Plasticizer
- 5.1.4. Other
- 5.2. Market Analysis, Insights and Forecast - by End-user Industry
- 5.2.1. Construction
- 5.2.2. Automotive
- 5.2.3. Electrical and Electronics
- 5.2.4. Aerospace
- 5.2.5. Others
- 5.3. Market Analysis, Insights and Forecast - by Region
- 5.3.1. Asia Pacific
- 5.3.2. North America
- 5.3.3. Europe
- 5.3.4. South America
- 5.3.5. Middle East and Africa
- 5.1. Market Analysis, Insights and Forecast - by Derivatives
- 6. Asia Pacific Phthalic Anhydride Derivatives Industry Analysis, Insights and Forecast, 2019-2031
- 6.1. Market Analysis, Insights and Forecast - by Derivatives
- 6.1.1. Unsaturated Polyester Resins
- 6.1.2. Alkyd Resin
- 6.1.3. Plasticizer
- 6.1.4. Other
- 6.2. Market Analysis, Insights and Forecast - by End-user Industry
- 6.2.1. Construction
- 6.2.2. Automotive
- 6.2.3. Electrical and Electronics
- 6.2.4. Aerospace
- 6.2.5. Others
- 6.1. Market Analysis, Insights and Forecast - by Derivatives
- 7. North America Phthalic Anhydride Derivatives Industry Analysis, Insights and Forecast, 2019-2031
- 7.1. Market Analysis, Insights and Forecast - by Derivatives
- 7.1.1. Unsaturated Polyester Resins
- 7.1.2. Alkyd Resin
- 7.1.3. Plasticizer
- 7.1.4. Other
- 7.2. Market Analysis, Insights and Forecast - by End-user Industry
- 7.2.1. Construction
- 7.2.2. Automotive
- 7.2.3. Electrical and Electronics
- 7.2.4. Aerospace
- 7.2.5. Others
- 7.1. Market Analysis, Insights and Forecast - by Derivatives
- 8. Europe Phthalic Anhydride Derivatives Industry Analysis, Insights and Forecast, 2019-2031
- 8.1. Market Analysis, Insights and Forecast - by Derivatives
- 8.1.1. Unsaturated Polyester Resins
- 8.1.2. Alkyd Resin
- 8.1.3. Plasticizer
- 8.1.4. Other
- 8.2. Market Analysis, Insights and Forecast - by End-user Industry
- 8.2.1. Construction
- 8.2.2. Automotive
- 8.2.3. Electrical and Electronics
- 8.2.4. Aerospace
- 8.2.5. Others
- 8.1. Market Analysis, Insights and Forecast - by Derivatives
- 9. South America Phthalic Anhydride Derivatives Industry Analysis, Insights and Forecast, 2019-2031
- 9.1. Market Analysis, Insights and Forecast - by Derivatives
- 9.1.1. Unsaturated Polyester Resins
- 9.1.2. Alkyd Resin
- 9.1.3. Plasticizer
- 9.1.4. Other
- 9.2. Market Analysis, Insights and Forecast - by End-user Industry
- 9.2.1. Construction
- 9.2.2. Automotive
- 9.2.3. Electrical and Electronics
- 9.2.4. Aerospace
- 9.2.5. Others
- 9.1. Market Analysis, Insights and Forecast - by Derivatives
- 10. Middle East and Africa Phthalic Anhydride Derivatives Industry Analysis, Insights and Forecast, 2019-2031
- 10.1. Market Analysis, Insights and Forecast - by Derivatives
- 10.1.1. Unsaturated Polyester Resins
- 10.1.2. Alkyd Resin
- 10.1.3. Plasticizer
- 10.1.4. Other
- 10.2. Market Analysis, Insights and Forecast - by End-user Industry
- 10.2.1. Construction
- 10.2.2. Automotive
- 10.2.3. Electrical and Electronics
- 10.2.4. Aerospace
- 10.2.5. Others
- 10.1. Market Analysis, Insights and Forecast - by Derivatives
- 11. North America Phthalic Anhydride Derivatives Industry Analysis, Insights and Forecast, 2019-2031
- 11.1. Market Analysis, Insights and Forecast - By Country/Sub-region
- 11.1.1 United States
- 11.1.2 Canada
- 11.1.3 Mexico
- 12. Europe Phthalic Anhydride Derivatives Industry Analysis, Insights and Forecast, 2019-2031
- 12.1. Market Analysis, Insights and Forecast - By Country/Sub-region
- 12.1.1 Germany
- 12.1.2 France
- 12.1.3 Italy
- 12.1.4 United Kingdom
- 12.1.5 Netherlands
- 12.1.6 Rest of Europe
- 13. Asia Pacific Phthalic Anhydride Derivatives Industry Analysis, Insights and Forecast, 2019-2031
- 13.1. Market Analysis, Insights and Forecast - By Country/Sub-region
- 13.1.1 China
- 13.1.2 Japan
- 13.1.3 India
- 13.1.4 South Korea
- 13.1.5 Taiwan
- 13.1.6 Australia
- 13.1.7 Rest of Asia-Pacific
- 14. South America Phthalic Anhydride Derivatives Industry Analysis, Insights and Forecast, 2019-2031
- 14.1. Market Analysis, Insights and Forecast - By Country/Sub-region
- 14.1.1 Brazil
- 14.1.2 Argentina
- 14.1.3 Rest of South America
- 15. MEA Phthalic Anhydride Derivatives Industry Analysis, Insights and Forecast, 2019-2031
- 15.1. Market Analysis, Insights and Forecast - By Country/Sub-region
- 15.1.1 Middle East
- 15.1.2 Africa
- 16. Competitive Analysis
- 16.1. Global Market Share Analysis 2024
- 16.2. Company Profiles
- 16.2.1 KH Chemicals
- 16.2.1.1. Overview
- 16.2.1.2. Products
- 16.2.1.3. SWOT Analysis
- 16.2.1.4. Recent Developments
- 16.2.1.5. Financials (Based on Availability)
- 16.2.2 Stepan Company
- 16.2.2.1. Overview
- 16.2.2.2. Products
- 16.2.2.3. SWOT Analysis
- 16.2.2.4. Recent Developments
- 16.2.2.5. Financials (Based on Availability)
- 16.2.3 LANXESS
- 16.2.3.1. Overview
- 16.2.3.2. Products
- 16.2.3.3. SWOT Analysis
- 16.2.3.4. Recent Developments
- 16.2.3.5. Financials (Based on Availability)
- 16.2.4 BASF SE
- 16.2.4.1. Overview
- 16.2.4.2. Products
- 16.2.4.3. SWOT Analysis
- 16.2.4.4. Recent Developments
- 16.2.4.5. Financials (Based on Availability)
- 16.2.5 Alfa Aesar
- 16.2.5.1. Overview
- 16.2.5.2. Products
- 16.2.5.3. SWOT Analysis
- 16.2.5.4. Recent Developments
- 16.2.5.5. Financials (Based on Availability)
- 16.2.6 PENPET Petrochemical Trading GmbH
- 16.2.6.1. Overview
- 16.2.6.2. Products
- 16.2.6.3. SWOT Analysis
- 16.2.6.4. Recent Developments
- 16.2.6.5. Financials (Based on Availability)
- 16.2.7 JFE Chemical Corporation
- 16.2.7.1. Overview
- 16.2.7.2. Products
- 16.2.7.3. SWOT Analysis
- 16.2.7.4. Recent Developments
- 16.2.7.5. Financials (Based on Availability)
- 16.2.8 I G Petrochemicals Ltd
- 16.2.8.1. Overview
- 16.2.8.2. Products
- 16.2.8.3. SWOT Analysis
- 16.2.8.4. Recent Developments
- 16.2.8.5. Financials (Based on Availability)
- 16.2.9 Polynt SpA
- 16.2.9.1. Overview
- 16.2.9.2. Products
- 16.2.9.3. SWOT Analysis
- 16.2.9.4. Recent Developments
- 16.2.9.5. Financials (Based on Availability)
- 16.2.10 Thirumalai Chemicals Ltd
- 16.2.10.1. Overview
- 16.2.10.2. Products
- 16.2.10.3. SWOT Analysis
- 16.2.10.4. Recent Developments
- 16.2.10.5. Financials (Based on Availability)
- 16.2.11 Tokyo Chemical Industry
- 16.2.11.1. Overview
- 16.2.11.2. Products
- 16.2.11.3. SWOT Analysis
- 16.2.11.4. Recent Developments
- 16.2.11.5. Financials (Based on Availability)
- 16.2.12 S I Group Inc
- 16.2.12.1. Overview
- 16.2.12.2. Products
- 16.2.12.3. SWOT Analysis
- 16.2.12.4. Recent Developments
- 16.2.12.5. Financials (Based on Availability)
- 16.2.13 Koppers Inc
- 16.2.13.1. Overview
- 16.2.13.2. Products
- 16.2.13.3. SWOT Analysis
- 16.2.13.4. Recent Developments
- 16.2.13.5. Financials (Based on Availability)
- 16.2.14 Perstorp
- 16.2.14.1. Overview
- 16.2.14.2. Products
- 16.2.14.3. SWOT Analysis
- 16.2.14.4. Recent Developments
- 16.2.14.5. Financials (Based on Availability)
- 16.2.15 The Chemical Company
- 16.2.15.1. Overview
- 16.2.15.2. Products
- 16.2.15.3. SWOT Analysis
- 16.2.15.4. Recent Developments
- 16.2.15.5. Financials (Based on Availability)
- 16.2.1 KH Chemicals
List of Figures
- Figure 1: Global Phthalic Anhydride Derivatives Industry Revenue Breakdown (Million, %) by Region 2024 & 2032
- Figure 2: Global Phthalic Anhydride Derivatives Industry Volume Breakdown (K Tons, %) by Region 2024 & 2032
- Figure 3: North America Phthalic Anhydride Derivatives Industry Revenue (Million), by Country 2024 & 2032
- Figure 4: North America Phthalic Anhydride Derivatives Industry Volume (K Tons), by Country 2024 & 2032
- Figure 5: North America Phthalic Anhydride Derivatives Industry Revenue Share (%), by Country 2024 & 2032
- Figure 6: North America Phthalic Anhydride Derivatives Industry Volume Share (%), by Country 2024 & 2032
- Figure 7: Europe Phthalic Anhydride Derivatives Industry Revenue (Million), by Country 2024 & 2032
- Figure 8: Europe Phthalic Anhydride Derivatives Industry Volume (K Tons), by Country 2024 & 2032
- Figure 9: Europe Phthalic Anhydride Derivatives Industry Revenue Share (%), by Country 2024 & 2032
- Figure 10: Europe Phthalic Anhydride Derivatives Industry Volume Share (%), by Country 2024 & 2032
- Figure 11: Asia Pacific Phthalic Anhydride Derivatives Industry Revenue (Million), by Country 2024 & 2032
- Figure 12: Asia Pacific Phthalic Anhydride Derivatives Industry Volume (K Tons), by Country 2024 & 2032
- Figure 13: Asia Pacific Phthalic Anhydride Derivatives Industry Revenue Share (%), by Country 2024 & 2032
- Figure 14: Asia Pacific Phthalic Anhydride Derivatives Industry Volume Share (%), by Country 2024 & 2032
- Figure 15: South America Phthalic Anhydride Derivatives Industry Revenue (Million), by Country 2024 & 2032
- Figure 16: South America Phthalic Anhydride Derivatives Industry Volume (K Tons), by Country 2024 & 2032
- Figure 17: South America Phthalic Anhydride Derivatives Industry Revenue Share (%), by Country 2024 & 2032
- Figure 18: South America Phthalic Anhydride Derivatives Industry Volume Share (%), by Country 2024 & 2032
- Figure 19: MEA Phthalic Anhydride Derivatives Industry Revenue (Million), by Country 2024 & 2032
- Figure 20: MEA Phthalic Anhydride Derivatives Industry Volume (K Tons), by Country 2024 & 2032
- Figure 21: MEA Phthalic Anhydride Derivatives Industry Revenue Share (%), by Country 2024 & 2032
- Figure 22: MEA Phthalic Anhydride Derivatives Industry Volume Share (%), by Country 2024 & 2032
- Figure 23: Asia Pacific Phthalic Anhydride Derivatives Industry Revenue (Million), by Derivatives 2024 & 2032
- Figure 24: Asia Pacific Phthalic Anhydride Derivatives Industry Volume (K Tons), by Derivatives 2024 & 2032
- Figure 25: Asia Pacific Phthalic Anhydride Derivatives Industry Revenue Share (%), by Derivatives 2024 & 2032
- Figure 26: Asia Pacific Phthalic Anhydride Derivatives Industry Volume Share (%), by Derivatives 2024 & 2032
- Figure 27: Asia Pacific Phthalic Anhydride Derivatives Industry Revenue (Million), by End-user Industry 2024 & 2032
- Figure 28: Asia Pacific Phthalic Anhydride Derivatives Industry Volume (K Tons), by End-user Industry 2024 & 2032
- Figure 29: Asia Pacific Phthalic Anhydride Derivatives Industry Revenue Share (%), by End-user Industry 2024 & 2032
- Figure 30: Asia Pacific Phthalic Anhydride Derivatives Industry Volume Share (%), by End-user Industry 2024 & 2032
- Figure 31: Asia Pacific Phthalic Anhydride Derivatives Industry Revenue (Million), by Country 2024 & 2032
- Figure 32: Asia Pacific Phthalic Anhydride Derivatives Industry Volume (K Tons), by Country 2024 & 2032
- Figure 33: Asia Pacific Phthalic Anhydride Derivatives Industry Revenue Share (%), by Country 2024 & 2032
- Figure 34: Asia Pacific Phthalic Anhydride Derivatives Industry Volume Share (%), by Country 2024 & 2032
- Figure 35: North America Phthalic Anhydride Derivatives Industry Revenue (Million), by Derivatives 2024 & 2032
- Figure 36: North America Phthalic Anhydride Derivatives Industry Volume (K Tons), by Derivatives 2024 & 2032
- Figure 37: North America Phthalic Anhydride Derivatives Industry Revenue Share (%), by Derivatives 2024 & 2032
- Figure 38: North America Phthalic Anhydride Derivatives Industry Volume Share (%), by Derivatives 2024 & 2032
- Figure 39: North America Phthalic Anhydride Derivatives Industry Revenue (Million), by End-user Industry 2024 & 2032
- Figure 40: North America Phthalic Anhydride Derivatives Industry Volume (K Tons), by End-user Industry 2024 & 2032
- Figure 41: North America Phthalic Anhydride Derivatives Industry Revenue Share (%), by End-user Industry 2024 & 2032
- Figure 42: North America Phthalic Anhydride Derivatives Industry Volume Share (%), by End-user Industry 2024 & 2032
- Figure 43: North America Phthalic Anhydride Derivatives Industry Revenue (Million), by Country 2024 & 2032
- Figure 44: North America Phthalic Anhydride Derivatives Industry Volume (K Tons), by Country 2024 & 2032
- Figure 45: North America Phthalic Anhydride Derivatives Industry Revenue Share (%), by Country 2024 & 2032
- Figure 46: North America Phthalic Anhydride Derivatives Industry Volume Share (%), by Country 2024 & 2032
- Figure 47: Europe Phthalic Anhydride Derivatives Industry Revenue (Million), by Derivatives 2024 & 2032
- Figure 48: Europe Phthalic Anhydride Derivatives Industry Volume (K Tons), by Derivatives 2024 & 2032
- Figure 49: Europe Phthalic Anhydride Derivatives Industry Revenue Share (%), by Derivatives 2024 & 2032
- Figure 50: Europe Phthalic Anhydride Derivatives Industry Volume Share (%), by Derivatives 2024 & 2032
- Figure 51: Europe Phthalic Anhydride Derivatives Industry Revenue (Million), by End-user Industry 2024 & 2032
- Figure 52: Europe Phthalic Anhydride Derivatives Industry Volume (K Tons), by End-user Industry 2024 & 2032
- Figure 53: Europe Phthalic Anhydride Derivatives Industry Revenue Share (%), by End-user Industry 2024 & 2032
- Figure 54: Europe Phthalic Anhydride Derivatives Industry Volume Share (%), by End-user Industry 2024 & 2032
- Figure 55: Europe Phthalic Anhydride Derivatives Industry Revenue (Million), by Country 2024 & 2032
- Figure 56: Europe Phthalic Anhydride Derivatives Industry Volume (K Tons), by Country 2024 & 2032
- Figure 57: Europe Phthalic Anhydride Derivatives Industry Revenue Share (%), by Country 2024 & 2032
- Figure 58: Europe Phthalic Anhydride Derivatives Industry Volume Share (%), by Country 2024 & 2032
- Figure 59: South America Phthalic Anhydride Derivatives Industry Revenue (Million), by Derivatives 2024 & 2032
- Figure 60: South America Phthalic Anhydride Derivatives Industry Volume (K Tons), by Derivatives 2024 & 2032
- Figure 61: South America Phthalic Anhydride Derivatives Industry Revenue Share (%), by Derivatives 2024 & 2032
- Figure 62: South America Phthalic Anhydride Derivatives Industry Volume Share (%), by Derivatives 2024 & 2032
- Figure 63: South America Phthalic Anhydride Derivatives Industry Revenue (Million), by End-user Industry 2024 & 2032
- Figure 64: South America Phthalic Anhydride Derivatives Industry Volume (K Tons), by End-user Industry 2024 & 2032
- Figure 65: South America Phthalic Anhydride Derivatives Industry Revenue Share (%), by End-user Industry 2024 & 2032
- Figure 66: South America Phthalic Anhydride Derivatives Industry Volume Share (%), by End-user Industry 2024 & 2032
- Figure 67: South America Phthalic Anhydride Derivatives Industry Revenue (Million), by Country 2024 & 2032
- Figure 68: South America Phthalic Anhydride Derivatives Industry Volume (K Tons), by Country 2024 & 2032
- Figure 69: South America Phthalic Anhydride Derivatives Industry Revenue Share (%), by Country 2024 & 2032
- Figure 70: South America Phthalic Anhydride Derivatives Industry Volume Share (%), by Country 2024 & 2032
- Figure 71: Middle East and Africa Phthalic Anhydride Derivatives Industry Revenue (Million), by Derivatives 2024 & 2032
- Figure 72: Middle East and Africa Phthalic Anhydride Derivatives Industry Volume (K Tons), by Derivatives 2024 & 2032
- Figure 73: Middle East and Africa Phthalic Anhydride Derivatives Industry Revenue Share (%), by Derivatives 2024 & 2032
- Figure 74: Middle East and Africa Phthalic Anhydride Derivatives Industry Volume Share (%), by Derivatives 2024 & 2032
- Figure 75: Middle East and Africa Phthalic Anhydride Derivatives Industry Revenue (Million), by End-user Industry 2024 & 2032
- Figure 76: Middle East and Africa Phthalic Anhydride Derivatives Industry Volume (K Tons), by End-user Industry 2024 & 2032
- Figure 77: Middle East and Africa Phthalic Anhydride Derivatives Industry Revenue Share (%), by End-user Industry 2024 & 2032
- Figure 78: Middle East and Africa Phthalic Anhydride Derivatives Industry Volume Share (%), by End-user Industry 2024 & 2032
- Figure 79: Middle East and Africa Phthalic Anhydride Derivatives Industry Revenue (Million), by Country 2024 & 2032
- Figure 80: Middle East and Africa Phthalic Anhydride Derivatives Industry Volume (K Tons), by Country 2024 & 2032
- Figure 81: Middle East and Africa Phthalic Anhydride Derivatives Industry Revenue Share (%), by Country 2024 & 2032
- Figure 82: Middle East and Africa Phthalic Anhydride Derivatives Industry Volume Share (%), by Country 2024 & 2032
List of Tables
- Table 1: Global Phthalic Anhydride Derivatives Industry Revenue Million Forecast, by Region 2019 & 2032
- Table 2: Global Phthalic Anhydride Derivatives Industry Volume K Tons Forecast, by Region 2019 & 2032
- Table 3: Global Phthalic Anhydride Derivatives Industry Revenue Million Forecast, by Derivatives 2019 & 2032
- Table 4: Global Phthalic Anhydride Derivatives Industry Volume K Tons Forecast, by Derivatives 2019 & 2032
- Table 5: Global Phthalic Anhydride Derivatives Industry Revenue Million Forecast, by End-user Industry 2019 & 2032
- Table 6: Global Phthalic Anhydride Derivatives Industry Volume K Tons Forecast, by End-user Industry 2019 & 2032
- Table 7: Global Phthalic Anhydride Derivatives Industry Revenue Million Forecast, by Region 2019 & 2032
- Table 8: Global Phthalic Anhydride Derivatives Industry Volume K Tons Forecast, by Region 2019 & 2032
- Table 9: Global Phthalic Anhydride Derivatives Industry Revenue Million Forecast, by Country 2019 & 2032
- Table 10: Global Phthalic Anhydride Derivatives Industry Volume K Tons Forecast, by Country 2019 & 2032
- Table 11: United States Phthalic Anhydride Derivatives Industry Revenue (Million) Forecast, by Application 2019 & 2032
- Table 12: United States Phthalic Anhydride Derivatives Industry Volume (K Tons) Forecast, by Application 2019 & 2032
- Table 13: Canada Phthalic Anhydride Derivatives Industry Revenue (Million) Forecast, by Application 2019 & 2032
- Table 14: Canada Phthalic Anhydride Derivatives Industry Volume (K Tons) Forecast, by Application 2019 & 2032
- Table 15: Mexico Phthalic Anhydride Derivatives Industry Revenue (Million) Forecast, by Application 2019 & 2032
- Table 16: Mexico Phthalic Anhydride Derivatives Industry Volume (K Tons) Forecast, by Application 2019 & 2032
- Table 17: Global Phthalic Anhydride Derivatives Industry Revenue Million Forecast, by Country 2019 & 2032
- Table 18: Global Phthalic Anhydride Derivatives Industry Volume K Tons Forecast, by Country 2019 & 2032
- Table 19: Germany Phthalic Anhydride Derivatives Industry Revenue (Million) Forecast, by Application 2019 & 2032
- Table 20: Germany Phthalic Anhydride Derivatives Industry Volume (K Tons) Forecast, by Application 2019 & 2032
- Table 21: France Phthalic Anhydride Derivatives Industry Revenue (Million) Forecast, by Application 2019 & 2032
- Table 22: France Phthalic Anhydride Derivatives Industry Volume (K Tons) Forecast, by Application 2019 & 2032
- Table 23: Italy Phthalic Anhydride Derivatives Industry Revenue (Million) Forecast, by Application 2019 & 2032
- Table 24: Italy Phthalic Anhydride Derivatives Industry Volume (K Tons) Forecast, by Application 2019 & 2032
- Table 25: United Kingdom Phthalic Anhydride Derivatives Industry Revenue (Million) Forecast, by Application 2019 & 2032
- Table 26: United Kingdom Phthalic Anhydride Derivatives Industry Volume (K Tons) Forecast, by Application 2019 & 2032
- Table 27: Netherlands Phthalic Anhydride Derivatives Industry Revenue (Million) Forecast, by Application 2019 & 2032
- Table 28: Netherlands Phthalic Anhydride Derivatives Industry Volume (K Tons) Forecast, by Application 2019 & 2032
- Table 29: Rest of Europe Phthalic Anhydride Derivatives Industry Revenue (Million) Forecast, by Application 2019 & 2032
- Table 30: Rest of Europe Phthalic Anhydride Derivatives Industry Volume (K Tons) Forecast, by Application 2019 & 2032
- Table 31: Global Phthalic Anhydride Derivatives Industry Revenue Million Forecast, by Country 2019 & 2032
- Table 32: Global Phthalic Anhydride Derivatives Industry Volume K Tons Forecast, by Country 2019 & 2032
- Table 33: China Phthalic Anhydride Derivatives Industry Revenue (Million) Forecast, by Application 2019 & 2032
- Table 34: China Phthalic Anhydride Derivatives Industry Volume (K Tons) Forecast, by Application 2019 & 2032
- Table 35: Japan Phthalic Anhydride Derivatives Industry Revenue (Million) Forecast, by Application 2019 & 2032
- Table 36: Japan Phthalic Anhydride Derivatives Industry Volume (K Tons) Forecast, by Application 2019 & 2032
- Table 37: India Phthalic Anhydride Derivatives Industry Revenue (Million) Forecast, by Application 2019 & 2032
- Table 38: India Phthalic Anhydride Derivatives Industry Volume (K Tons) Forecast, by Application 2019 & 2032
- Table 39: South Korea Phthalic Anhydride Derivatives Industry Revenue (Million) Forecast, by Application 2019 & 2032
- Table 40: South Korea Phthalic Anhydride Derivatives Industry Volume (K Tons) Forecast, by Application 2019 & 2032
- Table 41: Taiwan Phthalic Anhydride Derivatives Industry Revenue (Million) Forecast, by Application 2019 & 2032
- Table 42: Taiwan Phthalic Anhydride Derivatives Industry Volume (K Tons) Forecast, by Application 2019 & 2032
- Table 43: Australia Phthalic Anhydride Derivatives Industry Revenue (Million) Forecast, by Application 2019 & 2032
- Table 44: Australia Phthalic Anhydride Derivatives Industry Volume (K Tons) Forecast, by Application 2019 & 2032
- Table 45: Rest of Asia-Pacific Phthalic Anhydride Derivatives Industry Revenue (Million) Forecast, by Application 2019 & 2032
- Table 46: Rest of Asia-Pacific Phthalic Anhydride Derivatives Industry Volume (K Tons) Forecast, by Application 2019 & 2032
- Table 47: Global Phthalic Anhydride Derivatives Industry Revenue Million Forecast, by Country 2019 & 2032
- Table 48: Global Phthalic Anhydride Derivatives Industry Volume K Tons Forecast, by Country 2019 & 2032
- Table 49: Brazil Phthalic Anhydride Derivatives Industry Revenue (Million) Forecast, by Application 2019 & 2032
- Table 50: Brazil Phthalic Anhydride Derivatives Industry Volume (K Tons) Forecast, by Application 2019 & 2032
- Table 51: Argentina Phthalic Anhydride Derivatives Industry Revenue (Million) Forecast, by Application 2019 & 2032
- Table 52: Argentina Phthalic Anhydride Derivatives Industry Volume (K Tons) Forecast, by Application 2019 & 2032
- Table 53: Rest of South America Phthalic Anhydride Derivatives Industry Revenue (Million) Forecast, by Application 2019 & 2032
- Table 54: Rest of South America Phthalic Anhydride Derivatives Industry Volume (K Tons) Forecast, by Application 2019 & 2032
- Table 55: Global Phthalic Anhydride Derivatives Industry Revenue Million Forecast, by Country 2019 & 2032
- Table 56: Global Phthalic Anhydride Derivatives Industry Volume K Tons Forecast, by Country 2019 & 2032
- Table 57: Middle East Phthalic Anhydride Derivatives Industry Revenue (Million) Forecast, by Application 2019 & 2032
- Table 58: Middle East Phthalic Anhydride Derivatives Industry Volume (K Tons) Forecast, by Application 2019 & 2032
- Table 59: Africa Phthalic Anhydride Derivatives Industry Revenue (Million) Forecast, by Application 2019 & 2032
- Table 60: Africa Phthalic Anhydride Derivatives Industry Volume (K Tons) Forecast, by Application 2019 & 2032
- Table 61: Global Phthalic Anhydride Derivatives Industry Revenue Million Forecast, by Derivatives 2019 & 2032
- Table 62: Global Phthalic Anhydride Derivatives Industry Volume K Tons Forecast, by Derivatives 2019 & 2032
- Table 63: Global Phthalic Anhydride Derivatives Industry Revenue Million Forecast, by End-user Industry 2019 & 2032
- Table 64: Global Phthalic Anhydride Derivatives Industry Volume K Tons Forecast, by End-user Industry 2019 & 2032
- Table 65: Global Phthalic Anhydride Derivatives Industry Revenue Million Forecast, by Country 2019 & 2032
- Table 66: Global Phthalic Anhydride Derivatives Industry Volume K Tons Forecast, by Country 2019 & 2032
- Table 67: China Phthalic Anhydride Derivatives Industry Revenue (Million) Forecast, by Application 2019 & 2032
- Table 68: China Phthalic Anhydride Derivatives Industry Volume (K Tons) Forecast, by Application 2019 & 2032
- Table 69: India Phthalic Anhydride Derivatives Industry Revenue (Million) Forecast, by Application 2019 & 2032
- Table 70: India Phthalic Anhydride Derivatives Industry Volume (K Tons) Forecast, by Application 2019 & 2032
- Table 71: Japan Phthalic Anhydride Derivatives Industry Revenue (Million) Forecast, by Application 2019 & 2032
- Table 72: Japan Phthalic Anhydride Derivatives Industry Volume (K Tons) Forecast, by Application 2019 & 2032
- Table 73: South Korea Phthalic Anhydride Derivatives Industry Revenue (Million) Forecast, by Application 2019 & 2032
- Table 74: South Korea Phthalic Anhydride Derivatives Industry Volume (K Tons) Forecast, by Application 2019 & 2032
- Table 75: Rest of Asia Pacific Phthalic Anhydride Derivatives Industry Revenue (Million) Forecast, by Application 2019 & 2032
- Table 76: Rest of Asia Pacific Phthalic Anhydride Derivatives Industry Volume (K Tons) Forecast, by Application 2019 & 2032
- Table 77: Global Phthalic Anhydride Derivatives Industry Revenue Million Forecast, by Derivatives 2019 & 2032
- Table 78: Global Phthalic Anhydride Derivatives Industry Volume K Tons Forecast, by Derivatives 2019 & 2032
- Table 79: Global Phthalic Anhydride Derivatives Industry Revenue Million Forecast, by End-user Industry 2019 & 2032
- Table 80: Global Phthalic Anhydride Derivatives Industry Volume K Tons Forecast, by End-user Industry 2019 & 2032
- Table 81: Global Phthalic Anhydride Derivatives Industry Revenue Million Forecast, by Country 2019 & 2032
- Table 82: Global Phthalic Anhydride Derivatives Industry Volume K Tons Forecast, by Country 2019 & 2032
- Table 83: United States Phthalic Anhydride Derivatives Industry Revenue (Million) Forecast, by Application 2019 & 2032
- Table 84: United States Phthalic Anhydride Derivatives Industry Volume (K Tons) Forecast, by Application 2019 & 2032
- Table 85: Canada Phthalic Anhydride Derivatives Industry Revenue (Million) Forecast, by Application 2019 & 2032
- Table 86: Canada Phthalic Anhydride Derivatives Industry Volume (K Tons) Forecast, by Application 2019 & 2032
- Table 87: Mexico Phthalic Anhydride Derivatives Industry Revenue (Million) Forecast, by Application 2019 & 2032
- Table 88: Mexico Phthalic Anhydride Derivatives Industry Volume (K Tons) Forecast, by Application 2019 & 2032
- Table 89: Global Phthalic Anhydride Derivatives Industry Revenue Million Forecast, by Derivatives 2019 & 2032
- Table 90: Global Phthalic Anhydride Derivatives Industry Volume K Tons Forecast, by Derivatives 2019 & 2032
- Table 91: Global Phthalic Anhydride Derivatives Industry Revenue Million Forecast, by End-user Industry 2019 & 2032
- Table 92: Global Phthalic Anhydride Derivatives Industry Volume K Tons Forecast, by End-user Industry 2019 & 2032
- Table 93: Global Phthalic Anhydride Derivatives Industry Revenue Million Forecast, by Country 2019 & 2032
- Table 94: Global Phthalic Anhydride Derivatives Industry Volume K Tons Forecast, by Country 2019 & 2032
- Table 95: Germany Phthalic Anhydride Derivatives Industry Revenue (Million) Forecast, by Application 2019 & 2032
- Table 96: Germany Phthalic Anhydride Derivatives Industry Volume (K Tons) Forecast, by Application 2019 & 2032
- Table 97: United Kingdom Phthalic Anhydride Derivatives Industry Revenue (Million) Forecast, by Application 2019 & 2032
- Table 98: United Kingdom Phthalic Anhydride Derivatives Industry Volume (K Tons) Forecast, by Application 2019 & 2032
- Table 99: France Phthalic Anhydride Derivatives Industry Revenue (Million) Forecast, by Application 2019 & 2032
- Table 100: France Phthalic Anhydride Derivatives Industry Volume (K Tons) Forecast, by Application 2019 & 2032
- Table 101: Italy Phthalic Anhydride Derivatives Industry Revenue (Million) Forecast, by Application 2019 & 2032
- Table 102: Italy Phthalic Anhydride Derivatives Industry Volume (K Tons) Forecast, by Application 2019 & 2032
- Table 103: Rest of Europe Phthalic Anhydride Derivatives Industry Revenue (Million) Forecast, by Application 2019 & 2032
- Table 104: Rest of Europe Phthalic Anhydride Derivatives Industry Volume (K Tons) Forecast, by Application 2019 & 2032
- Table 105: Global Phthalic Anhydride Derivatives Industry Revenue Million Forecast, by Derivatives 2019 & 2032
- Table 106: Global Phthalic Anhydride Derivatives Industry Volume K Tons Forecast, by Derivatives 2019 & 2032
- Table 107: Global Phthalic Anhydride Derivatives Industry Revenue Million Forecast, by End-user Industry 2019 & 2032
- Table 108: Global Phthalic Anhydride Derivatives Industry Volume K Tons Forecast, by End-user Industry 2019 & 2032
- Table 109: Global Phthalic Anhydride Derivatives Industry Revenue Million Forecast, by Country 2019 & 2032
- Table 110: Global Phthalic Anhydride Derivatives Industry Volume K Tons Forecast, by Country 2019 & 2032
- Table 111: Brazil Phthalic Anhydride Derivatives Industry Revenue (Million) Forecast, by Application 2019 & 2032
- Table 112: Brazil Phthalic Anhydride Derivatives Industry Volume (K Tons) Forecast, by Application 2019 & 2032
- Table 113: Argentina Phthalic Anhydride Derivatives Industry Revenue (Million) Forecast, by Application 2019 & 2032
- Table 114: Argentina Phthalic Anhydride Derivatives Industry Volume (K Tons) Forecast, by Application 2019 & 2032
- Table 115: Rest of South America Phthalic Anhydride Derivatives Industry Revenue (Million) Forecast, by Application 2019 & 2032
- Table 116: Rest of South America Phthalic Anhydride Derivatives Industry Volume (K Tons) Forecast, by Application 2019 & 2032
- Table 117: Global Phthalic Anhydride Derivatives Industry Revenue Million Forecast, by Derivatives 2019 & 2032
- Table 118: Global Phthalic Anhydride Derivatives Industry Volume K Tons Forecast, by Derivatives 2019 & 2032
- Table 119: Global Phthalic Anhydride Derivatives Industry Revenue Million Forecast, by End-user Industry 2019 & 2032
- Table 120: Global Phthalic Anhydride Derivatives Industry Volume K Tons Forecast, by End-user Industry 2019 & 2032
- Table 121: Global Phthalic Anhydride Derivatives Industry Revenue Million Forecast, by Country 2019 & 2032
- Table 122: Global Phthalic Anhydride Derivatives Industry Volume K Tons Forecast, by Country 2019 & 2032
- Table 123: Saudi Arabia Phthalic Anhydride Derivatives Industry Revenue (Million) Forecast, by Application 2019 & 2032
- Table 124: Saudi Arabia Phthalic Anhydride Derivatives Industry Volume (K Tons) Forecast, by Application 2019 & 2032
- Table 125: South Africa Phthalic Anhydride Derivatives Industry Revenue (Million) Forecast, by Application 2019 & 2032
- Table 126: South Africa Phthalic Anhydride Derivatives Industry Volume (K Tons) Forecast, by Application 2019 & 2032
- Table 127: Rest of Middle East and Africa Phthalic Anhydride Derivatives Industry Revenue (Million) Forecast, by Application 2019 & 2032
- Table 128: Rest of Middle East and Africa Phthalic Anhydride Derivatives Industry Volume (K Tons) Forecast, by Application 2019 & 2032
Frequently Asked Questions
1. What is the projected Compound Annual Growth Rate (CAGR) of the Phthalic Anhydride Derivatives Industry?
The projected CAGR is approximately > 4.40%.
2. Which companies are prominent players in the Phthalic Anhydride Derivatives Industry?
Key companies in the market include KH Chemicals, Stepan Company, LANXESS, BASF SE, Alfa Aesar, PENPET Petrochemical Trading GmbH, JFE Chemical Corporation, I G Petrochemicals Ltd, Polynt SpA, Thirumalai Chemicals Ltd, Tokyo Chemical Industry, S I Group Inc, Koppers Inc, Perstorp, The Chemical Company.
3. What are the main segments of the Phthalic Anhydride Derivatives Industry?
The market segments include Derivatives, End-user Industry.
4. Can you provide details about the market size?
The market size is estimated to be USD XX Million as of 2022.
5. What are some drivers contributing to market growth?
; Increasing Consumption of Plastics in Construction Sector; Other Drivers.
6. What are the notable trends driving market growth?
Construction Sector to Dominate the Market.
7. Are there any restraints impacting market growth?
; Toxicity related to Phthalic Anhydride; Unfavorable Conditions Arising Due to COVID-19 Outbreak.
8. Can you provide examples of recent developments in the market?
N/A
9. What pricing options are available for accessing the report?
Pricing options include single-user, multi-user, and enterprise licenses priced at USD 4750, USD 5250, and USD 8750 respectively.
10. Is the market size provided in terms of value or volume?
The market size is provided in terms of value, measured in Million and volume, measured in K Tons.
11. Are there any specific market keywords associated with the report?
Yes, the market keyword associated with the report is "Phthalic Anhydride Derivatives Industry," which aids in identifying and referencing the specific market segment covered.
12. How do I determine which pricing option suits my needs best?
The pricing options vary based on user requirements and access needs. Individual users may opt for single-user licenses, while businesses requiring broader access may choose multi-user or enterprise licenses for cost-effective access to the report.
13. Are there any additional resources or data provided in the Phthalic Anhydride Derivatives Industry report?
While the report offers comprehensive insights, it's advisable to review the specific contents or supplementary materials provided to ascertain if additional resources or data are available.
14. How can I stay updated on further developments or reports in the Phthalic Anhydride Derivatives Industry?
To stay informed about further developments, trends, and reports in the Phthalic Anhydride Derivatives Industry, consider subscribing to industry newsletters, following relevant companies and organizations, or regularly checking reputable industry news sources and publications.
Methodology
Step 1 - Identification of Relevant Samples Size from Population Database


Step 2 - Approaches for Defining Global Market Size (Value, Volume* & Price*)

Note*: In applicable scenarios
Step 3 - Data Sources
Primary Research
- Web Analytics
- Survey Reports
- Research Institute
- Latest Research Reports
- Opinion Leaders
Secondary Research
- Annual Reports
- White Paper
- Latest Press Release
- Industry Association
- Paid Database
- Investor Presentations

Step 4 - Data Triangulation
Involves using different sources of information in order to increase the validity of a study
These sources are likely to be stakeholders in a program - participants, other researchers, program staff, other community members, and so on.
Then we put all data in single framework & apply various statistical tools to find out the dynamic on the market.
During the analysis stage, feedback from the stakeholder groups would be compared to determine areas of agreement as well as areas of divergence


