
Key Insights
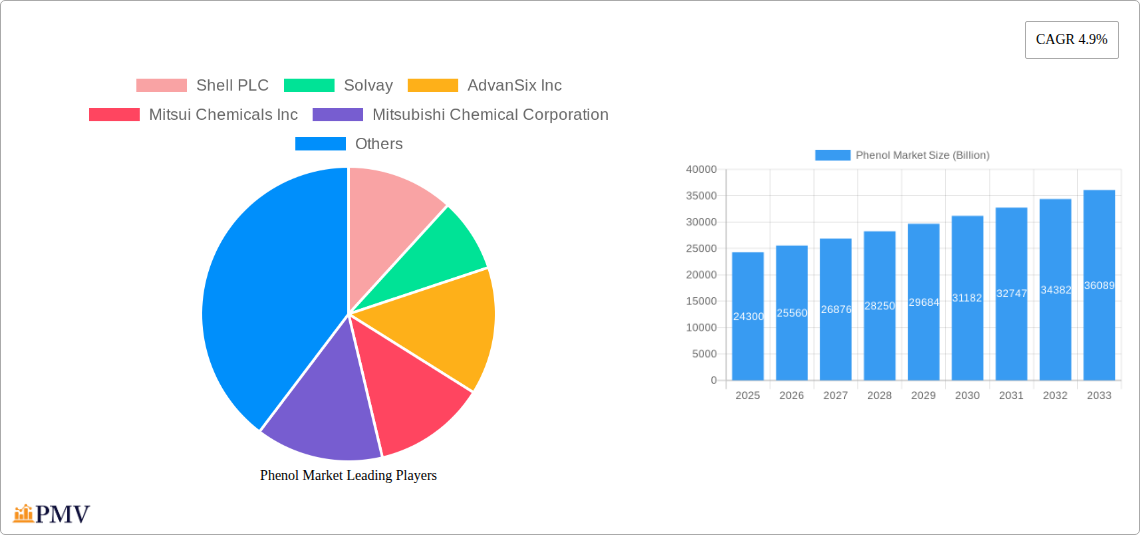
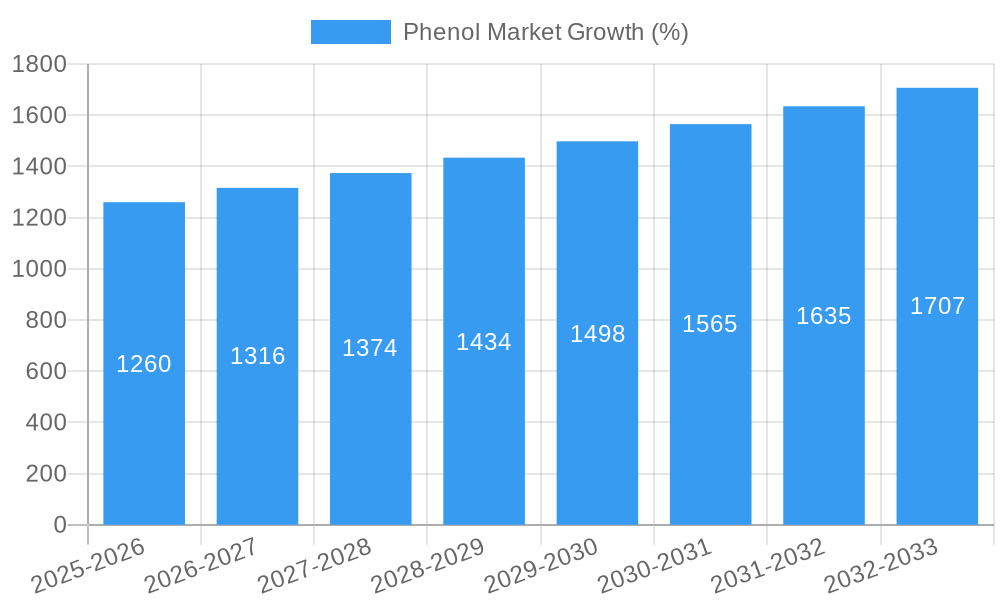
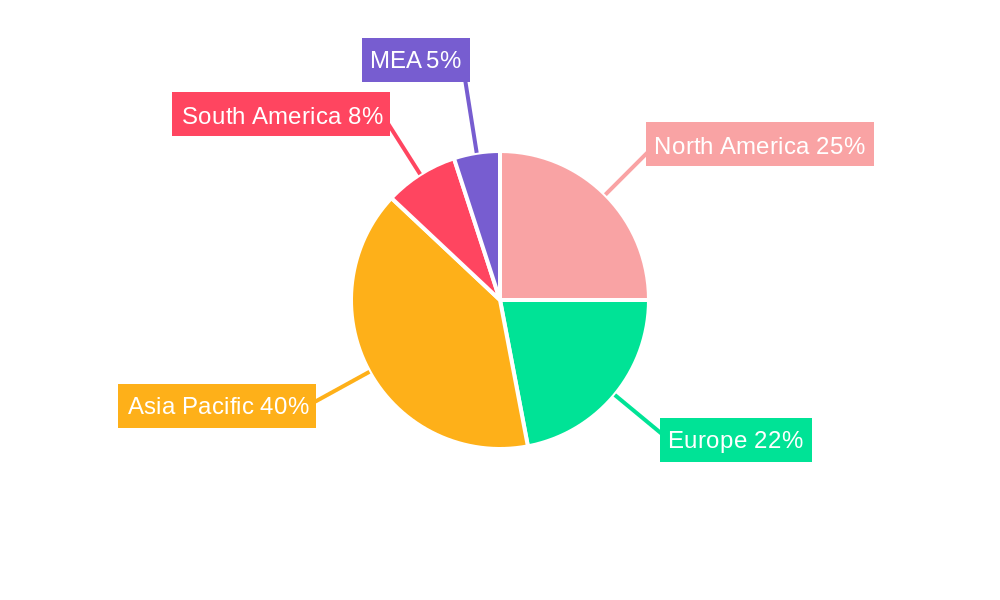
The global phenol market, valued at $24.3 billion in 2025, is projected to experience robust growth, driven by increasing demand from key downstream sectors. A compound annual growth rate (CAGR) of 4.9% from 2025 to 2033 indicates a significant expansion in market size. This growth is fueled by several factors. The burgeoning automotive industry, with its reliance on phenol-derived resins for lightweight composite materials, contributes significantly. Furthermore, the construction sector's increasing use of phenol-formaldehyde resins in adhesives, laminates, and coatings boosts market demand. The expanding electronics and electrical industries also fuel growth due to the use of phenolic resins in insulators and circuit boards. While some regional markets might show variations in growth rates, overall, Asia-Pacific is expected to dominate due to rapid industrialization and rising consumption in countries like China and India. However, fluctuating raw material prices and stringent environmental regulations pose challenges to market expansion. The market segmentation by product type (Phenolic Resins, Caprolactum, Bisphenol-A, and Others) reflects the diverse applications of phenol and its derivatives. Key players like Shell PLC, Solvay, and others are strategically investing in research and development and capacity expansion to meet the rising demand and navigate market complexities effectively.
The competitive landscape is characterized by the presence of both large multinational corporations and specialized chemical manufacturers. Companies are focusing on innovative product development and strategic partnerships to maintain market share. Sustainable production practices and the development of bio-based phenol alternatives are emerging trends impacting market dynamics. While North America and Europe hold significant market shares, the Asia-Pacific region's rapid industrialization and expanding manufacturing base are driving significant growth, presenting lucrative opportunities for market players. The historical data from 2019-2024 provides a solid foundation for forecasting future market trends, supporting the projections for continued growth and market expansion in the coming years. The diverse application of phenol across various industries guarantees its importance in the global chemical landscape for the foreseeable future.
Phenol Market: A Comprehensive Report (2019-2033)
This in-depth report provides a comprehensive analysis of the global Phenol Market, offering invaluable insights for stakeholders seeking to understand market dynamics, competitive landscapes, and future growth opportunities. The study period spans from 2019 to 2033, with 2025 serving as the base and estimated year. The market is segmented by product type, including Phenolic Resins, Caprolactum, Bisphenol-A, and Other Product Types. The report projects a market value exceeding xx Billion by 2033, exhibiting a CAGR of xx% during the forecast period (2025-2033).
Phenol Market Structure & Competitive Dynamics
The global Phenol market is characterized by a moderately concentrated structure, with several major players commanding significant market share. Key players, including Shell PLC, Solvay, AdvanSix Inc, Mitsui Chemicals Inc, Mitsubishi Chemical Corporation, Cepsa, Altivia, Domo Chemical GmbH, PTT Phenol Company Limited, Formosa Chemicals & Fibre Corp, INEOS Capital Limited, and Kumho P&B Chemicals Inc, engage in intense competition, driving innovation and impacting market pricing.
The market exhibits a dynamic M&A landscape. Recent transactions, such as the August 2022 acquisition of Mitsui Phenols Singapore Ltd by INEOS Phenol for USD 330 Million, significantly reshape market dynamics and production capacity. This acquisition alone increased total production capacity by 1 million tonnes, highlighting the strategic importance of consolidation within the industry. Further analysis within the report details market share distribution among key players and quantifies the value of M&A activities over the historical period (2019-2024), illustrating the competitive intensity and strategic maneuvering within the Phenol market. Innovation ecosystems are driven by a need for sustainable and cost-effective production methods, influencing both product development and market entry strategies. Regulatory frameworks, including environmental regulations and safety standards, play a crucial role in shaping the operational landscape and investment decisions. The report thoroughly examines the impact of these factors on market competition and growth trajectory. End-user trends toward sustainable products are creating new opportunities for manufacturers who can adapt to this shift. The presence of substitute materials also exerts pressure on pricing and market share.
Phenol Market Industry Trends & Insights
The Phenol market is witnessing robust growth fueled by several key factors. Increasing demand from diverse end-use industries, including construction, automotive, and electronics, is a primary growth driver. Technological advancements in production processes, leading to improved efficiency and reduced costs, further contribute to market expansion. Consumer preferences for high-performance and sustainable materials are also shaping market trends. Furthermore, the growing focus on sustainability is pushing innovation towards eco-friendly production methods, resulting in the emergence of sustainable products like Cepsa's NextPhenol (launched April 2022). The market's competitive dynamics are characterized by continuous innovation, strategic partnerships, and aggressive capacity expansion initiatives by major players. The report provides a detailed analysis of these trends, incorporating specific metrics such as CAGR and market penetration rates across key segments and geographies, providing a clear picture of the Phenol market’s growth trajectory. The report explores the significant impact of macroeconomic conditions, geopolitical shifts, and raw material price fluctuations on the market's overall performance and future prospects.
Dominant Markets & Segments in Phenol Market
The Phenol market demonstrates regional variations in growth and dominance. [Insert name of leading region/country] currently holds a leading position, driven by factors such as robust economic growth, favorable government policies, and well-established infrastructure.
- Key Drivers in the Leading Region/Country:
- Strong economic growth driving industrial expansion.
- Government incentives promoting the use of Phenol-based products.
- Developed infrastructure facilitating efficient manufacturing and distribution.
Among product types, Phenolic Resins represent the largest segment, holding a dominant market share due to its widespread applications in various industries. Bisphenol-A and Caprolactum also occupy significant market share. The report presents an in-depth analysis of each segment's growth drivers, market size, and competitive landscape. The analysis includes the impact of economic policies, infrastructure developments, technological advancements, and regulatory changes within each segment's growth trajectory. Detailed regional breakdowns and competitive analyses provide a granular view of market dominance and future potential.
Phenol Market Product Innovations
Recent years have witnessed significant product innovations in the Phenol market. Emphasis is placed on developing sustainable and high-performance products tailored to specific application needs. Technological trends are focused on improving production efficiency, reducing environmental impact, and enhancing product performance characteristics. The integration of renewable resources into the manufacturing process and the development of customized formulations for enhanced functionality are prominent features of the current innovation landscape. This focus on innovation is improving market fit, leading to increased adoption in diverse end-use industries.
Report Segmentation & Scope
This report segments the Phenol market primarily by product type:
Phenolic Resins: This segment is expected to exhibit significant growth due to its widespread application in construction, automotive, and other industries. The report provides detailed analysis of market size, growth projections, and competitive landscape.
Caprolactum: This segment’s growth is projected to be influenced by its use in nylon production. Competitive dynamics and market trends are thoroughly analyzed.
Bisphenol-A: The market for Bisphenol-A is expected to grow at a moderate pace, driven by its use in various applications. The report identifies key growth drivers and challenges for this segment.
Other Product Types: This segment encompasses other Phenol-derived products with diverse applications. The report details the growth potential and dynamics of this segment.
Key Drivers of Phenol Market Growth
Several factors fuel the growth of the Phenol market. Technological advancements in production methods enhance efficiency and reduce costs. Strong demand from diverse end-use industries, especially construction and automotive, is a major driver. Favorable government policies supporting industrial growth in key regions further contribute to market expansion. Finally, the ongoing focus on developing sustainable and environmentally friendly products is opening new avenues for growth within the sector.
Challenges in the Phenol Market Sector
The Phenol market faces several challenges. Stringent environmental regulations impact production costs and necessitate investments in cleaner technologies. Supply chain disruptions and fluctuations in raw material prices also affect profitability. Intense competition among established players and emerging market entrants creates pricing pressures. These factors, along with potential health and safety concerns related to phenol handling and exposure, pose significant challenges to sustained and consistent market growth.
Leading Players in the Phenol Market Market
- Shell PLC (Shell PLC)
- Solvay (Solvay)
- AdvanSix Inc (AdvanSix Inc)
- Mitsui Chemicals Inc (Mitsui Chemicals Inc)
- Mitsubishi Chemical Corporation (Mitsubishi Chemical Corporation)
- Cepsa (Cepsa)
- Altivia
- Domo Chemical GmbH (Domo Chemical GmbH)
- PTT Phenol Company Limited
- Formosa Chemicals & Fibre Corp
- INEOS Capital Limited (INEOS Capital Limited)
- Kumho P&B Chemicals Inc
Key Developments in Phenol Market Sector
August 2022: INEOS Phenol's acquisition of Mitsui Phenols Singapore Ltd's asset base for USD 330 million significantly increases production capacity and integrates operations across multiple regions.
April 2022: Cepsa launches NextPhenol, a sustainable Phenol product line produced from recycled feedstock, reflecting the growing industry focus on sustainability.
Strategic Phenol Market Outlook
The Phenol market is poised for continued growth, driven by increasing demand from key end-use sectors and ongoing innovation. Strategic opportunities exist for companies focusing on sustainable production methods and developing specialized Phenol-based products to meet evolving market needs. Further consolidation through M&A activity is anticipated, and players should consider expansion into emerging markets to capitalize on growth potential. Technological innovation in production and application will be crucial for securing market leadership.
Phenol Market Segmentation
-
1. Product Type
- 1.1. Phenolic Resins
- 1.2. Caprolactum
- 1.3. Bisphenol-A
- 1.4. Other Product Types
Phenol Market Segmentation By Geography
-
1. Asia Pacific
- 1.1. China
- 1.2. India
- 1.3. Japan
- 1.4. South Korea
- 1.5. Rest of Asia Pacific
-
2. North America
- 2.1. United States
- 2.2. Canada
- 2.3. Mexico
-
3. Europe
- 3.1. Germany
- 3.2. United Kingdom
- 3.3. France
- 3.4. Italy
- 3.5. Rest of Europe
-
4. South America
- 4.1. Brazil
- 4.2. Argentina
- 4.3. Rest of South America
-
5. Middle East and Africa
- 5.1. Saudi Arabia
- 5.2. South Africa
- 5.3. Rest of Middle East and Africa
Phenol Market REPORT HIGHLIGHTS
| Aspects | Details |
|---|---|
| Study Period | 2019-2033 |
| Base Year | 2024 |
| Estimated Year | 2025 |
| Forecast Period | 2025-2033 |
| Historical Period | 2019-2024 |
| Growth Rate | CAGR of 4.9% from 2019-2033 |
| Segmentation |
|
Table of Contents
- 1. Introduction
- 1.1. Research Scope
- 1.2. Market Segmentation
- 1.3. Research Methodology
- 1.4. Definitions and Assumptions
- 2. Executive Summary
- 2.1. Introduction
- 3. Market Dynamics
- 3.1. Introduction
- 3.2. Market Drivers
- 3.2.1. High Demand of Bisphenol-A; Other Drivers
- 3.3. Market Restrains
- 3.3.1. Ban on BPA in the United States and Europe; Others Restraints
- 3.4. Market Trends
- 3.4.1. Bisphenol-A Product Type to Drive the Market
- 4. Market Factor Analysis
- 4.1. Porters Five Forces
- 4.2. Supply/Value Chain
- 4.3. PESTEL analysis
- 4.4. Market Entropy
- 4.5. Patent/Trademark Analysis
- 5. Global Phenol Market Analysis, Insights and Forecast, 2019-2031
- 5.1. Market Analysis, Insights and Forecast - by Product Type
- 5.1.1. Phenolic Resins
- 5.1.2. Caprolactum
- 5.1.3. Bisphenol-A
- 5.1.4. Other Product Types
- 5.2. Market Analysis, Insights and Forecast - by Region
- 5.2.1. Asia Pacific
- 5.2.2. North America
- 5.2.3. Europe
- 5.2.4. South America
- 5.2.5. Middle East and Africa
- 5.1. Market Analysis, Insights and Forecast - by Product Type
- 6. Asia Pacific Phenol Market Analysis, Insights and Forecast, 2019-2031
- 6.1. Market Analysis, Insights and Forecast - by Product Type
- 6.1.1. Phenolic Resins
- 6.1.2. Caprolactum
- 6.1.3. Bisphenol-A
- 6.1.4. Other Product Types
- 6.1. Market Analysis, Insights and Forecast - by Product Type
- 7. North America Phenol Market Analysis, Insights and Forecast, 2019-2031
- 7.1. Market Analysis, Insights and Forecast - by Product Type
- 7.1.1. Phenolic Resins
- 7.1.2. Caprolactum
- 7.1.3. Bisphenol-A
- 7.1.4. Other Product Types
- 7.1. Market Analysis, Insights and Forecast - by Product Type
- 8. Europe Phenol Market Analysis, Insights and Forecast, 2019-2031
- 8.1. Market Analysis, Insights and Forecast - by Product Type
- 8.1.1. Phenolic Resins
- 8.1.2. Caprolactum
- 8.1.3. Bisphenol-A
- 8.1.4. Other Product Types
- 8.1. Market Analysis, Insights and Forecast - by Product Type
- 9. South America Phenol Market Analysis, Insights and Forecast, 2019-2031
- 9.1. Market Analysis, Insights and Forecast - by Product Type
- 9.1.1. Phenolic Resins
- 9.1.2. Caprolactum
- 9.1.3. Bisphenol-A
- 9.1.4. Other Product Types
- 9.1. Market Analysis, Insights and Forecast - by Product Type
- 10. Middle East and Africa Phenol Market Analysis, Insights and Forecast, 2019-2031
- 10.1. Market Analysis, Insights and Forecast - by Product Type
- 10.1.1. Phenolic Resins
- 10.1.2. Caprolactum
- 10.1.3. Bisphenol-A
- 10.1.4. Other Product Types
- 10.1. Market Analysis, Insights and Forecast - by Product Type
- 11. North America Phenol Market Analysis, Insights and Forecast, 2019-2031
- 11.1. Market Analysis, Insights and Forecast - By Country/Sub-region
- 11.1.1 United States
- 11.1.2 Canada
- 11.1.3 Mexico
- 12. Europe Phenol Market Analysis, Insights and Forecast, 2019-2031
- 12.1. Market Analysis, Insights and Forecast - By Country/Sub-region
- 12.1.1 Germany
- 12.1.2 France
- 12.1.3 Italy
- 12.1.4 United Kingdom
- 12.1.5 Netherlands
- 12.1.6 Rest of Europe
- 13. Asia Pacific Phenol Market Analysis, Insights and Forecast, 2019-2031
- 13.1. Market Analysis, Insights and Forecast - By Country/Sub-region
- 13.1.1 China
- 13.1.2 Japan
- 13.1.3 India
- 13.1.4 South Korea
- 13.1.5 Taiwan
- 13.1.6 Australia
- 13.1.7 Rest of Asia-Pacific
- 14. South America Phenol Market Analysis, Insights and Forecast, 2019-2031
- 14.1. Market Analysis, Insights and Forecast - By Country/Sub-region
- 14.1.1 Brazil
- 14.1.2 Argentina
- 14.1.3 Rest of South America
- 15. MEA Phenol Market Analysis, Insights and Forecast, 2019-2031
- 15.1. Market Analysis, Insights and Forecast - By Country/Sub-region
- 15.1.1 Middle East
- 15.1.2 Africa
- 16. Competitive Analysis
- 16.1. Global Market Share Analysis 2024
- 16.2. Company Profiles
- 16.2.1 Shell PLC
- 16.2.1.1. Overview
- 16.2.1.2. Products
- 16.2.1.3. SWOT Analysis
- 16.2.1.4. Recent Developments
- 16.2.1.5. Financials (Based on Availability)
- 16.2.2 Solvay
- 16.2.2.1. Overview
- 16.2.2.2. Products
- 16.2.2.3. SWOT Analysis
- 16.2.2.4. Recent Developments
- 16.2.2.5. Financials (Based on Availability)
- 16.2.3 AdvanSix Inc
- 16.2.3.1. Overview
- 16.2.3.2. Products
- 16.2.3.3. SWOT Analysis
- 16.2.3.4. Recent Developments
- 16.2.3.5. Financials (Based on Availability)
- 16.2.4 Mitsui Chemicals Inc
- 16.2.4.1. Overview
- 16.2.4.2. Products
- 16.2.4.3. SWOT Analysis
- 16.2.4.4. Recent Developments
- 16.2.4.5. Financials (Based on Availability)
- 16.2.5 Mitsubishi Chemical Corporation
- 16.2.5.1. Overview
- 16.2.5.2. Products
- 16.2.5.3. SWOT Analysis
- 16.2.5.4. Recent Developments
- 16.2.5.5. Financials (Based on Availability)
- 16.2.6 Cepsa
- 16.2.6.1. Overview
- 16.2.6.2. Products
- 16.2.6.3. SWOT Analysis
- 16.2.6.4. Recent Developments
- 16.2.6.5. Financials (Based on Availability)
- 16.2.7 Altivia
- 16.2.7.1. Overview
- 16.2.7.2. Products
- 16.2.7.3. SWOT Analysis
- 16.2.7.4. Recent Developments
- 16.2.7.5. Financials (Based on Availability)
- 16.2.8 Domo Chemical GmbH
- 16.2.8.1. Overview
- 16.2.8.2. Products
- 16.2.8.3. SWOT Analysis
- 16.2.8.4. Recent Developments
- 16.2.8.5. Financials (Based on Availability)
- 16.2.9 PTT Phenol Company Limited
- 16.2.9.1. Overview
- 16.2.9.2. Products
- 16.2.9.3. SWOT Analysis
- 16.2.9.4. Recent Developments
- 16.2.9.5. Financials (Based on Availability)
- 16.2.10 Formosa Chemicals & Fibre Corp
- 16.2.10.1. Overview
- 16.2.10.2. Products
- 16.2.10.3. SWOT Analysis
- 16.2.10.4. Recent Developments
- 16.2.10.5. Financials (Based on Availability)
- 16.2.11 INEOS Capital Limited
- 16.2.11.1. Overview
- 16.2.11.2. Products
- 16.2.11.3. SWOT Analysis
- 16.2.11.4. Recent Developments
- 16.2.11.5. Financials (Based on Availability)
- 16.2.12 Kumho P&B Chemicals Inc
- 16.2.12.1. Overview
- 16.2.12.2. Products
- 16.2.12.3. SWOT Analysis
- 16.2.12.4. Recent Developments
- 16.2.12.5. Financials (Based on Availability)
- 16.2.1 Shell PLC
List of Figures
- Figure 1: Global Phenol Market Revenue Breakdown (Billion, %) by Region 2024 & 2032
- Figure 2: Global Phenol Market Volume Breakdown (K Tons, %) by Region 2024 & 2032
- Figure 3: North America Phenol Market Revenue (Billion), by Country 2024 & 2032
- Figure 4: North America Phenol Market Volume (K Tons), by Country 2024 & 2032
- Figure 5: North America Phenol Market Revenue Share (%), by Country 2024 & 2032
- Figure 6: North America Phenol Market Volume Share (%), by Country 2024 & 2032
- Figure 7: Europe Phenol Market Revenue (Billion), by Country 2024 & 2032
- Figure 8: Europe Phenol Market Volume (K Tons), by Country 2024 & 2032
- Figure 9: Europe Phenol Market Revenue Share (%), by Country 2024 & 2032
- Figure 10: Europe Phenol Market Volume Share (%), by Country 2024 & 2032
- Figure 11: Asia Pacific Phenol Market Revenue (Billion), by Country 2024 & 2032
- Figure 12: Asia Pacific Phenol Market Volume (K Tons), by Country 2024 & 2032
- Figure 13: Asia Pacific Phenol Market Revenue Share (%), by Country 2024 & 2032
- Figure 14: Asia Pacific Phenol Market Volume Share (%), by Country 2024 & 2032
- Figure 15: South America Phenol Market Revenue (Billion), by Country 2024 & 2032
- Figure 16: South America Phenol Market Volume (K Tons), by Country 2024 & 2032
- Figure 17: South America Phenol Market Revenue Share (%), by Country 2024 & 2032
- Figure 18: South America Phenol Market Volume Share (%), by Country 2024 & 2032
- Figure 19: MEA Phenol Market Revenue (Billion), by Country 2024 & 2032
- Figure 20: MEA Phenol Market Volume (K Tons), by Country 2024 & 2032
- Figure 21: MEA Phenol Market Revenue Share (%), by Country 2024 & 2032
- Figure 22: MEA Phenol Market Volume Share (%), by Country 2024 & 2032
- Figure 23: Asia Pacific Phenol Market Revenue (Billion), by Product Type 2024 & 2032
- Figure 24: Asia Pacific Phenol Market Volume (K Tons), by Product Type 2024 & 2032
- Figure 25: Asia Pacific Phenol Market Revenue Share (%), by Product Type 2024 & 2032
- Figure 26: Asia Pacific Phenol Market Volume Share (%), by Product Type 2024 & 2032
- Figure 27: Asia Pacific Phenol Market Revenue (Billion), by Country 2024 & 2032
- Figure 28: Asia Pacific Phenol Market Volume (K Tons), by Country 2024 & 2032
- Figure 29: Asia Pacific Phenol Market Revenue Share (%), by Country 2024 & 2032
- Figure 30: Asia Pacific Phenol Market Volume Share (%), by Country 2024 & 2032
- Figure 31: North America Phenol Market Revenue (Billion), by Product Type 2024 & 2032
- Figure 32: North America Phenol Market Volume (K Tons), by Product Type 2024 & 2032
- Figure 33: North America Phenol Market Revenue Share (%), by Product Type 2024 & 2032
- Figure 34: North America Phenol Market Volume Share (%), by Product Type 2024 & 2032
- Figure 35: North America Phenol Market Revenue (Billion), by Country 2024 & 2032
- Figure 36: North America Phenol Market Volume (K Tons), by Country 2024 & 2032
- Figure 37: North America Phenol Market Revenue Share (%), by Country 2024 & 2032
- Figure 38: North America Phenol Market Volume Share (%), by Country 2024 & 2032
- Figure 39: Europe Phenol Market Revenue (Billion), by Product Type 2024 & 2032
- Figure 40: Europe Phenol Market Volume (K Tons), by Product Type 2024 & 2032
- Figure 41: Europe Phenol Market Revenue Share (%), by Product Type 2024 & 2032
- Figure 42: Europe Phenol Market Volume Share (%), by Product Type 2024 & 2032
- Figure 43: Europe Phenol Market Revenue (Billion), by Country 2024 & 2032
- Figure 44: Europe Phenol Market Volume (K Tons), by Country 2024 & 2032
- Figure 45: Europe Phenol Market Revenue Share (%), by Country 2024 & 2032
- Figure 46: Europe Phenol Market Volume Share (%), by Country 2024 & 2032
- Figure 47: South America Phenol Market Revenue (Billion), by Product Type 2024 & 2032
- Figure 48: South America Phenol Market Volume (K Tons), by Product Type 2024 & 2032
- Figure 49: South America Phenol Market Revenue Share (%), by Product Type 2024 & 2032
- Figure 50: South America Phenol Market Volume Share (%), by Product Type 2024 & 2032
- Figure 51: South America Phenol Market Revenue (Billion), by Country 2024 & 2032
- Figure 52: South America Phenol Market Volume (K Tons), by Country 2024 & 2032
- Figure 53: South America Phenol Market Revenue Share (%), by Country 2024 & 2032
- Figure 54: South America Phenol Market Volume Share (%), by Country 2024 & 2032
- Figure 55: Middle East and Africa Phenol Market Revenue (Billion), by Product Type 2024 & 2032
- Figure 56: Middle East and Africa Phenol Market Volume (K Tons), by Product Type 2024 & 2032
- Figure 57: Middle East and Africa Phenol Market Revenue Share (%), by Product Type 2024 & 2032
- Figure 58: Middle East and Africa Phenol Market Volume Share (%), by Product Type 2024 & 2032
- Figure 59: Middle East and Africa Phenol Market Revenue (Billion), by Country 2024 & 2032
- Figure 60: Middle East and Africa Phenol Market Volume (K Tons), by Country 2024 & 2032
- Figure 61: Middle East and Africa Phenol Market Revenue Share (%), by Country 2024 & 2032
- Figure 62: Middle East and Africa Phenol Market Volume Share (%), by Country 2024 & 2032
List of Tables
- Table 1: Global Phenol Market Revenue Billion Forecast, by Region 2019 & 2032
- Table 2: Global Phenol Market Volume K Tons Forecast, by Region 2019 & 2032
- Table 3: Global Phenol Market Revenue Billion Forecast, by Product Type 2019 & 2032
- Table 4: Global Phenol Market Volume K Tons Forecast, by Product Type 2019 & 2032
- Table 5: Global Phenol Market Revenue Billion Forecast, by Region 2019 & 2032
- Table 6: Global Phenol Market Volume K Tons Forecast, by Region 2019 & 2032
- Table 7: Global Phenol Market Revenue Billion Forecast, by Country 2019 & 2032
- Table 8: Global Phenol Market Volume K Tons Forecast, by Country 2019 & 2032
- Table 9: United States Phenol Market Revenue (Billion) Forecast, by Application 2019 & 2032
- Table 10: United States Phenol Market Volume (K Tons) Forecast, by Application 2019 & 2032
- Table 11: Canada Phenol Market Revenue (Billion) Forecast, by Application 2019 & 2032
- Table 12: Canada Phenol Market Volume (K Tons) Forecast, by Application 2019 & 2032
- Table 13: Mexico Phenol Market Revenue (Billion) Forecast, by Application 2019 & 2032
- Table 14: Mexico Phenol Market Volume (K Tons) Forecast, by Application 2019 & 2032
- Table 15: Global Phenol Market Revenue Billion Forecast, by Country 2019 & 2032
- Table 16: Global Phenol Market Volume K Tons Forecast, by Country 2019 & 2032
- Table 17: Germany Phenol Market Revenue (Billion) Forecast, by Application 2019 & 2032
- Table 18: Germany Phenol Market Volume (K Tons) Forecast, by Application 2019 & 2032
- Table 19: France Phenol Market Revenue (Billion) Forecast, by Application 2019 & 2032
- Table 20: France Phenol Market Volume (K Tons) Forecast, by Application 2019 & 2032
- Table 21: Italy Phenol Market Revenue (Billion) Forecast, by Application 2019 & 2032
- Table 22: Italy Phenol Market Volume (K Tons) Forecast, by Application 2019 & 2032
- Table 23: United Kingdom Phenol Market Revenue (Billion) Forecast, by Application 2019 & 2032
- Table 24: United Kingdom Phenol Market Volume (K Tons) Forecast, by Application 2019 & 2032
- Table 25: Netherlands Phenol Market Revenue (Billion) Forecast, by Application 2019 & 2032
- Table 26: Netherlands Phenol Market Volume (K Tons) Forecast, by Application 2019 & 2032
- Table 27: Rest of Europe Phenol Market Revenue (Billion) Forecast, by Application 2019 & 2032
- Table 28: Rest of Europe Phenol Market Volume (K Tons) Forecast, by Application 2019 & 2032
- Table 29: Global Phenol Market Revenue Billion Forecast, by Country 2019 & 2032
- Table 30: Global Phenol Market Volume K Tons Forecast, by Country 2019 & 2032
- Table 31: China Phenol Market Revenue (Billion) Forecast, by Application 2019 & 2032
- Table 32: China Phenol Market Volume (K Tons) Forecast, by Application 2019 & 2032
- Table 33: Japan Phenol Market Revenue (Billion) Forecast, by Application 2019 & 2032
- Table 34: Japan Phenol Market Volume (K Tons) Forecast, by Application 2019 & 2032
- Table 35: India Phenol Market Revenue (Billion) Forecast, by Application 2019 & 2032
- Table 36: India Phenol Market Volume (K Tons) Forecast, by Application 2019 & 2032
- Table 37: South Korea Phenol Market Revenue (Billion) Forecast, by Application 2019 & 2032
- Table 38: South Korea Phenol Market Volume (K Tons) Forecast, by Application 2019 & 2032
- Table 39: Taiwan Phenol Market Revenue (Billion) Forecast, by Application 2019 & 2032
- Table 40: Taiwan Phenol Market Volume (K Tons) Forecast, by Application 2019 & 2032
- Table 41: Australia Phenol Market Revenue (Billion) Forecast, by Application 2019 & 2032
- Table 42: Australia Phenol Market Volume (K Tons) Forecast, by Application 2019 & 2032
- Table 43: Rest of Asia-Pacific Phenol Market Revenue (Billion) Forecast, by Application 2019 & 2032
- Table 44: Rest of Asia-Pacific Phenol Market Volume (K Tons) Forecast, by Application 2019 & 2032
- Table 45: Global Phenol Market Revenue Billion Forecast, by Country 2019 & 2032
- Table 46: Global Phenol Market Volume K Tons Forecast, by Country 2019 & 2032
- Table 47: Brazil Phenol Market Revenue (Billion) Forecast, by Application 2019 & 2032
- Table 48: Brazil Phenol Market Volume (K Tons) Forecast, by Application 2019 & 2032
- Table 49: Argentina Phenol Market Revenue (Billion) Forecast, by Application 2019 & 2032
- Table 50: Argentina Phenol Market Volume (K Tons) Forecast, by Application 2019 & 2032
- Table 51: Rest of South America Phenol Market Revenue (Billion) Forecast, by Application 2019 & 2032
- Table 52: Rest of South America Phenol Market Volume (K Tons) Forecast, by Application 2019 & 2032
- Table 53: Global Phenol Market Revenue Billion Forecast, by Country 2019 & 2032
- Table 54: Global Phenol Market Volume K Tons Forecast, by Country 2019 & 2032
- Table 55: Middle East Phenol Market Revenue (Billion) Forecast, by Application 2019 & 2032
- Table 56: Middle East Phenol Market Volume (K Tons) Forecast, by Application 2019 & 2032
- Table 57: Africa Phenol Market Revenue (Billion) Forecast, by Application 2019 & 2032
- Table 58: Africa Phenol Market Volume (K Tons) Forecast, by Application 2019 & 2032
- Table 59: Global Phenol Market Revenue Billion Forecast, by Product Type 2019 & 2032
- Table 60: Global Phenol Market Volume K Tons Forecast, by Product Type 2019 & 2032
- Table 61: Global Phenol Market Revenue Billion Forecast, by Country 2019 & 2032
- Table 62: Global Phenol Market Volume K Tons Forecast, by Country 2019 & 2032
- Table 63: China Phenol Market Revenue (Billion) Forecast, by Application 2019 & 2032
- Table 64: China Phenol Market Volume (K Tons) Forecast, by Application 2019 & 2032
- Table 65: India Phenol Market Revenue (Billion) Forecast, by Application 2019 & 2032
- Table 66: India Phenol Market Volume (K Tons) Forecast, by Application 2019 & 2032
- Table 67: Japan Phenol Market Revenue (Billion) Forecast, by Application 2019 & 2032
- Table 68: Japan Phenol Market Volume (K Tons) Forecast, by Application 2019 & 2032
- Table 69: South Korea Phenol Market Revenue (Billion) Forecast, by Application 2019 & 2032
- Table 70: South Korea Phenol Market Volume (K Tons) Forecast, by Application 2019 & 2032
- Table 71: Rest of Asia Pacific Phenol Market Revenue (Billion) Forecast, by Application 2019 & 2032
- Table 72: Rest of Asia Pacific Phenol Market Volume (K Tons) Forecast, by Application 2019 & 2032
- Table 73: Global Phenol Market Revenue Billion Forecast, by Product Type 2019 & 2032
- Table 74: Global Phenol Market Volume K Tons Forecast, by Product Type 2019 & 2032
- Table 75: Global Phenol Market Revenue Billion Forecast, by Country 2019 & 2032
- Table 76: Global Phenol Market Volume K Tons Forecast, by Country 2019 & 2032
- Table 77: United States Phenol Market Revenue (Billion) Forecast, by Application 2019 & 2032
- Table 78: United States Phenol Market Volume (K Tons) Forecast, by Application 2019 & 2032
- Table 79: Canada Phenol Market Revenue (Billion) Forecast, by Application 2019 & 2032
- Table 80: Canada Phenol Market Volume (K Tons) Forecast, by Application 2019 & 2032
- Table 81: Mexico Phenol Market Revenue (Billion) Forecast, by Application 2019 & 2032
- Table 82: Mexico Phenol Market Volume (K Tons) Forecast, by Application 2019 & 2032
- Table 83: Global Phenol Market Revenue Billion Forecast, by Product Type 2019 & 2032
- Table 84: Global Phenol Market Volume K Tons Forecast, by Product Type 2019 & 2032
- Table 85: Global Phenol Market Revenue Billion Forecast, by Country 2019 & 2032
- Table 86: Global Phenol Market Volume K Tons Forecast, by Country 2019 & 2032
- Table 87: Germany Phenol Market Revenue (Billion) Forecast, by Application 2019 & 2032
- Table 88: Germany Phenol Market Volume (K Tons) Forecast, by Application 2019 & 2032
- Table 89: United Kingdom Phenol Market Revenue (Billion) Forecast, by Application 2019 & 2032
- Table 90: United Kingdom Phenol Market Volume (K Tons) Forecast, by Application 2019 & 2032
- Table 91: France Phenol Market Revenue (Billion) Forecast, by Application 2019 & 2032
- Table 92: France Phenol Market Volume (K Tons) Forecast, by Application 2019 & 2032
- Table 93: Italy Phenol Market Revenue (Billion) Forecast, by Application 2019 & 2032
- Table 94: Italy Phenol Market Volume (K Tons) Forecast, by Application 2019 & 2032
- Table 95: Rest of Europe Phenol Market Revenue (Billion) Forecast, by Application 2019 & 2032
- Table 96: Rest of Europe Phenol Market Volume (K Tons) Forecast, by Application 2019 & 2032
- Table 97: Global Phenol Market Revenue Billion Forecast, by Product Type 2019 & 2032
- Table 98: Global Phenol Market Volume K Tons Forecast, by Product Type 2019 & 2032
- Table 99: Global Phenol Market Revenue Billion Forecast, by Country 2019 & 2032
- Table 100: Global Phenol Market Volume K Tons Forecast, by Country 2019 & 2032
- Table 101: Brazil Phenol Market Revenue (Billion) Forecast, by Application 2019 & 2032
- Table 102: Brazil Phenol Market Volume (K Tons) Forecast, by Application 2019 & 2032
- Table 103: Argentina Phenol Market Revenue (Billion) Forecast, by Application 2019 & 2032
- Table 104: Argentina Phenol Market Volume (K Tons) Forecast, by Application 2019 & 2032
- Table 105: Rest of South America Phenol Market Revenue (Billion) Forecast, by Application 2019 & 2032
- Table 106: Rest of South America Phenol Market Volume (K Tons) Forecast, by Application 2019 & 2032
- Table 107: Global Phenol Market Revenue Billion Forecast, by Product Type 2019 & 2032
- Table 108: Global Phenol Market Volume K Tons Forecast, by Product Type 2019 & 2032
- Table 109: Global Phenol Market Revenue Billion Forecast, by Country 2019 & 2032
- Table 110: Global Phenol Market Volume K Tons Forecast, by Country 2019 & 2032
- Table 111: Saudi Arabia Phenol Market Revenue (Billion) Forecast, by Application 2019 & 2032
- Table 112: Saudi Arabia Phenol Market Volume (K Tons) Forecast, by Application 2019 & 2032
- Table 113: South Africa Phenol Market Revenue (Billion) Forecast, by Application 2019 & 2032
- Table 114: South Africa Phenol Market Volume (K Tons) Forecast, by Application 2019 & 2032
- Table 115: Rest of Middle East and Africa Phenol Market Revenue (Billion) Forecast, by Application 2019 & 2032
- Table 116: Rest of Middle East and Africa Phenol Market Volume (K Tons) Forecast, by Application 2019 & 2032
Frequently Asked Questions
1. What is the projected Compound Annual Growth Rate (CAGR) of the Phenol Market?
The projected CAGR is approximately 4.9%.
2. Which companies are prominent players in the Phenol Market?
Key companies in the market include Shell PLC, Solvay, AdvanSix Inc, Mitsui Chemicals Inc, Mitsubishi Chemical Corporation, Cepsa, Altivia, Domo Chemical GmbH, PTT Phenol Company Limited, Formosa Chemicals & Fibre Corp, INEOS Capital Limited, Kumho P&B Chemicals Inc.
3. What are the main segments of the Phenol Market?
The market segments include Product Type.
4. Can you provide details about the market size?
The market size is estimated to be USD 24.3 Billion as of 2022.
5. What are some drivers contributing to market growth?
High Demand of Bisphenol-A; Other Drivers.
6. What are the notable trends driving market growth?
Bisphenol-A Product Type to Drive the Market.
7. Are there any restraints impacting market growth?
Ban on BPA in the United States and Europe; Others Restraints.
8. Can you provide examples of recent developments in the market?
August 2022: INEOS Phenol announced the acquisition of the asset base of Mitsui Phenols Singapore Ltd from Mitsui Chemicals for a total consideration of USD 330 million. The addition of the Jurong phenol and BPA assets will provide integration opportunities with manufacturing sites in Germany, Belgium, and the United States. The acquisition will increase the total production capacity by 1 million tonnes.
9. What pricing options are available for accessing the report?
Pricing options include single-user, multi-user, and enterprise licenses priced at USD 4750, USD 5250, and USD 8750 respectively.
10. Is the market size provided in terms of value or volume?
The market size is provided in terms of value, measured in Billion and volume, measured in K Tons.
11. Are there any specific market keywords associated with the report?
Yes, the market keyword associated with the report is "Phenol Market," which aids in identifying and referencing the specific market segment covered.
12. How do I determine which pricing option suits my needs best?
The pricing options vary based on user requirements and access needs. Individual users may opt for single-user licenses, while businesses requiring broader access may choose multi-user or enterprise licenses for cost-effective access to the report.
13. Are there any additional resources or data provided in the Phenol Market report?
While the report offers comprehensive insights, it's advisable to review the specific contents or supplementary materials provided to ascertain if additional resources or data are available.
14. How can I stay updated on further developments or reports in the Phenol Market?
To stay informed about further developments, trends, and reports in the Phenol Market, consider subscribing to industry newsletters, following relevant companies and organizations, or regularly checking reputable industry news sources and publications.
Methodology
Step 1 - Identification of Relevant Samples Size from Population Database


Step 2 - Approaches for Defining Global Market Size (Value, Volume* & Price*)

Note*: In applicable scenarios
Step 3 - Data Sources
Primary Research
- Web Analytics
- Survey Reports
- Research Institute
- Latest Research Reports
- Opinion Leaders
Secondary Research
- Annual Reports
- White Paper
- Latest Press Release
- Industry Association
- Paid Database
- Investor Presentations

Step 4 - Data Triangulation
Involves using different sources of information in order to increase the validity of a study
These sources are likely to be stakeholders in a program - participants, other researchers, program staff, other community members, and so on.
Then we put all data in single framework & apply various statistical tools to find out the dynamic on the market.
During the analysis stage, feedback from the stakeholder groups would be compared to determine areas of agreement as well as areas of divergence


