
Key Insights
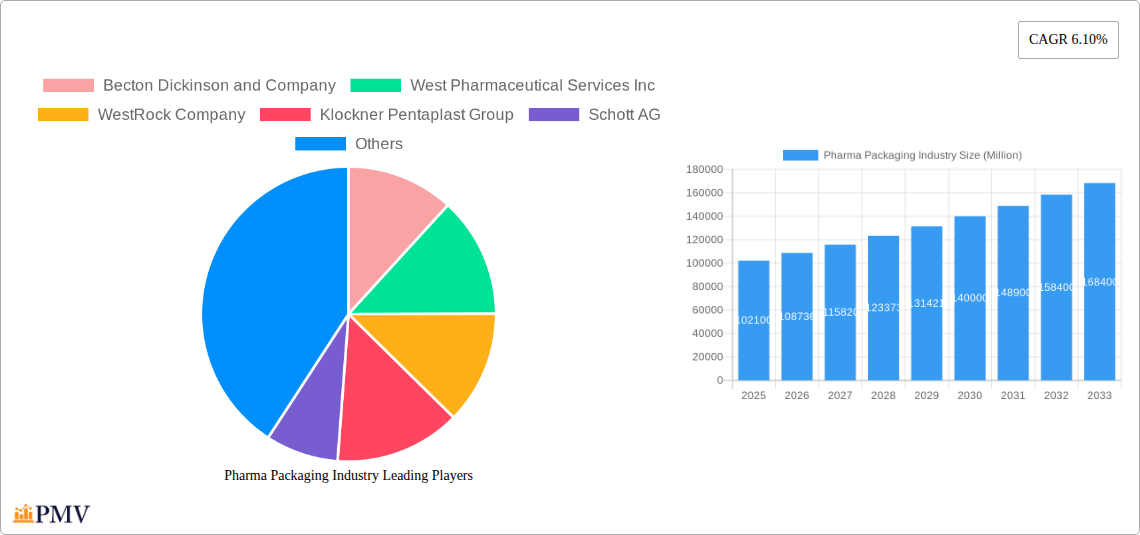
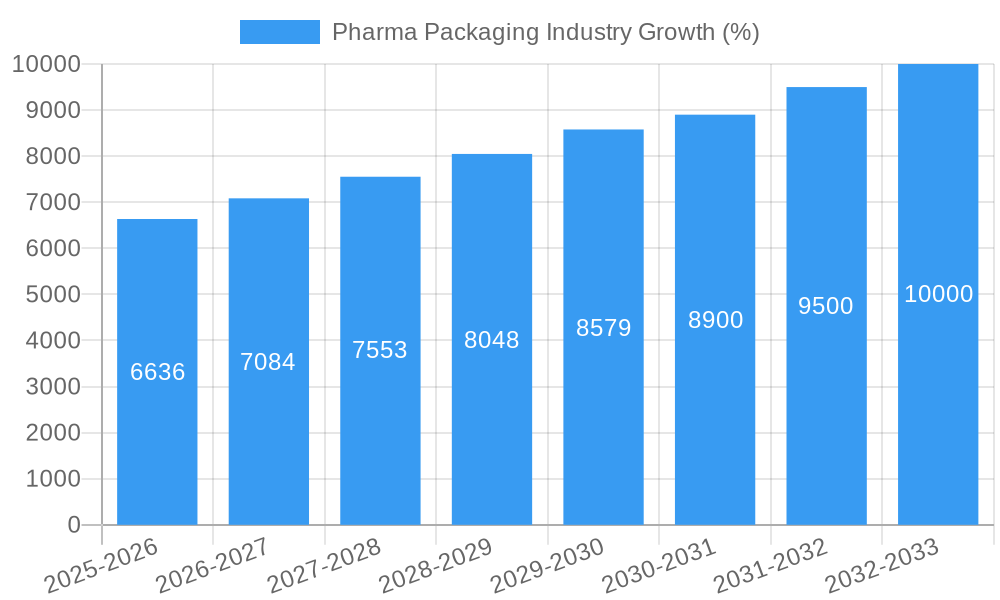
The pharmaceutical packaging market, valued at $102.10 billion in 2025, is projected to experience robust growth, driven by a compound annual growth rate (CAGR) of 6.10% from 2025 to 2033. This expansion is fueled by several key factors. The increasing prevalence of chronic diseases globally necessitates larger volumes of pharmaceutical products, directly impacting packaging demand. Furthermore, stringent regulatory requirements regarding drug safety and efficacy are pushing manufacturers to adopt advanced packaging solutions, such as tamper-evident seals and innovative materials designed to enhance drug stability and shelf life. The rise of personalized medicine and biologics also contributes to market growth, as these require specialized packaging to maintain product integrity and efficacy. Growth is further supported by the expansion of the pharmaceutical industry in emerging economies, particularly in Asia-Pacific, where rising disposable incomes and improving healthcare infrastructure are creating substantial demand. Competition within the industry is fierce, with key players such as Becton Dickinson, West Pharmaceutical Services, and Amcor continuously innovating to capture market share.
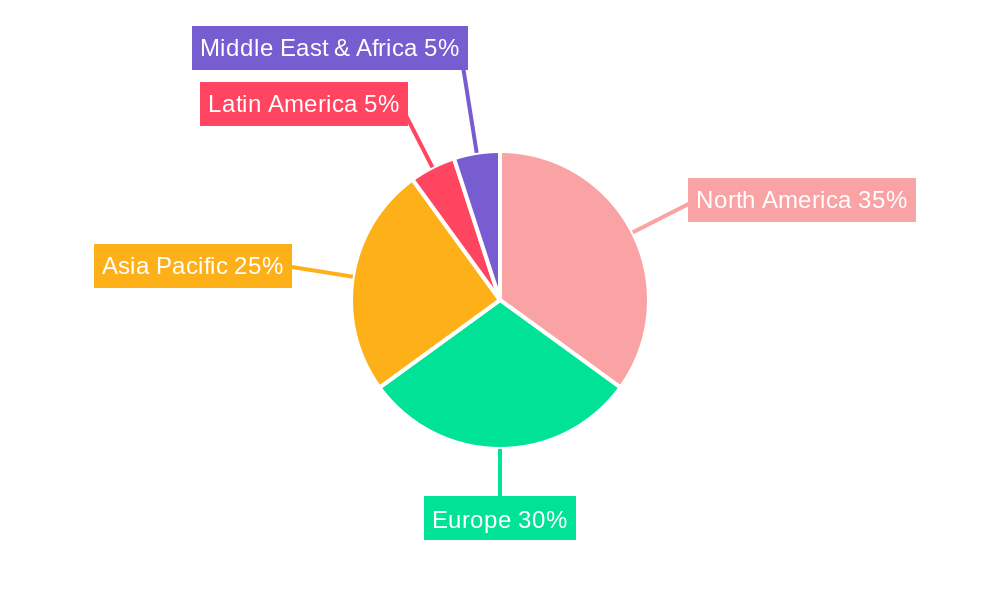
Segmentation analysis reveals significant opportunities within specific product types. Bottles, syringes, and vials remain dominant, while the demand for specialized containers like ampoules and tubes is also experiencing considerable growth due to the increased use of injectable drugs and specialized formulations. The material segment is characterized by the extensive use of plastics due to their cost-effectiveness and versatility, though glass retains significance for certain applications where sterility and inertness are critical. The adoption of sustainable and eco-friendly packaging materials is an emerging trend, prompting the development of biodegradable and recyclable alternatives to traditional plastics. This shift is driven by growing environmental concerns and increasing regulatory pressure. Regional analysis shows North America and Europe currently hold significant market shares, but the Asia-Pacific region is anticipated to witness the fastest growth rate in the coming years, driven by factors outlined above. The overall market outlook for pharmaceutical packaging remains positive, with continued expansion expected throughout the forecast period.
This comprehensive report provides a detailed analysis of the global pharma packaging industry, encompassing market size, growth drivers, competitive landscape, and future outlook. The study period covers 2019-2033, with a base year of 2025 and a forecast period of 2025-2033. Valuations are in millions of USD. This report is invaluable for pharmaceutical companies, packaging manufacturers, investors, and industry stakeholders seeking to navigate this dynamic market.
Pharma Packaging Industry Market Structure & Competitive Dynamics
The pharma packaging market is characterized by a moderately concentrated structure with several major players dominating significant market shares. The industry exhibits strong innovation ecosystems, driven by the constant need for improved drug delivery systems and enhanced product protection. Stringent regulatory frameworks, including those set by the FDA and EMA, significantly impact product development and market access. The industry faces competition from substitute materials and packaging types, prompting continuous innovation in materials science and packaging design. End-user trends, such as increased demand for convenient and user-friendly packaging formats, are shaping the market landscape. Significant M&A activity, as seen in Amcor's acquisition of MDK (USD 50 million), underscores the consolidation trends in the sector. Market share data for key players (Becton Dickinson and Company, West Pharmaceutical Services Inc, WestRock Company, etc.) are detailed within the full report, along with a detailed analysis of M&A activities and deal values during the study period.
- Market Concentration: Moderate, with several dominant players.
- Innovation Ecosystems: Strong, driven by advancements in materials science and drug delivery.
- Regulatory Frameworks: Stringent, impacting product development and market access.
- Product Substitutes: Present, necessitating continuous innovation.
- End-User Trends: Demand for convenience and user-friendliness is influencing packaging design.
- M&A Activities: Significant, indicating market consolidation.
Pharma Packaging Industry Industry Trends & Insights
The global pharma packaging market is experiencing robust growth, driven by the increasing demand for pharmaceuticals globally and the expanding focus on advanced drug delivery systems. The CAGR for the period 2025-2033 is estimated at xx%. Technological disruptions, such as the adoption of smart packaging and serialization technologies, are transforming the industry. Consumer preferences for sustainable and eco-friendly packaging solutions are also influencing product development. The competitive dynamics are characterized by intense rivalry among established players and the emergence of new entrants, leading to innovation and price competition. Market penetration of sustainable packaging materials is projected to increase by xx% over the forecast period.
Dominant Markets & Segments in Pharma Packaging Industry
The North American and European markets currently dominate the pharma packaging landscape, driven by factors such as robust healthcare infrastructure, advanced regulatory frameworks, and high per capita pharmaceutical consumption. However, the Asia-Pacific region is witnessing significant growth, fueled by rising disposable incomes, growing healthcare spending, and increasing prevalence of chronic diseases.
By Material:
- Plastics: High market share due to versatility, cost-effectiveness, and ease of processing. Key drivers include advancements in barrier properties and sustainable plastic solutions.
- Glass: Maintains a strong presence, particularly for injectable drugs, owing to its inertness and barrier properties. Growth is driven by innovations in glass manufacturing and designs.
- Other Materials: This segment, including metals and composites, holds a smaller market share but is experiencing growth driven by niche applications demanding specific properties.
By Product Type:
- Bottles: Large market share due to widespread use for oral and liquid pharmaceuticals. Growth is driven by innovations in bottle design and materials.
- Syringes, Vials, and Ampoules: Significant market share driven by the high demand for injectable drugs. Growth is driven by innovations in pre-filled syringes and advanced injection systems.
- Tubes: Moderate market share, used extensively for creams, ointments, and other semi-solid dosage forms. Growth is driven by innovations in flexible packaging materials and designs.
- Caps and Closures: High market share due to the indispensable role in ensuring product safety and tamper evidence. Growth is driven by innovations in closure designs and child-resistant packaging.
- Labels: Significant market share due to the essential role in providing information and branding. Growth is driven by innovations in digital printing and smart labels.
- Other Product Types: This segment comprises other packaging types, such as blister packs and pouches, which hold a moderate market share. Growth is driven by evolving pharmaceutical needs and packaging preferences.
Pharma Packaging Industry Product Innovations
The pharma packaging industry is witnessing a surge in product innovations, focusing on improving drug stability, patient convenience, and supply chain efficiency. Recent innovations include the adoption of smart packaging incorporating sensors and tracking technologies, enhanced barrier materials to extend shelf life, and sustainable alternatives to traditional packaging materials. These innovations are significantly enhancing product safety and security, as well as patient adherence.
Report Segmentation & Scope
The report provides detailed segmentation of the pharma packaging market by material (plastics, glass, other materials) and product type (bottles, syringes, vials and ampoules, tubes, caps and closures, labels, other product types). Each segment’s growth projections, market sizes, and competitive dynamics are comprehensively analyzed. Market sizing, projections, and competitive dynamics for each segment are provided within the full report.
Key Drivers of Pharma Packaging Industry Growth
Several factors are driving the growth of the pharma packaging industry. These include the increasing global demand for pharmaceuticals, advancements in drug delivery systems demanding innovative packaging solutions, stringent regulatory requirements necessitating advanced packaging technologies, and the growing focus on sustainable and eco-friendly packaging options. Economic growth in emerging markets and expansion in the pharmaceutical sector further fuel this expansion.
Challenges in the Pharma Packaging Industry Sector
The pharma packaging industry faces several challenges, including stringent regulatory compliance, fluctuations in raw material prices, increasing demand for sustainable packaging, supply chain disruptions, counterfeiting concerns, and intense competition. These factors necessitate continuous adaptation and innovation within the industry. The global pandemic further exposed vulnerabilities in supply chains, resulting in estimated xx million USD in losses across the industry.
Leading Players in the Pharma Packaging Industry Market
- Becton Dickinson and Company
- West Pharmaceutical Services Inc
- WestRock Company
- Klockner Pentaplast Group
- Schott AG
- Nipro Corporation
- W L Gore & Associates Inc
- AptarGroup Inc
- Berry Global Group Inc
- 3M Company
- Vetter Pharma International GmbH
- Amcor PLC
- CCL Industries Inc
- FlexiTuff International Ltd
- Catalent Inc
- McKesson Corporation
- Gerresheimer AG
Key Developments in Pharma Packaging Industry Sector
- June 2022: Catalent announced the installation of a high-speed blister packaging line in Shiga, Japan, enhancing its clinical supply capabilities and global access for customers.
- January 2023: Amcor acquired MDK, a Shanghai-based medical device packaging leader, for approximately USD 50 million, strengthening its Asia-Pacific healthcare platform.
Strategic Pharma Packaging Industry Market Outlook
The pharma packaging market is poised for continued growth, driven by ongoing innovation in materials science, drug delivery technologies, and increasing demand for sustainable packaging solutions. Strategic opportunities lie in developing advanced barrier packaging, incorporating smart technologies, and expanding into emerging markets. The focus on patient-centric design and improved supply chain resilience will be crucial for future success in this dynamic market.
Pharma Packaging Industry Segmentation
-
1. Material
- 1.1. Plastics
- 1.2. Glass
- 1.3. Other Materials
-
2. Product Type
- 2.1. Bottles
- 2.2. Syringes
- 2.3. Vials and Ampoules
- 2.4. Tubes
- 2.5. Caps and Closures
- 2.6. Labels
- 2.7. Other Product Types
Pharma Packaging Industry Segmentation By Geography
-
1. North America
- 1.1. United States
- 1.2. Canada
-
2. Europe
- 2.1. Germany
- 2.2. United Kingdom
- 2.3. France
- 2.4. Italy
- 2.5. Spain
- 2.6. Rest of Europe
-
3. Asia Pacific
- 3.1. China
- 3.2. Japan
- 3.3. India
- 3.4. South Korea
- 3.5. Rest of Asia Pacific
-
4. Latin America
- 4.1. Brazil
- 4.2. Mexico
- 4.3. Rest of Latin America
-
5. Middle East and Africa
- 5.1. United Arab Emirates
- 5.2. Saudi Arabia
- 5.3. South Africa
- 5.4. Rest of Middle East and Africa
Pharma Packaging Industry REPORT HIGHLIGHTS
| Aspects | Details |
|---|---|
| Study Period | 2019-2033 |
| Base Year | 2024 |
| Estimated Year | 2025 |
| Forecast Period | 2025-2033 |
| Historical Period | 2019-2024 |
| Growth Rate | CAGR of 6.10% from 2019-2033 |
| Segmentation |
|
Table of Contents
- 1. Introduction
- 1.1. Research Scope
- 1.2. Market Segmentation
- 1.3. Research Methodology
- 1.4. Definitions and Assumptions
- 2. Executive Summary
- 2.1. Introduction
- 3. Market Dynamics
- 3.1. Introduction
- 3.2. Market Drivers
- 3.2.1. Regulatory Standards on Packaging and Stringent Norms against Counterfeit Products; Impact of Nanotechnology due to Innovative and New- generation Packaging Solutions
- 3.3. Market Restrains
- 3.3.1. Stringent Government Regulations in Developed Countries
- 3.4. Market Trends
- 3.4.1. Plastic Packaging Holds a Significant Market Share
- 4. Market Factor Analysis
- 4.1. Porters Five Forces
- 4.2. Supply/Value Chain
- 4.3. PESTEL analysis
- 4.4. Market Entropy
- 4.5. Patent/Trademark Analysis
- 5. Global Pharma Packaging Industry Analysis, Insights and Forecast, 2019-2031
- 5.1. Market Analysis, Insights and Forecast - by Material
- 5.1.1. Plastics
- 5.1.2. Glass
- 5.1.3. Other Materials
- 5.2. Market Analysis, Insights and Forecast - by Product Type
- 5.2.1. Bottles
- 5.2.2. Syringes
- 5.2.3. Vials and Ampoules
- 5.2.4. Tubes
- 5.2.5. Caps and Closures
- 5.2.6. Labels
- 5.2.7. Other Product Types
- 5.3. Market Analysis, Insights and Forecast - by Region
- 5.3.1. North America
- 5.3.2. Europe
- 5.3.3. Asia Pacific
- 5.3.4. Latin America
- 5.3.5. Middle East and Africa
- 5.1. Market Analysis, Insights and Forecast - by Material
- 6. North America Pharma Packaging Industry Analysis, Insights and Forecast, 2019-2031
- 6.1. Market Analysis, Insights and Forecast - by Material
- 6.1.1. Plastics
- 6.1.2. Glass
- 6.1.3. Other Materials
- 6.2. Market Analysis, Insights and Forecast - by Product Type
- 6.2.1. Bottles
- 6.2.2. Syringes
- 6.2.3. Vials and Ampoules
- 6.2.4. Tubes
- 6.2.5. Caps and Closures
- 6.2.6. Labels
- 6.2.7. Other Product Types
- 6.1. Market Analysis, Insights and Forecast - by Material
- 7. Europe Pharma Packaging Industry Analysis, Insights and Forecast, 2019-2031
- 7.1. Market Analysis, Insights and Forecast - by Material
- 7.1.1. Plastics
- 7.1.2. Glass
- 7.1.3. Other Materials
- 7.2. Market Analysis, Insights and Forecast - by Product Type
- 7.2.1. Bottles
- 7.2.2. Syringes
- 7.2.3. Vials and Ampoules
- 7.2.4. Tubes
- 7.2.5. Caps and Closures
- 7.2.6. Labels
- 7.2.7. Other Product Types
- 7.1. Market Analysis, Insights and Forecast - by Material
- 8. Asia Pacific Pharma Packaging Industry Analysis, Insights and Forecast, 2019-2031
- 8.1. Market Analysis, Insights and Forecast - by Material
- 8.1.1. Plastics
- 8.1.2. Glass
- 8.1.3. Other Materials
- 8.2. Market Analysis, Insights and Forecast - by Product Type
- 8.2.1. Bottles
- 8.2.2. Syringes
- 8.2.3. Vials and Ampoules
- 8.2.4. Tubes
- 8.2.5. Caps and Closures
- 8.2.6. Labels
- 8.2.7. Other Product Types
- 8.1. Market Analysis, Insights and Forecast - by Material
- 9. Latin America Pharma Packaging Industry Analysis, Insights and Forecast, 2019-2031
- 9.1. Market Analysis, Insights and Forecast - by Material
- 9.1.1. Plastics
- 9.1.2. Glass
- 9.1.3. Other Materials
- 9.2. Market Analysis, Insights and Forecast - by Product Type
- 9.2.1. Bottles
- 9.2.2. Syringes
- 9.2.3. Vials and Ampoules
- 9.2.4. Tubes
- 9.2.5. Caps and Closures
- 9.2.6. Labels
- 9.2.7. Other Product Types
- 9.1. Market Analysis, Insights and Forecast - by Material
- 10. Middle East and Africa Pharma Packaging Industry Analysis, Insights and Forecast, 2019-2031
- 10.1. Market Analysis, Insights and Forecast - by Material
- 10.1.1. Plastics
- 10.1.2. Glass
- 10.1.3. Other Materials
- 10.2. Market Analysis, Insights and Forecast - by Product Type
- 10.2.1. Bottles
- 10.2.2. Syringes
- 10.2.3. Vials and Ampoules
- 10.2.4. Tubes
- 10.2.5. Caps and Closures
- 10.2.6. Labels
- 10.2.7. Other Product Types
- 10.1. Market Analysis, Insights and Forecast - by Material
- 11. North America Pharma Packaging Industry Analysis, Insights and Forecast, 2019-2031
- 11.1. Market Analysis, Insights and Forecast - By Country/Sub-region
- 11.1.1 United States
- 11.1.2 Canada
- 12. Europe Pharma Packaging Industry Analysis, Insights and Forecast, 2019-2031
- 12.1. Market Analysis, Insights and Forecast - By Country/Sub-region
- 12.1.1 Germany
- 12.1.2 United Kingdom
- 12.1.3 France
- 12.1.4 Italy
- 12.1.5 Spain
- 12.1.6 Rest of Europe
- 13. Asia Pacific Pharma Packaging Industry Analysis, Insights and Forecast, 2019-2031
- 13.1. Market Analysis, Insights and Forecast - By Country/Sub-region
- 13.1.1 China
- 13.1.2 Japan
- 13.1.3 India
- 13.1.4 South Korea
- 13.1.5 Rest of Asia Pacific
- 14. Latin America Pharma Packaging Industry Analysis, Insights and Forecast, 2019-2031
- 14.1. Market Analysis, Insights and Forecast - By Country/Sub-region
- 14.1.1 Brazil
- 14.1.2 Mexico
- 14.1.3 Rest of Latin America
- 15. Middle East Pharma Packaging Industry Analysis, Insights and Forecast, 2019-2031
- 15.1. Market Analysis, Insights and Forecast - By Country/Sub-region
- 15.1.1.
- 16. United Arab Emirates Pharma Packaging Industry Analysis, Insights and Forecast, 2019-2031
- 16.1. Market Analysis, Insights and Forecast - By Country/Sub-region
- 16.1.1 Saudi Arabia
- 16.1.2 South Africa
- 16.1.3 Rest of Middle East
- 17. Competitive Analysis
- 17.1. Global Market Share Analysis 2024
- 17.2. Company Profiles
- 17.2.1 Becton Dickinson and Company
- 17.2.1.1. Overview
- 17.2.1.2. Products
- 17.2.1.3. SWOT Analysis
- 17.2.1.4. Recent Developments
- 17.2.1.5. Financials (Based on Availability)
- 17.2.2 West Pharmaceutical Services Inc
- 17.2.2.1. Overview
- 17.2.2.2. Products
- 17.2.2.3. SWOT Analysis
- 17.2.2.4. Recent Developments
- 17.2.2.5. Financials (Based on Availability)
- 17.2.3 WestRock Company
- 17.2.3.1. Overview
- 17.2.3.2. Products
- 17.2.3.3. SWOT Analysis
- 17.2.3.4. Recent Developments
- 17.2.3.5. Financials (Based on Availability)
- 17.2.4 Klockner Pentaplast Group
- 17.2.4.1. Overview
- 17.2.4.2. Products
- 17.2.4.3. SWOT Analysis
- 17.2.4.4. Recent Developments
- 17.2.4.5. Financials (Based on Availability)
- 17.2.5 Schott AG
- 17.2.5.1. Overview
- 17.2.5.2. Products
- 17.2.5.3. SWOT Analysis
- 17.2.5.4. Recent Developments
- 17.2.5.5. Financials (Based on Availability)
- 17.2.6 Nipro Corporation*List Not Exhaustive
- 17.2.6.1. Overview
- 17.2.6.2. Products
- 17.2.6.3. SWOT Analysis
- 17.2.6.4. Recent Developments
- 17.2.6.5. Financials (Based on Availability)
- 17.2.7 W L Gore & Associates Inc
- 17.2.7.1. Overview
- 17.2.7.2. Products
- 17.2.7.3. SWOT Analysis
- 17.2.7.4. Recent Developments
- 17.2.7.5. Financials (Based on Availability)
- 17.2.8 AptarGroup Inc
- 17.2.8.1. Overview
- 17.2.8.2. Products
- 17.2.8.3. SWOT Analysis
- 17.2.8.4. Recent Developments
- 17.2.8.5. Financials (Based on Availability)
- 17.2.9 Berry Global Group Inc
- 17.2.9.1. Overview
- 17.2.9.2. Products
- 17.2.9.3. SWOT Analysis
- 17.2.9.4. Recent Developments
- 17.2.9.5. Financials (Based on Availability)
- 17.2.10 3M Company
- 17.2.10.1. Overview
- 17.2.10.2. Products
- 17.2.10.3. SWOT Analysis
- 17.2.10.4. Recent Developments
- 17.2.10.5. Financials (Based on Availability)
- 17.2.11 Vetter Pharma International GmbH
- 17.2.11.1. Overview
- 17.2.11.2. Products
- 17.2.11.3. SWOT Analysis
- 17.2.11.4. Recent Developments
- 17.2.11.5. Financials (Based on Availability)
- 17.2.12 Amcor PLC
- 17.2.12.1. Overview
- 17.2.12.2. Products
- 17.2.12.3. SWOT Analysis
- 17.2.12.4. Recent Developments
- 17.2.12.5. Financials (Based on Availability)
- 17.2.13 CCL Industries Inc
- 17.2.13.1. Overview
- 17.2.13.2. Products
- 17.2.13.3. SWOT Analysis
- 17.2.13.4. Recent Developments
- 17.2.13.5. Financials (Based on Availability)
- 17.2.14 FlexiTuff International Ltd
- 17.2.14.1. Overview
- 17.2.14.2. Products
- 17.2.14.3. SWOT Analysis
- 17.2.14.4. Recent Developments
- 17.2.14.5. Financials (Based on Availability)
- 17.2.15 Catalent Inc
- 17.2.15.1. Overview
- 17.2.15.2. Products
- 17.2.15.3. SWOT Analysis
- 17.2.15.4. Recent Developments
- 17.2.15.5. Financials (Based on Availability)
- 17.2.16 McKesson Corporation
- 17.2.16.1. Overview
- 17.2.16.2. Products
- 17.2.16.3. SWOT Analysis
- 17.2.16.4. Recent Developments
- 17.2.16.5. Financials (Based on Availability)
- 17.2.17 Gerresheimer AG
- 17.2.17.1. Overview
- 17.2.17.2. Products
- 17.2.17.3. SWOT Analysis
- 17.2.17.4. Recent Developments
- 17.2.17.5. Financials (Based on Availability)
- 17.2.1 Becton Dickinson and Company
List of Figures
- Figure 1: Global Pharma Packaging Industry Revenue Breakdown (Million, %) by Region 2024 & 2032
- Figure 2: North America Pharma Packaging Industry Revenue (Million), by Country 2024 & 2032
- Figure 3: North America Pharma Packaging Industry Revenue Share (%), by Country 2024 & 2032
- Figure 4: Europe Pharma Packaging Industry Revenue (Million), by Country 2024 & 2032
- Figure 5: Europe Pharma Packaging Industry Revenue Share (%), by Country 2024 & 2032
- Figure 6: Asia Pacific Pharma Packaging Industry Revenue (Million), by Country 2024 & 2032
- Figure 7: Asia Pacific Pharma Packaging Industry Revenue Share (%), by Country 2024 & 2032
- Figure 8: Latin America Pharma Packaging Industry Revenue (Million), by Country 2024 & 2032
- Figure 9: Latin America Pharma Packaging Industry Revenue Share (%), by Country 2024 & 2032
- Figure 10: Middle East Pharma Packaging Industry Revenue (Million), by Country 2024 & 2032
- Figure 11: Middle East Pharma Packaging Industry Revenue Share (%), by Country 2024 & 2032
- Figure 12: United Arab Emirates Pharma Packaging Industry Revenue (Million), by Country 2024 & 2032
- Figure 13: United Arab Emirates Pharma Packaging Industry Revenue Share (%), by Country 2024 & 2032
- Figure 14: North America Pharma Packaging Industry Revenue (Million), by Material 2024 & 2032
- Figure 15: North America Pharma Packaging Industry Revenue Share (%), by Material 2024 & 2032
- Figure 16: North America Pharma Packaging Industry Revenue (Million), by Product Type 2024 & 2032
- Figure 17: North America Pharma Packaging Industry Revenue Share (%), by Product Type 2024 & 2032
- Figure 18: North America Pharma Packaging Industry Revenue (Million), by Country 2024 & 2032
- Figure 19: North America Pharma Packaging Industry Revenue Share (%), by Country 2024 & 2032
- Figure 20: Europe Pharma Packaging Industry Revenue (Million), by Material 2024 & 2032
- Figure 21: Europe Pharma Packaging Industry Revenue Share (%), by Material 2024 & 2032
- Figure 22: Europe Pharma Packaging Industry Revenue (Million), by Product Type 2024 & 2032
- Figure 23: Europe Pharma Packaging Industry Revenue Share (%), by Product Type 2024 & 2032
- Figure 24: Europe Pharma Packaging Industry Revenue (Million), by Country 2024 & 2032
- Figure 25: Europe Pharma Packaging Industry Revenue Share (%), by Country 2024 & 2032
- Figure 26: Asia Pacific Pharma Packaging Industry Revenue (Million), by Material 2024 & 2032
- Figure 27: Asia Pacific Pharma Packaging Industry Revenue Share (%), by Material 2024 & 2032
- Figure 28: Asia Pacific Pharma Packaging Industry Revenue (Million), by Product Type 2024 & 2032
- Figure 29: Asia Pacific Pharma Packaging Industry Revenue Share (%), by Product Type 2024 & 2032
- Figure 30: Asia Pacific Pharma Packaging Industry Revenue (Million), by Country 2024 & 2032
- Figure 31: Asia Pacific Pharma Packaging Industry Revenue Share (%), by Country 2024 & 2032
- Figure 32: Latin America Pharma Packaging Industry Revenue (Million), by Material 2024 & 2032
- Figure 33: Latin America Pharma Packaging Industry Revenue Share (%), by Material 2024 & 2032
- Figure 34: Latin America Pharma Packaging Industry Revenue (Million), by Product Type 2024 & 2032
- Figure 35: Latin America Pharma Packaging Industry Revenue Share (%), by Product Type 2024 & 2032
- Figure 36: Latin America Pharma Packaging Industry Revenue (Million), by Country 2024 & 2032
- Figure 37: Latin America Pharma Packaging Industry Revenue Share (%), by Country 2024 & 2032
- Figure 38: Middle East and Africa Pharma Packaging Industry Revenue (Million), by Material 2024 & 2032
- Figure 39: Middle East and Africa Pharma Packaging Industry Revenue Share (%), by Material 2024 & 2032
- Figure 40: Middle East and Africa Pharma Packaging Industry Revenue (Million), by Product Type 2024 & 2032
- Figure 41: Middle East and Africa Pharma Packaging Industry Revenue Share (%), by Product Type 2024 & 2032
- Figure 42: Middle East and Africa Pharma Packaging Industry Revenue (Million), by Country 2024 & 2032
- Figure 43: Middle East and Africa Pharma Packaging Industry Revenue Share (%), by Country 2024 & 2032
List of Tables
- Table 1: Global Pharma Packaging Industry Revenue Million Forecast, by Region 2019 & 2032
- Table 2: Global Pharma Packaging Industry Revenue Million Forecast, by Material 2019 & 2032
- Table 3: Global Pharma Packaging Industry Revenue Million Forecast, by Product Type 2019 & 2032
- Table 4: Global Pharma Packaging Industry Revenue Million Forecast, by Region 2019 & 2032
- Table 5: Global Pharma Packaging Industry Revenue Million Forecast, by Country 2019 & 2032
- Table 6: United States Pharma Packaging Industry Revenue (Million) Forecast, by Application 2019 & 2032
- Table 7: Canada Pharma Packaging Industry Revenue (Million) Forecast, by Application 2019 & 2032
- Table 8: Global Pharma Packaging Industry Revenue Million Forecast, by Country 2019 & 2032
- Table 9: Germany Pharma Packaging Industry Revenue (Million) Forecast, by Application 2019 & 2032
- Table 10: United Kingdom Pharma Packaging Industry Revenue (Million) Forecast, by Application 2019 & 2032
- Table 11: France Pharma Packaging Industry Revenue (Million) Forecast, by Application 2019 & 2032
- Table 12: Italy Pharma Packaging Industry Revenue (Million) Forecast, by Application 2019 & 2032
- Table 13: Spain Pharma Packaging Industry Revenue (Million) Forecast, by Application 2019 & 2032
- Table 14: Rest of Europe Pharma Packaging Industry Revenue (Million) Forecast, by Application 2019 & 2032
- Table 15: Global Pharma Packaging Industry Revenue Million Forecast, by Country 2019 & 2032
- Table 16: China Pharma Packaging Industry Revenue (Million) Forecast, by Application 2019 & 2032
- Table 17: Japan Pharma Packaging Industry Revenue (Million) Forecast, by Application 2019 & 2032
- Table 18: India Pharma Packaging Industry Revenue (Million) Forecast, by Application 2019 & 2032
- Table 19: South Korea Pharma Packaging Industry Revenue (Million) Forecast, by Application 2019 & 2032
- Table 20: Rest of Asia Pacific Pharma Packaging Industry Revenue (Million) Forecast, by Application 2019 & 2032
- Table 21: Global Pharma Packaging Industry Revenue Million Forecast, by Country 2019 & 2032
- Table 22: Brazil Pharma Packaging Industry Revenue (Million) Forecast, by Application 2019 & 2032
- Table 23: Mexico Pharma Packaging Industry Revenue (Million) Forecast, by Application 2019 & 2032
- Table 24: Rest of Latin America Pharma Packaging Industry Revenue (Million) Forecast, by Application 2019 & 2032
- Table 25: Global Pharma Packaging Industry Revenue Million Forecast, by Country 2019 & 2032
- Table 26: Pharma Packaging Industry Revenue (Million) Forecast, by Application 2019 & 2032
- Table 27: Global Pharma Packaging Industry Revenue Million Forecast, by Country 2019 & 2032
- Table 28: Saudi Arabia Pharma Packaging Industry Revenue (Million) Forecast, by Application 2019 & 2032
- Table 29: South Africa Pharma Packaging Industry Revenue (Million) Forecast, by Application 2019 & 2032
- Table 30: Rest of Middle East Pharma Packaging Industry Revenue (Million) Forecast, by Application 2019 & 2032
- Table 31: Global Pharma Packaging Industry Revenue Million Forecast, by Material 2019 & 2032
- Table 32: Global Pharma Packaging Industry Revenue Million Forecast, by Product Type 2019 & 2032
- Table 33: Global Pharma Packaging Industry Revenue Million Forecast, by Country 2019 & 2032
- Table 34: United States Pharma Packaging Industry Revenue (Million) Forecast, by Application 2019 & 2032
- Table 35: Canada Pharma Packaging Industry Revenue (Million) Forecast, by Application 2019 & 2032
- Table 36: Global Pharma Packaging Industry Revenue Million Forecast, by Material 2019 & 2032
- Table 37: Global Pharma Packaging Industry Revenue Million Forecast, by Product Type 2019 & 2032
- Table 38: Global Pharma Packaging Industry Revenue Million Forecast, by Country 2019 & 2032
- Table 39: Germany Pharma Packaging Industry Revenue (Million) Forecast, by Application 2019 & 2032
- Table 40: United Kingdom Pharma Packaging Industry Revenue (Million) Forecast, by Application 2019 & 2032
- Table 41: France Pharma Packaging Industry Revenue (Million) Forecast, by Application 2019 & 2032
- Table 42: Italy Pharma Packaging Industry Revenue (Million) Forecast, by Application 2019 & 2032
- Table 43: Spain Pharma Packaging Industry Revenue (Million) Forecast, by Application 2019 & 2032
- Table 44: Rest of Europe Pharma Packaging Industry Revenue (Million) Forecast, by Application 2019 & 2032
- Table 45: Global Pharma Packaging Industry Revenue Million Forecast, by Material 2019 & 2032
- Table 46: Global Pharma Packaging Industry Revenue Million Forecast, by Product Type 2019 & 2032
- Table 47: Global Pharma Packaging Industry Revenue Million Forecast, by Country 2019 & 2032
- Table 48: China Pharma Packaging Industry Revenue (Million) Forecast, by Application 2019 & 2032
- Table 49: Japan Pharma Packaging Industry Revenue (Million) Forecast, by Application 2019 & 2032
- Table 50: India Pharma Packaging Industry Revenue (Million) Forecast, by Application 2019 & 2032
- Table 51: South Korea Pharma Packaging Industry Revenue (Million) Forecast, by Application 2019 & 2032
- Table 52: Rest of Asia Pacific Pharma Packaging Industry Revenue (Million) Forecast, by Application 2019 & 2032
- Table 53: Global Pharma Packaging Industry Revenue Million Forecast, by Material 2019 & 2032
- Table 54: Global Pharma Packaging Industry Revenue Million Forecast, by Product Type 2019 & 2032
- Table 55: Global Pharma Packaging Industry Revenue Million Forecast, by Country 2019 & 2032
- Table 56: Brazil Pharma Packaging Industry Revenue (Million) Forecast, by Application 2019 & 2032
- Table 57: Mexico Pharma Packaging Industry Revenue (Million) Forecast, by Application 2019 & 2032
- Table 58: Rest of Latin America Pharma Packaging Industry Revenue (Million) Forecast, by Application 2019 & 2032
- Table 59: Global Pharma Packaging Industry Revenue Million Forecast, by Material 2019 & 2032
- Table 60: Global Pharma Packaging Industry Revenue Million Forecast, by Product Type 2019 & 2032
- Table 61: Global Pharma Packaging Industry Revenue Million Forecast, by Country 2019 & 2032
- Table 62: United Arab Emirates Pharma Packaging Industry Revenue (Million) Forecast, by Application 2019 & 2032
- Table 63: Saudi Arabia Pharma Packaging Industry Revenue (Million) Forecast, by Application 2019 & 2032
- Table 64: South Africa Pharma Packaging Industry Revenue (Million) Forecast, by Application 2019 & 2032
- Table 65: Rest of Middle East and Africa Pharma Packaging Industry Revenue (Million) Forecast, by Application 2019 & 2032
Frequently Asked Questions
1. What is the projected Compound Annual Growth Rate (CAGR) of the Pharma Packaging Industry?
The projected CAGR is approximately 6.10%.
2. Which companies are prominent players in the Pharma Packaging Industry?
Key companies in the market include Becton Dickinson and Company, West Pharmaceutical Services Inc, WestRock Company, Klockner Pentaplast Group, Schott AG, Nipro Corporation*List Not Exhaustive, W L Gore & Associates Inc, AptarGroup Inc, Berry Global Group Inc, 3M Company, Vetter Pharma International GmbH, Amcor PLC, CCL Industries Inc, FlexiTuff International Ltd, Catalent Inc, McKesson Corporation, Gerresheimer AG.
3. What are the main segments of the Pharma Packaging Industry?
The market segments include Material, Product Type.
4. Can you provide details about the market size?
The market size is estimated to be USD 102.10 Million as of 2022.
5. What are some drivers contributing to market growth?
Regulatory Standards on Packaging and Stringent Norms against Counterfeit Products; Impact of Nanotechnology due to Innovative and New- generation Packaging Solutions.
6. What are the notable trends driving market growth?
Plastic Packaging Holds a Significant Market Share.
7. Are there any restraints impacting market growth?
Stringent Government Regulations in Developed Countries.
8. Can you provide examples of recent developments in the market?
January 2023: Amcor announced the acquisition of Shanghai-based MDK. MDK, a market leader in medical device packaging and a key priority growth area for Amcor, has annual sales of about USD 50 million. The addition of MDK will strengthen Amcor's already strong healthcare platform in the Asia-Pacific region as it continues to focus its emphasis on higher growth priority categories.
9. What pricing options are available for accessing the report?
Pricing options include single-user, multi-user, and enterprise licenses priced at USD 4750, USD 5250, and USD 8750 respectively.
10. Is the market size provided in terms of value or volume?
The market size is provided in terms of value, measured in Million.
11. Are there any specific market keywords associated with the report?
Yes, the market keyword associated with the report is "Pharma Packaging Industry," which aids in identifying and referencing the specific market segment covered.
12. How do I determine which pricing option suits my needs best?
The pricing options vary based on user requirements and access needs. Individual users may opt for single-user licenses, while businesses requiring broader access may choose multi-user or enterprise licenses for cost-effective access to the report.
13. Are there any additional resources or data provided in the Pharma Packaging Industry report?
While the report offers comprehensive insights, it's advisable to review the specific contents or supplementary materials provided to ascertain if additional resources or data are available.
14. How can I stay updated on further developments or reports in the Pharma Packaging Industry?
To stay informed about further developments, trends, and reports in the Pharma Packaging Industry, consider subscribing to industry newsletters, following relevant companies and organizations, or regularly checking reputable industry news sources and publications.
Methodology
Step 1 - Identification of Relevant Samples Size from Population Database


Step 2 - Approaches for Defining Global Market Size (Value, Volume* & Price*)

Note*: In applicable scenarios
Step 3 - Data Sources
Primary Research
- Web Analytics
- Survey Reports
- Research Institute
- Latest Research Reports
- Opinion Leaders
Secondary Research
- Annual Reports
- White Paper
- Latest Press Release
- Industry Association
- Paid Database
- Investor Presentations

Step 4 - Data Triangulation
Involves using different sources of information in order to increase the validity of a study
These sources are likely to be stakeholders in a program - participants, other researchers, program staff, other community members, and so on.
Then we put all data in single framework & apply various statistical tools to find out the dynamic on the market.
During the analysis stage, feedback from the stakeholder groups would be compared to determine areas of agreement as well as areas of divergence


