
Key Insights
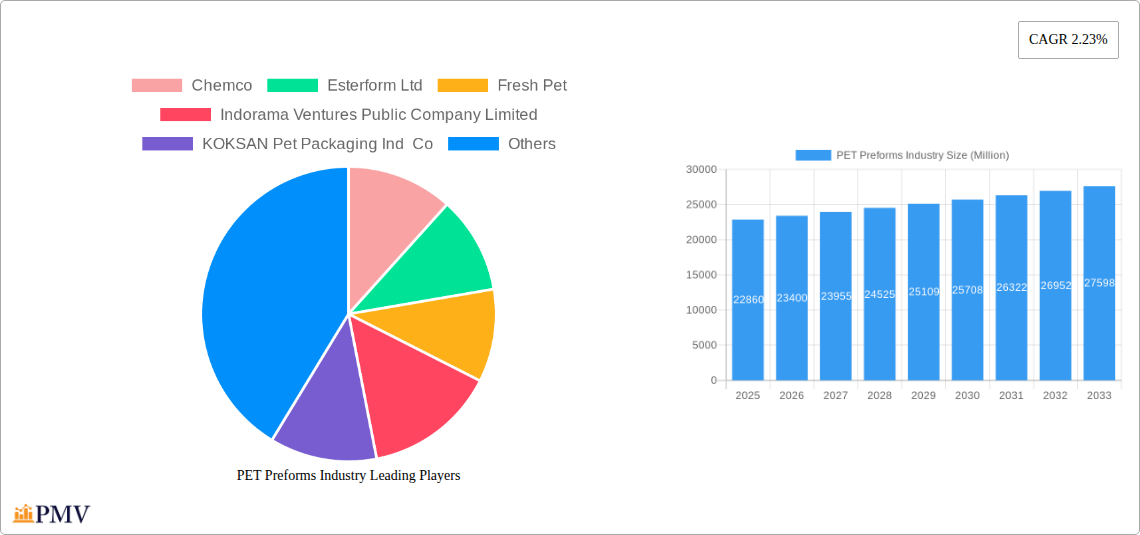
The global PET preforms market, valued at $22.86 billion in 2025, is projected to experience steady growth, driven primarily by the burgeoning demand for bottled beverages and packaged food products. A compound annual growth rate (CAGR) of 2.23% from 2025 to 2033 suggests a consistent expansion, although this rate might be influenced by fluctuations in raw material prices (PET resin) and global economic conditions. Key growth drivers include the increasing preference for convenient packaging, expanding consumer base in developing economies, and the lightweight, recyclable nature of PET preforms, aligning with sustainability goals. The market is segmented by various factors like preform type (standard, lightweight), application (beverages, food, pharmaceuticals), and end-use industries. Competitive landscape analysis reveals a mix of large multinational corporations and regional players, indicating a dynamic market structure with opportunities for both established and emerging businesses. Challenges include fluctuating oil prices impacting PET resin costs, stringent environmental regulations, and the rise of alternative packaging materials. However, technological advancements in preform manufacturing, focusing on improved efficiency and sustainability, will likely mitigate some of these challenges.
The continued growth in the PET preforms market hinges on several factors. Innovation in preform design, including lighter weight options and enhanced barrier properties, is likely to enhance market appeal. Furthermore, advancements in recycling technologies and increased consumer awareness regarding sustainability are anticipated to drive adoption of recycled PET content, presenting significant opportunities for manufacturers to align with environmentally conscious practices. Regional variations are expected, with developing economies showcasing higher growth rates due to expanding middle classes and increasing consumer demand. Established markets, while mature, are likely to witness consistent growth driven by product innovation and the ongoing transition towards more sustainable packaging solutions. Ongoing monitoring of regulatory changes and evolving consumer preferences remains crucial for sustained success in this competitive industry.
PET Preforms Industry: A Comprehensive Market Report (2019-2033)
This detailed report provides a comprehensive analysis of the PET Preforms industry, covering market size, segmentation, competitive landscape, and future growth projections from 2019 to 2033. The report offers invaluable insights for industry stakeholders, including manufacturers, investors, and market researchers seeking to understand this dynamic sector. With a focus on key trends, drivers, and challenges, this report serves as an essential resource for strategic decision-making. The Base Year is 2025, and the Estimated Year is 2025, with a Forecast Period of 2025-2033 and a Historical Period of 2019-2024. The global market size in 2025 is estimated at xx Million.
PET Preforms Industry Market Structure & Competitive Dynamics
The PET preforms industry is characterized by a moderately concentrated market structure, with a few large players holding significant market share. Market concentration is influenced by factors such as economies of scale in production, technological advancements, and access to raw materials. Innovation ecosystems are crucial, with companies continuously investing in research and development to improve preform quality, reduce production costs, and develop sustainable solutions. Stringent regulatory frameworks concerning food safety and environmental standards also play a significant role. Product substitutes, such as alternative packaging materials (e.g., glass, aluminum), pose a challenge, but the lightweight, cost-effective, and recyclable nature of PET preforms maintains its dominance. End-user trends towards convenience and sustainability continue to shape the demand for PET preforms.
Mergers and acquisitions (M&A) activities are frequent, reflecting the industry's consolidation trend. Recent examples include:
- October 2023: Valgroup's acquisition of Garda Plast Group (GP Group) for an estimated xx Million, strengthening Valgroup’s presence in the Italian market.
- May 2024: Retal Industries Ltd partnered with Orzuplast in Uzbekistan, expanding its global reach and service capabilities. The deal's value is undisclosed.
These activities illustrate the competitive landscape and the pursuit of market share and geographic expansion. Market share data for key players is detailed within the full report. We estimate the top 5 players hold approximately xx% of the global market share in 2025.
PET Preforms Industry Industry Trends & Insights
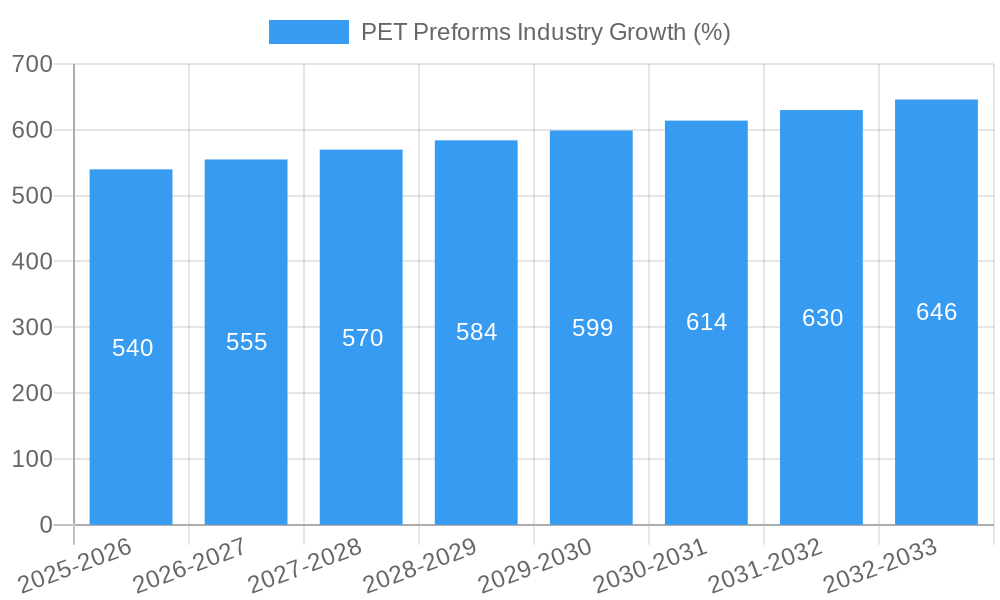
The PET preforms industry exhibits robust growth, driven by several key factors. The Compound Annual Growth Rate (CAGR) for the forecast period (2025-2033) is projected to be xx%, fueled by increasing demand from the food and beverage industry. Technological disruptions, including advancements in preform design and manufacturing processes, are contributing to enhanced efficiency and product quality. Consumer preferences towards lightweight, convenient, and recyclable packaging further underpin market expansion. Market penetration of lightweight preforms and those made from recycled PET (rPET) is rising, responding to sustainability concerns. Competitive dynamics, including price competition, product differentiation, and technological advancements, continually shape the industry's trajectory. The market penetration of rPET preforms is projected to reach xx% by 2033.
Dominant Markets & Segments in PET Preforms Industry
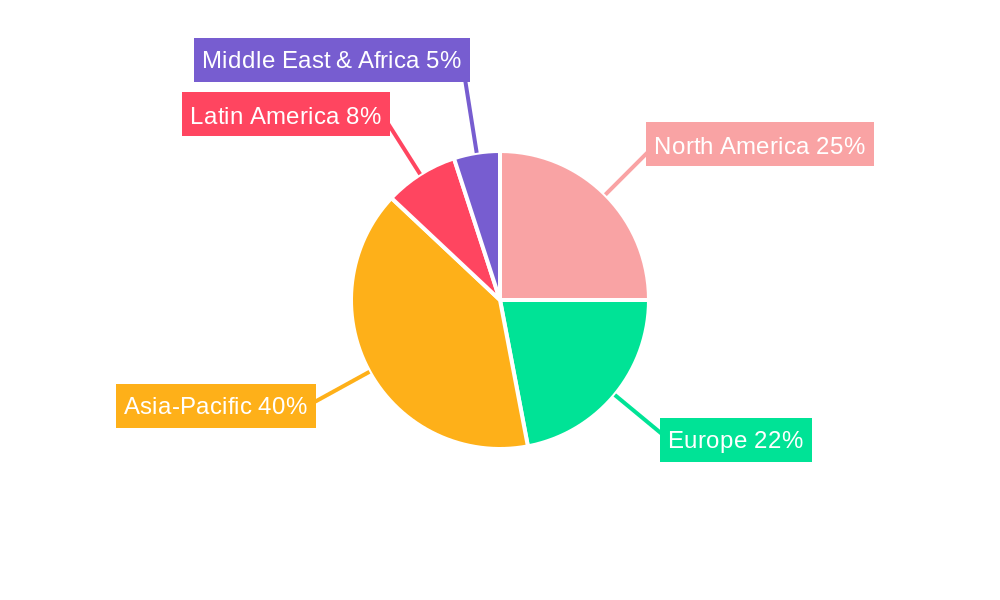
The Asia-Pacific region dominates the global PET preforms market, driven by several factors.
- Rapid Economic Growth: Countries like China and India experience high economic growth, fueling increased consumption of packaged goods.
- Expanding Food & Beverage Sector: A burgeoning food and beverage industry, characterized by rising disposable incomes and changing consumption patterns, contributes substantially to increased demand.
- Favorable Government Policies: Supportive government policies and infrastructure developments facilitate market expansion.
- Increasing Investments: Significant investments in manufacturing facilities and processing plants strengthen local production capabilities.
Other key regions like North America and Europe show steady growth, reflecting the sustained demand for packaged goods across these markets. The beverage segment, particularly carbonated soft drinks and bottled water, holds the largest market share, followed by the food segment. A detailed analysis of regional and segmental dominance, including quantifiable market size projections, is included in the full report.
PET Preforms Industry Product Innovations
Recent innovations focus on enhancing preform lightweighting, improving barrier properties to extend shelf life, and incorporating rPET to promote sustainability. Technological trends include the adoption of advanced manufacturing techniques like injection stretch blow molding (ISBM) for increased efficiency. These innovations cater to the demand for more sustainable and cost-effective packaging solutions. This enables manufacturers to meet evolving consumer preferences and regulatory requirements, creating competitive advantages in the market.
Report Segmentation & Scope
This report segments the PET preforms market based on various factors:
- By Type: This includes monolayer and multilayer preforms, each with their own growth trajectories and market dynamics.
- By Application: This encompasses different end-use industries, such as food and beverages, pharmaceuticals, and cosmetics. Market size and growth projections are provided for each segment.
- By Region: The report analyzes regional variations in market size, growth rates, and competitive landscapes.
Each segment's competitive dynamics are further investigated, providing a granular understanding of the overall market.
Key Drivers of PET Preforms Industry Growth
Several factors drive the PET preforms industry's expansion:
- Growing Demand for Packaged Goods: Rising disposable incomes and changing lifestyles have propelled the demand for packaged foods and beverages.
- Lightweighting Trends: The focus on reducing packaging weight to minimize transportation costs and enhance sustainability fuels market growth.
- Technological Advancements: Improvements in manufacturing processes and preform designs enhance efficiency and product quality.
- Sustainable Packaging Solutions: The rising adoption of rPET and biodegradable materials underscores the industry's focus on environmental responsibility.
Challenges in the PET Preforms Industry Sector
The PET preforms industry faces challenges:
- Fluctuating Raw Material Prices: Price volatility of PET resin directly impacts production costs.
- Environmental Concerns: The industry is increasingly scrutinized concerning its environmental impact, prompting the need for sustainable solutions.
- Intense Competition: The competitive landscape necessitates continuous innovation and cost optimization strategies.
- Regulatory Compliance: Adherence to strict food safety and environmental regulations adds complexity to operations.
Leading Players in the PET Preforms Industry Market
- Chemco
- Esterform Ltd
- Fresh Pet
- Indorama Ventures Public Company Limited (Indorama Ventures)
- KOKSAN Pet Packaging Ind Co
- OZEMBAL
- Plastipak Holdings Inc (Plastipak)
- Poliscan Hellas
- RESILUX NV (RESILUX)
- RETAL Industries Ltd (RETAL)
- SGT
- TPAC PACKAGING INDIA PRIVATE LIMITED
- Valgroup
- Varioform PET
- Winley Polymers Pvt Ltd
Key Developments in PET Preforms Industry Sector
- September 2023: Retal Czech launched monolayer preforms at its Melnik facility, expanding its product portfolio for European markets.
- October 2023: Valgroup's acquisition of Garda Plast Group significantly expanded its presence in the Italian PET preforms market.
- May 2024: Retal Industries Ltd partnered with Orzuplast, enhancing its global reach and service capabilities.
Strategic PET Preforms Industry Market Outlook
The PET preforms industry is poised for sustained growth, driven by several factors including the continued expansion of the food and beverage sector, increasing consumer demand for convenient packaging, and the growing adoption of sustainable solutions. Strategic opportunities lie in capitalizing on technological advancements, focusing on lightweighting and rPET utilization, and expanding into emerging markets. The focus on sustainability and innovative solutions will be key to maintaining competitiveness and achieving further growth in this dynamic industry.
PET Preforms Industry Segmentation
-
1. Application
- 1.1. Carbonated Soft Drinks and Water
- 1.2. Food and Dairy
- 1.3. Personal Care
- 1.4. Alcoholic Beverages
- 1.5. Other Applications (Household Cleaning)
PET Preforms Industry Segmentation By Geography
-
1. Asia Pacific
- 1.1. China
- 1.2. India
- 1.3. Japan
- 1.4. South Korea
- 1.5. Malaysia
- 1.6. Thailand
- 1.7. Indonesia
- 1.8. Vietnam
- 1.9. Rest of Asia Pacific
-
2. North America
- 2.1. United States
- 2.2. Canada
- 2.3. Mexico
-
3. Europe
- 3.1. Germany
- 3.2. United Kingdom
- 3.3. France
- 3.4. Italy
- 3.5. Spain
- 3.6. NORDIC Countries
- 3.7. Turkey
- 3.8. Russia
- 3.9. Rest of Europe
-
4. South America
- 4.1. Brazil
- 4.2. Argentina
- 4.3. Colombia
- 4.4. Rest of South America
-
5. Middle East and Africa
- 5.1. Saudi Arabia
- 5.2. Qatar
- 5.3. United Arab Emirates
- 5.4. Nigeria
- 5.5. Egypt
- 5.6. South Africa
- 5.7. Rest of Middle East and Africa
PET Preforms Industry REPORT HIGHLIGHTS
| Aspects | Details |
|---|---|
| Study Period | 2019-2033 |
| Base Year | 2024 |
| Estimated Year | 2025 |
| Forecast Period | 2025-2033 |
| Historical Period | 2019-2024 |
| Growth Rate | CAGR of 2.23% from 2019-2033 |
| Segmentation |
|
Table of Contents
- 1. Introduction
- 1.1. Research Scope
- 1.2. Market Segmentation
- 1.3. Research Methodology
- 1.4. Definitions and Assumptions
- 2. Executive Summary
- 2.1. Introduction
- 3. Market Dynamics
- 3.1. Introduction
- 3.2. Market Drivers
- 3.2.1. Increasing Demand from Food and Beverage Applications; High Consumption of Carbonated Soft Drinks and Water; Other Drivers
- 3.3. Market Restrains
- 3.3.1. Increasing Demand from Food and Beverage Applications; High Consumption of Carbonated Soft Drinks and Water; Other Drivers
- 3.4. Market Trends
- 3.4.1. Carbonated Soft Drinks and Water to Dominate the Market
- 4. Market Factor Analysis
- 4.1. Porters Five Forces
- 4.2. Supply/Value Chain
- 4.3. PESTEL analysis
- 4.4. Market Entropy
- 4.5. Patent/Trademark Analysis
- 5. Global PET Preforms Industry Analysis, Insights and Forecast, 2019-2031
- 5.1. Market Analysis, Insights and Forecast - by Application
- 5.1.1. Carbonated Soft Drinks and Water
- 5.1.2. Food and Dairy
- 5.1.3. Personal Care
- 5.1.4. Alcoholic Beverages
- 5.1.5. Other Applications (Household Cleaning)
- 5.2. Market Analysis, Insights and Forecast - by Region
- 5.2.1. Asia Pacific
- 5.2.2. North America
- 5.2.3. Europe
- 5.2.4. South America
- 5.2.5. Middle East and Africa
- 5.1. Market Analysis, Insights and Forecast - by Application
- 6. Asia Pacific PET Preforms Industry Analysis, Insights and Forecast, 2019-2031
- 6.1. Market Analysis, Insights and Forecast - by Application
- 6.1.1. Carbonated Soft Drinks and Water
- 6.1.2. Food and Dairy
- 6.1.3. Personal Care
- 6.1.4. Alcoholic Beverages
- 6.1.5. Other Applications (Household Cleaning)
- 6.1. Market Analysis, Insights and Forecast - by Application
- 7. North America PET Preforms Industry Analysis, Insights and Forecast, 2019-2031
- 7.1. Market Analysis, Insights and Forecast - by Application
- 7.1.1. Carbonated Soft Drinks and Water
- 7.1.2. Food and Dairy
- 7.1.3. Personal Care
- 7.1.4. Alcoholic Beverages
- 7.1.5. Other Applications (Household Cleaning)
- 7.1. Market Analysis, Insights and Forecast - by Application
- 8. Europe PET Preforms Industry Analysis, Insights and Forecast, 2019-2031
- 8.1. Market Analysis, Insights and Forecast - by Application
- 8.1.1. Carbonated Soft Drinks and Water
- 8.1.2. Food and Dairy
- 8.1.3. Personal Care
- 8.1.4. Alcoholic Beverages
- 8.1.5. Other Applications (Household Cleaning)
- 8.1. Market Analysis, Insights and Forecast - by Application
- 9. South America PET Preforms Industry Analysis, Insights and Forecast, 2019-2031
- 9.1. Market Analysis, Insights and Forecast - by Application
- 9.1.1. Carbonated Soft Drinks and Water
- 9.1.2. Food and Dairy
- 9.1.3. Personal Care
- 9.1.4. Alcoholic Beverages
- 9.1.5. Other Applications (Household Cleaning)
- 9.1. Market Analysis, Insights and Forecast - by Application
- 10. Middle East and Africa PET Preforms Industry Analysis, Insights and Forecast, 2019-2031
- 10.1. Market Analysis, Insights and Forecast - by Application
- 10.1.1. Carbonated Soft Drinks and Water
- 10.1.2. Food and Dairy
- 10.1.3. Personal Care
- 10.1.4. Alcoholic Beverages
- 10.1.5. Other Applications (Household Cleaning)
- 10.1. Market Analysis, Insights and Forecast - by Application
- 11. Competitive Analysis
- 11.1. Global Market Share Analysis 2024
- 11.2. Company Profiles
- 11.2.1 Chemco
- 11.2.1.1. Overview
- 11.2.1.2. Products
- 11.2.1.3. SWOT Analysis
- 11.2.1.4. Recent Developments
- 11.2.1.5. Financials (Based on Availability)
- 11.2.2 Esterform Ltd
- 11.2.2.1. Overview
- 11.2.2.2. Products
- 11.2.2.3. SWOT Analysis
- 11.2.2.4. Recent Developments
- 11.2.2.5. Financials (Based on Availability)
- 11.2.3 Fresh Pet
- 11.2.3.1. Overview
- 11.2.3.2. Products
- 11.2.3.3. SWOT Analysis
- 11.2.3.4. Recent Developments
- 11.2.3.5. Financials (Based on Availability)
- 11.2.4 Indorama Ventures Public Company Limited
- 11.2.4.1. Overview
- 11.2.4.2. Products
- 11.2.4.3. SWOT Analysis
- 11.2.4.4. Recent Developments
- 11.2.4.5. Financials (Based on Availability)
- 11.2.5 KOKSAN Pet Packaging Ind Co
- 11.2.5.1. Overview
- 11.2.5.2. Products
- 11.2.5.3. SWOT Analysis
- 11.2.5.4. Recent Developments
- 11.2.5.5. Financials (Based on Availability)
- 11.2.6 OZEMBAL
- 11.2.6.1. Overview
- 11.2.6.2. Products
- 11.2.6.3. SWOT Analysis
- 11.2.6.4. Recent Developments
- 11.2.6.5. Financials (Based on Availability)
- 11.2.7 Plastipak Holdings Inc
- 11.2.7.1. Overview
- 11.2.7.2. Products
- 11.2.7.3. SWOT Analysis
- 11.2.7.4. Recent Developments
- 11.2.7.5. Financials (Based on Availability)
- 11.2.8 Polisan Hellas
- 11.2.8.1. Overview
- 11.2.8.2. Products
- 11.2.8.3. SWOT Analysis
- 11.2.8.4. Recent Developments
- 11.2.8.5. Financials (Based on Availability)
- 11.2.9 RESILUX NV
- 11.2.9.1. Overview
- 11.2.9.2. Products
- 11.2.9.3. SWOT Analysis
- 11.2.9.4. Recent Developments
- 11.2.9.5. Financials (Based on Availability)
- 11.2.10 RETAL Industries Ltd
- 11.2.10.1. Overview
- 11.2.10.2. Products
- 11.2.10.3. SWOT Analysis
- 11.2.10.4. Recent Developments
- 11.2.10.5. Financials (Based on Availability)
- 11.2.11 SGT
- 11.2.11.1. Overview
- 11.2.11.2. Products
- 11.2.11.3. SWOT Analysis
- 11.2.11.4. Recent Developments
- 11.2.11.5. Financials (Based on Availability)
- 11.2.12 TPAC PACKAGING INDIA PRIVATE LIMITED
- 11.2.12.1. Overview
- 11.2.12.2. Products
- 11.2.12.3. SWOT Analysis
- 11.2.12.4. Recent Developments
- 11.2.12.5. Financials (Based on Availability)
- 11.2.13 Valgroup
- 11.2.13.1. Overview
- 11.2.13.2. Products
- 11.2.13.3. SWOT Analysis
- 11.2.13.4. Recent Developments
- 11.2.13.5. Financials (Based on Availability)
- 11.2.14 Varioform PET
- 11.2.14.1. Overview
- 11.2.14.2. Products
- 11.2.14.3. SWOT Analysis
- 11.2.14.4. Recent Developments
- 11.2.14.5. Financials (Based on Availability)
- 11.2.15 Winley Polymers Pvt Ltd*List Not Exhaustive
- 11.2.15.1. Overview
- 11.2.15.2. Products
- 11.2.15.3. SWOT Analysis
- 11.2.15.4. Recent Developments
- 11.2.15.5. Financials (Based on Availability)
- 11.2.1 Chemco
List of Figures
- Figure 1: Global PET Preforms Industry Revenue Breakdown (Million, %) by Region 2024 & 2032
- Figure 2: Global PET Preforms Industry Volume Breakdown (Billion, %) by Region 2024 & 2032
- Figure 3: Asia Pacific PET Preforms Industry Revenue (Million), by Application 2024 & 2032
- Figure 4: Asia Pacific PET Preforms Industry Volume (Billion), by Application 2024 & 2032
- Figure 5: Asia Pacific PET Preforms Industry Revenue Share (%), by Application 2024 & 2032
- Figure 6: Asia Pacific PET Preforms Industry Volume Share (%), by Application 2024 & 2032
- Figure 7: Asia Pacific PET Preforms Industry Revenue (Million), by Country 2024 & 2032
- Figure 8: Asia Pacific PET Preforms Industry Volume (Billion), by Country 2024 & 2032
- Figure 9: Asia Pacific PET Preforms Industry Revenue Share (%), by Country 2024 & 2032
- Figure 10: Asia Pacific PET Preforms Industry Volume Share (%), by Country 2024 & 2032
- Figure 11: North America PET Preforms Industry Revenue (Million), by Application 2024 & 2032
- Figure 12: North America PET Preforms Industry Volume (Billion), by Application 2024 & 2032
- Figure 13: North America PET Preforms Industry Revenue Share (%), by Application 2024 & 2032
- Figure 14: North America PET Preforms Industry Volume Share (%), by Application 2024 & 2032
- Figure 15: North America PET Preforms Industry Revenue (Million), by Country 2024 & 2032
- Figure 16: North America PET Preforms Industry Volume (Billion), by Country 2024 & 2032
- Figure 17: North America PET Preforms Industry Revenue Share (%), by Country 2024 & 2032
- Figure 18: North America PET Preforms Industry Volume Share (%), by Country 2024 & 2032
- Figure 19: Europe PET Preforms Industry Revenue (Million), by Application 2024 & 2032
- Figure 20: Europe PET Preforms Industry Volume (Billion), by Application 2024 & 2032
- Figure 21: Europe PET Preforms Industry Revenue Share (%), by Application 2024 & 2032
- Figure 22: Europe PET Preforms Industry Volume Share (%), by Application 2024 & 2032
- Figure 23: Europe PET Preforms Industry Revenue (Million), by Country 2024 & 2032
- Figure 24: Europe PET Preforms Industry Volume (Billion), by Country 2024 & 2032
- Figure 25: Europe PET Preforms Industry Revenue Share (%), by Country 2024 & 2032
- Figure 26: Europe PET Preforms Industry Volume Share (%), by Country 2024 & 2032
- Figure 27: South America PET Preforms Industry Revenue (Million), by Application 2024 & 2032
- Figure 28: South America PET Preforms Industry Volume (Billion), by Application 2024 & 2032
- Figure 29: South America PET Preforms Industry Revenue Share (%), by Application 2024 & 2032
- Figure 30: South America PET Preforms Industry Volume Share (%), by Application 2024 & 2032
- Figure 31: South America PET Preforms Industry Revenue (Million), by Country 2024 & 2032
- Figure 32: South America PET Preforms Industry Volume (Billion), by Country 2024 & 2032
- Figure 33: South America PET Preforms Industry Revenue Share (%), by Country 2024 & 2032
- Figure 34: South America PET Preforms Industry Volume Share (%), by Country 2024 & 2032
- Figure 35: Middle East and Africa PET Preforms Industry Revenue (Million), by Application 2024 & 2032
- Figure 36: Middle East and Africa PET Preforms Industry Volume (Billion), by Application 2024 & 2032
- Figure 37: Middle East and Africa PET Preforms Industry Revenue Share (%), by Application 2024 & 2032
- Figure 38: Middle East and Africa PET Preforms Industry Volume Share (%), by Application 2024 & 2032
- Figure 39: Middle East and Africa PET Preforms Industry Revenue (Million), by Country 2024 & 2032
- Figure 40: Middle East and Africa PET Preforms Industry Volume (Billion), by Country 2024 & 2032
- Figure 41: Middle East and Africa PET Preforms Industry Revenue Share (%), by Country 2024 & 2032
- Figure 42: Middle East and Africa PET Preforms Industry Volume Share (%), by Country 2024 & 2032
List of Tables
- Table 1: Global PET Preforms Industry Revenue Million Forecast, by Region 2019 & 2032
- Table 2: Global PET Preforms Industry Volume Billion Forecast, by Region 2019 & 2032
- Table 3: Global PET Preforms Industry Revenue Million Forecast, by Application 2019 & 2032
- Table 4: Global PET Preforms Industry Volume Billion Forecast, by Application 2019 & 2032
- Table 5: Global PET Preforms Industry Revenue Million Forecast, by Region 2019 & 2032
- Table 6: Global PET Preforms Industry Volume Billion Forecast, by Region 2019 & 2032
- Table 7: Global PET Preforms Industry Revenue Million Forecast, by Application 2019 & 2032
- Table 8: Global PET Preforms Industry Volume Billion Forecast, by Application 2019 & 2032
- Table 9: Global PET Preforms Industry Revenue Million Forecast, by Country 2019 & 2032
- Table 10: Global PET Preforms Industry Volume Billion Forecast, by Country 2019 & 2032
- Table 11: China PET Preforms Industry Revenue (Million) Forecast, by Application 2019 & 2032
- Table 12: China PET Preforms Industry Volume (Billion) Forecast, by Application 2019 & 2032
- Table 13: India PET Preforms Industry Revenue (Million) Forecast, by Application 2019 & 2032
- Table 14: India PET Preforms Industry Volume (Billion) Forecast, by Application 2019 & 2032
- Table 15: Japan PET Preforms Industry Revenue (Million) Forecast, by Application 2019 & 2032
- Table 16: Japan PET Preforms Industry Volume (Billion) Forecast, by Application 2019 & 2032
- Table 17: South Korea PET Preforms Industry Revenue (Million) Forecast, by Application 2019 & 2032
- Table 18: South Korea PET Preforms Industry Volume (Billion) Forecast, by Application 2019 & 2032
- Table 19: Malaysia PET Preforms Industry Revenue (Million) Forecast, by Application 2019 & 2032
- Table 20: Malaysia PET Preforms Industry Volume (Billion) Forecast, by Application 2019 & 2032
- Table 21: Thailand PET Preforms Industry Revenue (Million) Forecast, by Application 2019 & 2032
- Table 22: Thailand PET Preforms Industry Volume (Billion) Forecast, by Application 2019 & 2032
- Table 23: Indonesia PET Preforms Industry Revenue (Million) Forecast, by Application 2019 & 2032
- Table 24: Indonesia PET Preforms Industry Volume (Billion) Forecast, by Application 2019 & 2032
- Table 25: Vietnam PET Preforms Industry Revenue (Million) Forecast, by Application 2019 & 2032
- Table 26: Vietnam PET Preforms Industry Volume (Billion) Forecast, by Application 2019 & 2032
- Table 27: Rest of Asia Pacific PET Preforms Industry Revenue (Million) Forecast, by Application 2019 & 2032
- Table 28: Rest of Asia Pacific PET Preforms Industry Volume (Billion) Forecast, by Application 2019 & 2032
- Table 29: Global PET Preforms Industry Revenue Million Forecast, by Application 2019 & 2032
- Table 30: Global PET Preforms Industry Volume Billion Forecast, by Application 2019 & 2032
- Table 31: Global PET Preforms Industry Revenue Million Forecast, by Country 2019 & 2032
- Table 32: Global PET Preforms Industry Volume Billion Forecast, by Country 2019 & 2032
- Table 33: United States PET Preforms Industry Revenue (Million) Forecast, by Application 2019 & 2032
- Table 34: United States PET Preforms Industry Volume (Billion) Forecast, by Application 2019 & 2032
- Table 35: Canada PET Preforms Industry Revenue (Million) Forecast, by Application 2019 & 2032
- Table 36: Canada PET Preforms Industry Volume (Billion) Forecast, by Application 2019 & 2032
- Table 37: Mexico PET Preforms Industry Revenue (Million) Forecast, by Application 2019 & 2032
- Table 38: Mexico PET Preforms Industry Volume (Billion) Forecast, by Application 2019 & 2032
- Table 39: Global PET Preforms Industry Revenue Million Forecast, by Application 2019 & 2032
- Table 40: Global PET Preforms Industry Volume Billion Forecast, by Application 2019 & 2032
- Table 41: Global PET Preforms Industry Revenue Million Forecast, by Country 2019 & 2032
- Table 42: Global PET Preforms Industry Volume Billion Forecast, by Country 2019 & 2032
- Table 43: Germany PET Preforms Industry Revenue (Million) Forecast, by Application 2019 & 2032
- Table 44: Germany PET Preforms Industry Volume (Billion) Forecast, by Application 2019 & 2032
- Table 45: United Kingdom PET Preforms Industry Revenue (Million) Forecast, by Application 2019 & 2032
- Table 46: United Kingdom PET Preforms Industry Volume (Billion) Forecast, by Application 2019 & 2032
- Table 47: France PET Preforms Industry Revenue (Million) Forecast, by Application 2019 & 2032
- Table 48: France PET Preforms Industry Volume (Billion) Forecast, by Application 2019 & 2032
- Table 49: Italy PET Preforms Industry Revenue (Million) Forecast, by Application 2019 & 2032
- Table 50: Italy PET Preforms Industry Volume (Billion) Forecast, by Application 2019 & 2032
- Table 51: Spain PET Preforms Industry Revenue (Million) Forecast, by Application 2019 & 2032
- Table 52: Spain PET Preforms Industry Volume (Billion) Forecast, by Application 2019 & 2032
- Table 53: NORDIC Countries PET Preforms Industry Revenue (Million) Forecast, by Application 2019 & 2032
- Table 54: NORDIC Countries PET Preforms Industry Volume (Billion) Forecast, by Application 2019 & 2032
- Table 55: Turkey PET Preforms Industry Revenue (Million) Forecast, by Application 2019 & 2032
- Table 56: Turkey PET Preforms Industry Volume (Billion) Forecast, by Application 2019 & 2032
- Table 57: Russia PET Preforms Industry Revenue (Million) Forecast, by Application 2019 & 2032
- Table 58: Russia PET Preforms Industry Volume (Billion) Forecast, by Application 2019 & 2032
- Table 59: Rest of Europe PET Preforms Industry Revenue (Million) Forecast, by Application 2019 & 2032
- Table 60: Rest of Europe PET Preforms Industry Volume (Billion) Forecast, by Application 2019 & 2032
- Table 61: Global PET Preforms Industry Revenue Million Forecast, by Application 2019 & 2032
- Table 62: Global PET Preforms Industry Volume Billion Forecast, by Application 2019 & 2032
- Table 63: Global PET Preforms Industry Revenue Million Forecast, by Country 2019 & 2032
- Table 64: Global PET Preforms Industry Volume Billion Forecast, by Country 2019 & 2032
- Table 65: Brazil PET Preforms Industry Revenue (Million) Forecast, by Application 2019 & 2032
- Table 66: Brazil PET Preforms Industry Volume (Billion) Forecast, by Application 2019 & 2032
- Table 67: Argentina PET Preforms Industry Revenue (Million) Forecast, by Application 2019 & 2032
- Table 68: Argentina PET Preforms Industry Volume (Billion) Forecast, by Application 2019 & 2032
- Table 69: Colombia PET Preforms Industry Revenue (Million) Forecast, by Application 2019 & 2032
- Table 70: Colombia PET Preforms Industry Volume (Billion) Forecast, by Application 2019 & 2032
- Table 71: Rest of South America PET Preforms Industry Revenue (Million) Forecast, by Application 2019 & 2032
- Table 72: Rest of South America PET Preforms Industry Volume (Billion) Forecast, by Application 2019 & 2032
- Table 73: Global PET Preforms Industry Revenue Million Forecast, by Application 2019 & 2032
- Table 74: Global PET Preforms Industry Volume Billion Forecast, by Application 2019 & 2032
- Table 75: Global PET Preforms Industry Revenue Million Forecast, by Country 2019 & 2032
- Table 76: Global PET Preforms Industry Volume Billion Forecast, by Country 2019 & 2032
- Table 77: Saudi Arabia PET Preforms Industry Revenue (Million) Forecast, by Application 2019 & 2032
- Table 78: Saudi Arabia PET Preforms Industry Volume (Billion) Forecast, by Application 2019 & 2032
- Table 79: Qatar PET Preforms Industry Revenue (Million) Forecast, by Application 2019 & 2032
- Table 80: Qatar PET Preforms Industry Volume (Billion) Forecast, by Application 2019 & 2032
- Table 81: United Arab Emirates PET Preforms Industry Revenue (Million) Forecast, by Application 2019 & 2032
- Table 82: United Arab Emirates PET Preforms Industry Volume (Billion) Forecast, by Application 2019 & 2032
- Table 83: Nigeria PET Preforms Industry Revenue (Million) Forecast, by Application 2019 & 2032
- Table 84: Nigeria PET Preforms Industry Volume (Billion) Forecast, by Application 2019 & 2032
- Table 85: Egypt PET Preforms Industry Revenue (Million) Forecast, by Application 2019 & 2032
- Table 86: Egypt PET Preforms Industry Volume (Billion) Forecast, by Application 2019 & 2032
- Table 87: South Africa PET Preforms Industry Revenue (Million) Forecast, by Application 2019 & 2032
- Table 88: South Africa PET Preforms Industry Volume (Billion) Forecast, by Application 2019 & 2032
- Table 89: Rest of Middle East and Africa PET Preforms Industry Revenue (Million) Forecast, by Application 2019 & 2032
- Table 90: Rest of Middle East and Africa PET Preforms Industry Volume (Billion) Forecast, by Application 2019 & 2032
Frequently Asked Questions
1. What is the projected Compound Annual Growth Rate (CAGR) of the PET Preforms Industry?
The projected CAGR is approximately 2.23%.
2. Which companies are prominent players in the PET Preforms Industry?
Key companies in the market include Chemco, Esterform Ltd, Fresh Pet, Indorama Ventures Public Company Limited, KOKSAN Pet Packaging Ind Co, OZEMBAL, Plastipak Holdings Inc, Polisan Hellas, RESILUX NV, RETAL Industries Ltd, SGT, TPAC PACKAGING INDIA PRIVATE LIMITED, Valgroup, Varioform PET, Winley Polymers Pvt Ltd*List Not Exhaustive.
3. What are the main segments of the PET Preforms Industry?
The market segments include Application.
4. Can you provide details about the market size?
The market size is estimated to be USD 22.86 Million as of 2022.
5. What are some drivers contributing to market growth?
Increasing Demand from Food and Beverage Applications; High Consumption of Carbonated Soft Drinks and Water; Other Drivers.
6. What are the notable trends driving market growth?
Carbonated Soft Drinks and Water to Dominate the Market.
7. Are there any restraints impacting market growth?
Increasing Demand from Food and Beverage Applications; High Consumption of Carbonated Soft Drinks and Water; Other Drivers.
8. Can you provide examples of recent developments in the market?
May 2024: Retal Industries Ltd forged a new industrial partnership with Polymer Industries LLC, operating under the trade name Orzuplast. Based in Uzbekistan, Orzuplast specializes in packaging solutions for both local and neighboring markets. With this collaboration, RETAL expanded its partner network and enhanced its service capabilities for the global food and beverage packaging industries by offering its PET preforms and related products.October 2023: Valgroup acquired Garda Plast Group (GP Group), significantly expanding into the Italian PET preforms market. Specializing in the production of both PET and rPET preforms, GP Group's integration bolstered Valgroup's foothold in Italy. This move fortified Valgroup's ties with local suppliers and enhanced its ability to cater to regional customers with greater depth and breadth.September 2023: Retal Czech commenced the production of monolayer preforms at its Melnik facility. The 26/22 GME 30.37 preform, offered in various weights, is perfectly tailored for European markets, catering to carbonated and non-carbonated beverages that utilize this specific neck finish. This latest addition broadened its portfolio, enabling it to cater to local clientele and neighboring European countries.
9. What pricing options are available for accessing the report?
Pricing options include single-user, multi-user, and enterprise licenses priced at USD 4750, USD 5250, and USD 8750 respectively.
10. Is the market size provided in terms of value or volume?
The market size is provided in terms of value, measured in Million and volume, measured in Billion.
11. Are there any specific market keywords associated with the report?
Yes, the market keyword associated with the report is "PET Preforms Industry," which aids in identifying and referencing the specific market segment covered.
12. How do I determine which pricing option suits my needs best?
The pricing options vary based on user requirements and access needs. Individual users may opt for single-user licenses, while businesses requiring broader access may choose multi-user or enterprise licenses for cost-effective access to the report.
13. Are there any additional resources or data provided in the PET Preforms Industry report?
While the report offers comprehensive insights, it's advisable to review the specific contents or supplementary materials provided to ascertain if additional resources or data are available.
14. How can I stay updated on further developments or reports in the PET Preforms Industry?
To stay informed about further developments, trends, and reports in the PET Preforms Industry, consider subscribing to industry newsletters, following relevant companies and organizations, or regularly checking reputable industry news sources and publications.
Methodology
Step 1 - Identification of Relevant Samples Size from Population Database


Step 2 - Approaches for Defining Global Market Size (Value, Volume* & Price*)

Note*: In applicable scenarios
Step 3 - Data Sources
Primary Research
- Web Analytics
- Survey Reports
- Research Institute
- Latest Research Reports
- Opinion Leaders
Secondary Research
- Annual Reports
- White Paper
- Latest Press Release
- Industry Association
- Paid Database
- Investor Presentations

Step 4 - Data Triangulation
Involves using different sources of information in order to increase the validity of a study
These sources are likely to be stakeholders in a program - participants, other researchers, program staff, other community members, and so on.
Then we put all data in single framework & apply various statistical tools to find out the dynamic on the market.
During the analysis stage, feedback from the stakeholder groups would be compared to determine areas of agreement as well as areas of divergence


