Key Insights
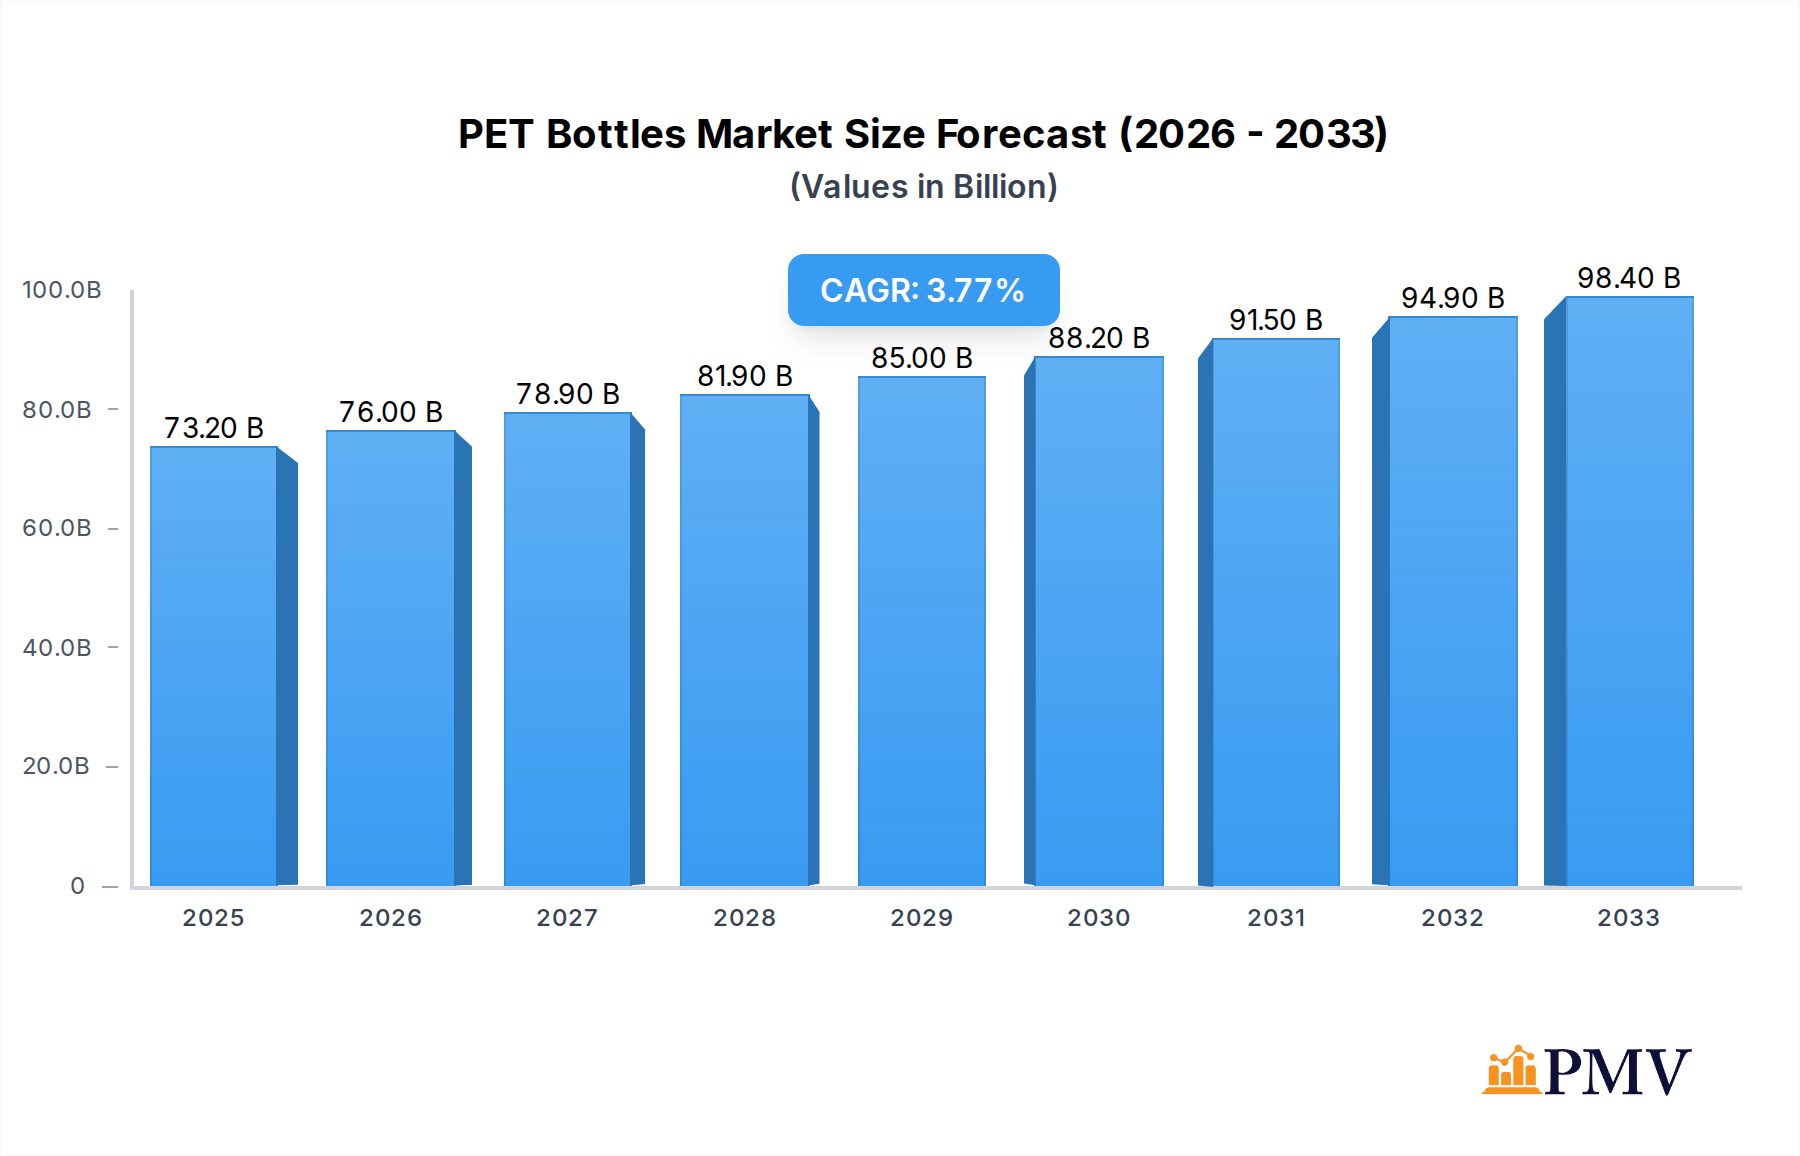
The global PET bottles and containers market is poised for steady growth, projected to reach an estimated $73.2 billion in 2025. This expansion is driven by the increasing demand for convenient and safe packaging solutions across various industries. The market is anticipated to grow at a Compound Annual Growth Rate (CAGR) of 3.8% during the forecast period of 2025-2033. Key drivers include the rising consumption of packaged beverages, the growing preference for single-use and portable food packaging, and the expanding pharmaceutical sector that relies on PET for its clarity, durability, and inertness. Furthermore, the versatility of PET in creating both transparent and colorful options allows manufacturers to cater to diverse aesthetic and functional requirements, bolstering its adoption in Fast-Moving Consumer Goods (FMCG) beyond just beverages and food. The increasing global population and urbanization trends further amplify the need for packaged goods, directly translating into higher demand for PET bottles and containers.

PET Bottles & Containers Market Size (In Billion)
Despite the positive outlook, the market faces certain restraints that could temper its growth trajectory. Stringent environmental regulations and growing consumer consciousness regarding plastic waste are pushing for sustainable alternatives and increased recycling efforts. This can lead to higher operational costs for manufacturers due to investments in recycling infrastructure and the development of eco-friendlier packaging materials. However, ongoing innovations in PET technology, such as the development of recycled PET (rPET) and biodegradable PET variants, are actively addressing these concerns, positioning the market for continued relevance. Emerging economies, particularly in the Asia Pacific region, are expected to be significant growth engines due to rapid industrialization and a burgeoning middle class with increasing purchasing power for packaged goods. The competitive landscape is characterized by the presence of several key global players, indicating a mature yet dynamic market.
PET Bottles & Containers Company Market Share
This in-depth market research report provides a comprehensive analysis of the global PET bottles and containers market, covering the historical period from 2019 to 2024, the base year of 2025, and a detailed forecast period from 2025 to 2033. With an estimated market size of US$ 120 billion in the base year, this report offers critical insights for stakeholders looking to navigate the dynamic landscape of PET packaging solutions. We delve into market structure, competitive dynamics, key trends, dominant segments, product innovations, growth drivers, challenges, leading players, and strategic market outlook, offering actionable intelligence for market participants.
PET Bottles & Containers Market Structure & Competitive Dynamics
The global PET bottles and containers market exhibits a moderately concentrated structure, with key players like ALPLA, Amcor, Plastipak Packaging, Graham Packaging, RPC, Berry Plastics, Greiner Packaging, Alpha Packaging, Zijiang, Visy, Zhongfu, XLZT, Polycon Industries, KW Plastics, and Boxmore Packaging holding significant market shares. The market is characterized by continuous innovation in material science, manufacturing processes, and sustainability initiatives, fostering a dynamic innovation ecosystem. Regulatory frameworks, particularly concerning plastic waste management and recycled content mandates, are increasingly shaping market strategies. While product substitutes exist, the cost-effectiveness, versatility, and performance of PET continue to drive its dominance. End-user preferences are shifting towards lightweight, durable, and increasingly sustainable packaging solutions. Mergers and acquisitions (M&A) activities are prevalent as companies seek to expand their geographic reach, product portfolios, and technological capabilities. Recent M&A deals have cumulatively valued in the billions of dollars, reflecting consolidation and strategic growth objectives. The overall market share distribution highlights a competitive yet evolving landscape, with a strong emphasis on adopting circular economy principles.
PET Bottles & Containers Industry Trends & Insights
The PET bottles and containers industry is poised for robust growth, driven by an escalating demand for convenient and safe packaging across diverse sectors. The market is projected to witness a Compound Annual Growth Rate (CAGR) of approximately 4.5% during the forecast period. Key market growth drivers include the expanding global population, rising disposable incomes, and the increasing preference for ready-to-drink beverages and convenience foods. Technological disruptions are significantly influencing the industry, with advancements in lightweighting technologies, enhanced barrier properties, and the development of high-performance recycled PET (rPET) grades. Consumer preferences are increasingly leaning towards sustainable packaging solutions, creating a strong impetus for the adoption of recycled and recyclable PET. This shift is accelerating market penetration of rPET, with projections indicating it could reach 50% of total PET production by 2033. Competitive dynamics are intensifying, with manufacturers focusing on differentiation through innovative designs, superior product quality, and a strong commitment to environmental, social, and governance (ESG) principles. The integration of advanced manufacturing techniques, such as blow molding and injection stretch blow molding, further enhances production efficiency and product customization. The industry is also witnessing a growing emphasis on digital transformation, with the adoption of Industry 4.0 technologies for optimized production planning and supply chain management. The increasing awareness about the environmental impact of single-use plastics is spurring innovation in biodegradable and compostable alternatives, though PET's established infrastructure and performance characteristics continue to maintain its market leadership. The market penetration of PET bottles and containers in emerging economies is on an upward trajectory, driven by urbanization and the growth of the organized retail sector. The demand for personalized packaging and smaller pack sizes also presents a growing trend, catering to evolving consumer lifestyles. The emphasis on food safety and product shelf-life extension further solidifies the role of PET in critical applications. The industry is also experiencing growth in specialized PET formulations designed for high-temperature filling and retort applications. The collaborative efforts between raw material suppliers, packaging manufacturers, and brand owners are crucial in driving sustainable solutions and addressing the evolving regulatory landscape.
Dominant Markets & Segments in PET Bottles & Containers
The Beverages and Food application segment stands as the dominant force within the global PET bottles and containers market, accounting for an estimated 65% of the market share in the base year. This segment's dominance is fueled by the immense global demand for bottled water, carbonated soft drinks, juices, edible oils, and processed foods. Key drivers for this segment's leadership include the inherent suitability of PET for preserving product freshness, its excellent barrier properties against oxygen and moisture, and its cost-effectiveness. The Transparent Type of PET bottles and containers also commands a significant market presence, projected to capture 70% of the market by value in 2025, due to its ability to showcase product contents, enhancing consumer appeal.
Beverages and Food:
- Key Drivers: Growing global consumption of packaged beverages and convenience foods, increasing demand for single-serve and multipack options, and stringent food safety regulations that favor the inert nature of PET. Economic policies supporting the food and beverage industry and the development of robust cold chain infrastructure further boost demand.
- Dominance Analysis: The sheer volume of consumption for beverages like water, soda, and juices, coupled with the expanding market for packaged foods, makes this segment unparalleled. The versatility of PET in accommodating various filling temperatures and product types ensures its continued dominance.
Pharmaceutical:
- Key Drivers: Rising healthcare expenditure, an aging global population, and the increasing prevalence of chronic diseases drive the demand for pharmaceutical packaging. The need for sterile, safe, and tamper-evident packaging solutions makes PET a preferred choice. Government initiatives to improve healthcare access and pharmaceutical manufacturing capabilities in developing nations are also significant contributors.
- Dominance Analysis: While a smaller segment compared to beverages and food, the pharmaceutical sector demands high-quality, chemically inert, and compliant packaging, where PET excels. The growth in over-the-counter (OTC) medications and specialized drug delivery systems further supports this segment.
FMCG (Fast-Moving Consumer Goods):
- Key Drivers: The broad category of FMCG encompasses personal care products, home care items, and cosmetics, all of which rely heavily on PET packaging for their visual appeal and functionality. Growing urbanization and the expansion of retail networks in emerging markets are key growth enablers.
- Dominance Analysis: The aesthetic qualities of PET, its recyclability, and its ability to be molded into various shapes and sizes make it ideal for the diverse range of FMCG products. The increasing trend of e-commerce and the need for durable yet lightweight packaging for shipping further bolster its position.
Others:
- Key Drivers: This segment includes industrial chemicals, automotive fluids, and various niche applications where PET's chemical resistance and durability are valued.
- Dominance Analysis: While less prominent in terms of volume, the "Others" segment highlights PET's versatility and its ability to meet specific performance requirements in demanding industrial applications.
Colorful Type:
- Key Drivers: Brand differentiation, product visibility, and the ability to convey specific brand messages through packaging color.
- Dominance Analysis: While transparent PET dominates, colored PET plays a crucial role in product branding and market appeal, particularly in sectors like beverages and FMCG.
Transparent Type:
- Key Drivers: Consumer preference for product visibility, perceived freshness, and the ability to easily identify product contents.
- Dominance Analysis: The clear visual appeal of transparent PET remains a primary choice for a vast majority of consumer products, particularly in the food, beverage, and pharmaceutical industries.
Geographically, North America and Europe currently lead the market, driven by established industries and strong sustainability initiatives. However, the Asia Pacific region is emerging as the fastest-growing market due to rapid industrialization, increasing disposable incomes, and a burgeoning middle class.
PET Bottles & Containers Product Innovations
Product innovations in the PET bottles and containers market are primarily focused on enhancing sustainability, functionality, and consumer experience. Key developments include the introduction of high-strength, lightweight bottle designs that reduce material usage and transportation costs. Advancements in barrier technologies are extending shelf life for sensitive products. The significant trend towards incorporating higher percentages of recycled PET (rPET) into new packaging is gaining momentum, driven by both regulatory pressures and consumer demand for eco-friendly solutions. Furthermore, innovations in bottle-to-bottle recycling processes are creating a more robust circular economy for PET. The development of bio-based PET is also an emerging area of research and development, offering alternatives to fossil fuel-derived materials. These innovations provide a competitive advantage by meeting evolving market demands for performance, cost-effectiveness, and environmental responsibility.
Report Segmentation & Scope
This report segments the PET bottles and containers market by Application and Type. The Application segmentation includes Beverages and Food, Pharmaceutical, FMCG, and Others. The Type segmentation focuses on Colorful Type and Transparent Type. Each segment is analyzed for its market size, growth projections, and competitive dynamics. For instance, the Beverages and Food segment, projected to reach US$ 78 billion by 2033, continues to be the largest application area, driven by the convenience and safety offered by PET packaging. The Pharmaceutical segment, estimated at US$ 15 billion in 2025, is expected to grow steadily due to increasing healthcare demands. The FMCG segment, valued at US$ 18 billion in 2025, benefits from its broad reach across consumer goods. The Transparent Type segment, expected to be valued at US$ 84 billion in 2025, will likely maintain its dominance due to consumer preference for product visibility, while the Colorful Type segment, valued at US$ 36 billion in 2025, offers brand differentiation.
Key Drivers of PET Bottles & Containers Growth
Several key factors are driving the growth of the PET bottles and containers market. The escalating global demand for packaged beverages and convenience foods, fueled by population growth and urbanization, is a primary driver. Technological advancements in PET manufacturing, leading to lighter, stronger, and more functional packaging, are also contributing significantly. The increasing consumer preference for sustainable packaging solutions, including the use of recycled PET (rPET) and the development of circular economy models, is creating new market opportunities. Furthermore, favorable regulatory environments in many regions that support plastic recycling and the use of recycled content are acting as catalysts for market expansion. The cost-effectiveness and versatility of PET compared to other packaging materials ensure its continued adoption across various industries.
Challenges in the PET Bottles & Containers Sector
Despite strong growth, the PET bottles and containers sector faces several challenges. Growing environmental concerns and increased public scrutiny regarding plastic waste management are leading to stricter regulations and potential bans on certain single-use plastics in some regions. Volatility in raw material prices, particularly for petroleum-based feedstocks, can impact production costs and profitability. The competitive pressure from alternative packaging materials, such as glass, aluminum, and paper-based packaging, remains a constant challenge. Supply chain disruptions, geopolitical uncertainties, and evolving consumer preferences for minimal or alternative packaging also pose significant hurdles. Ensuring effective and scalable recycling infrastructure globally remains a critical challenge for achieving true circularity.
Leading Players in the PET Bottles & Containers Market
- ALPLA
- Amcor
- Plastipak Packaging
- Graham Packaging
- RPC
- Berry Plastics
- Greiner Packaging
- Alpha Packaging
- Zijiang
- Visy
- Zhongfu
- XLZT
- Polycon Industries
- KW Plastics
- Boxmore Packaging
Key Developments in PET Bottles & Containers Sector
- 2023: Amcor launches a new range of PET bottles made from 100% recycled content for the beverages sector.
- 2023: ALPLA announces significant investment in advanced rPET recycling facilities to increase its recycled plastic output.
- 2023: Plastipak Packaging expands its global footprint with a new manufacturing plant in Southeast Asia to meet growing demand for PET containers.
- 2024: Berry Plastics acquires a specialized packaging manufacturer to enhance its portfolio in the pharmaceutical packaging segment.
- 2024: Greiner Packaging develops innovative lightweight PET containers with improved recyclability features.
- 2024: Graham Packaging invests in advanced blow molding technology to improve energy efficiency and reduce production cycle times.
- 2024: Alpha Packaging focuses on sustainable solutions, including rPET and mono-material packaging designs.
- 2025: Zijiang and Visy collaborate on developing closed-loop recycling initiatives for PET packaging in the Asia-Pacific region.
- 2025: Zhongfu and XLZT announce a strategic partnership to develop innovative barrier PET solutions for extended shelf-life food applications.
- 2025: Polycon Industries and KW Plastics explore advanced chemical recycling technologies to enhance rPET availability.
- 2025: Boxmore Packaging invests in digitalization and automation to optimize its PET bottle and container production processes.
Strategic PET Bottles & Containers Market Outlook
The strategic outlook for the PET bottles and containers market is characterized by a strong emphasis on sustainability and innovation. Growth accelerators include the increasing adoption of recycled PET (rPET) and the development of advanced recycling technologies that will further enhance the circularity of PET. Manufacturers are expected to focus on lightweighting and material reduction strategies to minimize environmental impact and costs. The market will also witness continued innovation in product design, offering enhanced functionality and consumer appeal. Expanding into emerging markets, particularly in Asia and Africa, presents significant growth potential. Strategic partnerships and collaborations between value chain participants will be crucial for addressing sustainability challenges and driving market growth. The market is well-positioned for continued expansion, driven by the enduring demand for convenient, safe, and increasingly sustainable packaging solutions.
PET Bottles & Containers Segmentation
-
1. Application
- 1.1. Beverages and Food
- 1.2. Pharmaceutical
- 1.3. FMCG
- 1.4. Others
-
2. Types
- 2.1. Colorful Type
- 2.2. Transparent Type
PET Bottles & Containers Segmentation By Geography
-
1. North America
- 1.1. United States
- 1.2. Canada
- 1.3. Mexico
-
2. South America
- 2.1. Brazil
- 2.2. Argentina
- 2.3. Rest of South America
-
3. Europe
- 3.1. United Kingdom
- 3.2. Germany
- 3.3. France
- 3.4. Italy
- 3.5. Spain
- 3.6. Russia
- 3.7. Benelux
- 3.8. Nordics
- 3.9. Rest of Europe
-
4. Middle East & Africa
- 4.1. Turkey
- 4.2. Israel
- 4.3. GCC
- 4.4. North Africa
- 4.5. South Africa
- 4.6. Rest of Middle East & Africa
-
5. Asia Pacific
- 5.1. China
- 5.2. India
- 5.3. Japan
- 5.4. South Korea
- 5.5. ASEAN
- 5.6. Oceania
- 5.7. Rest of Asia Pacific
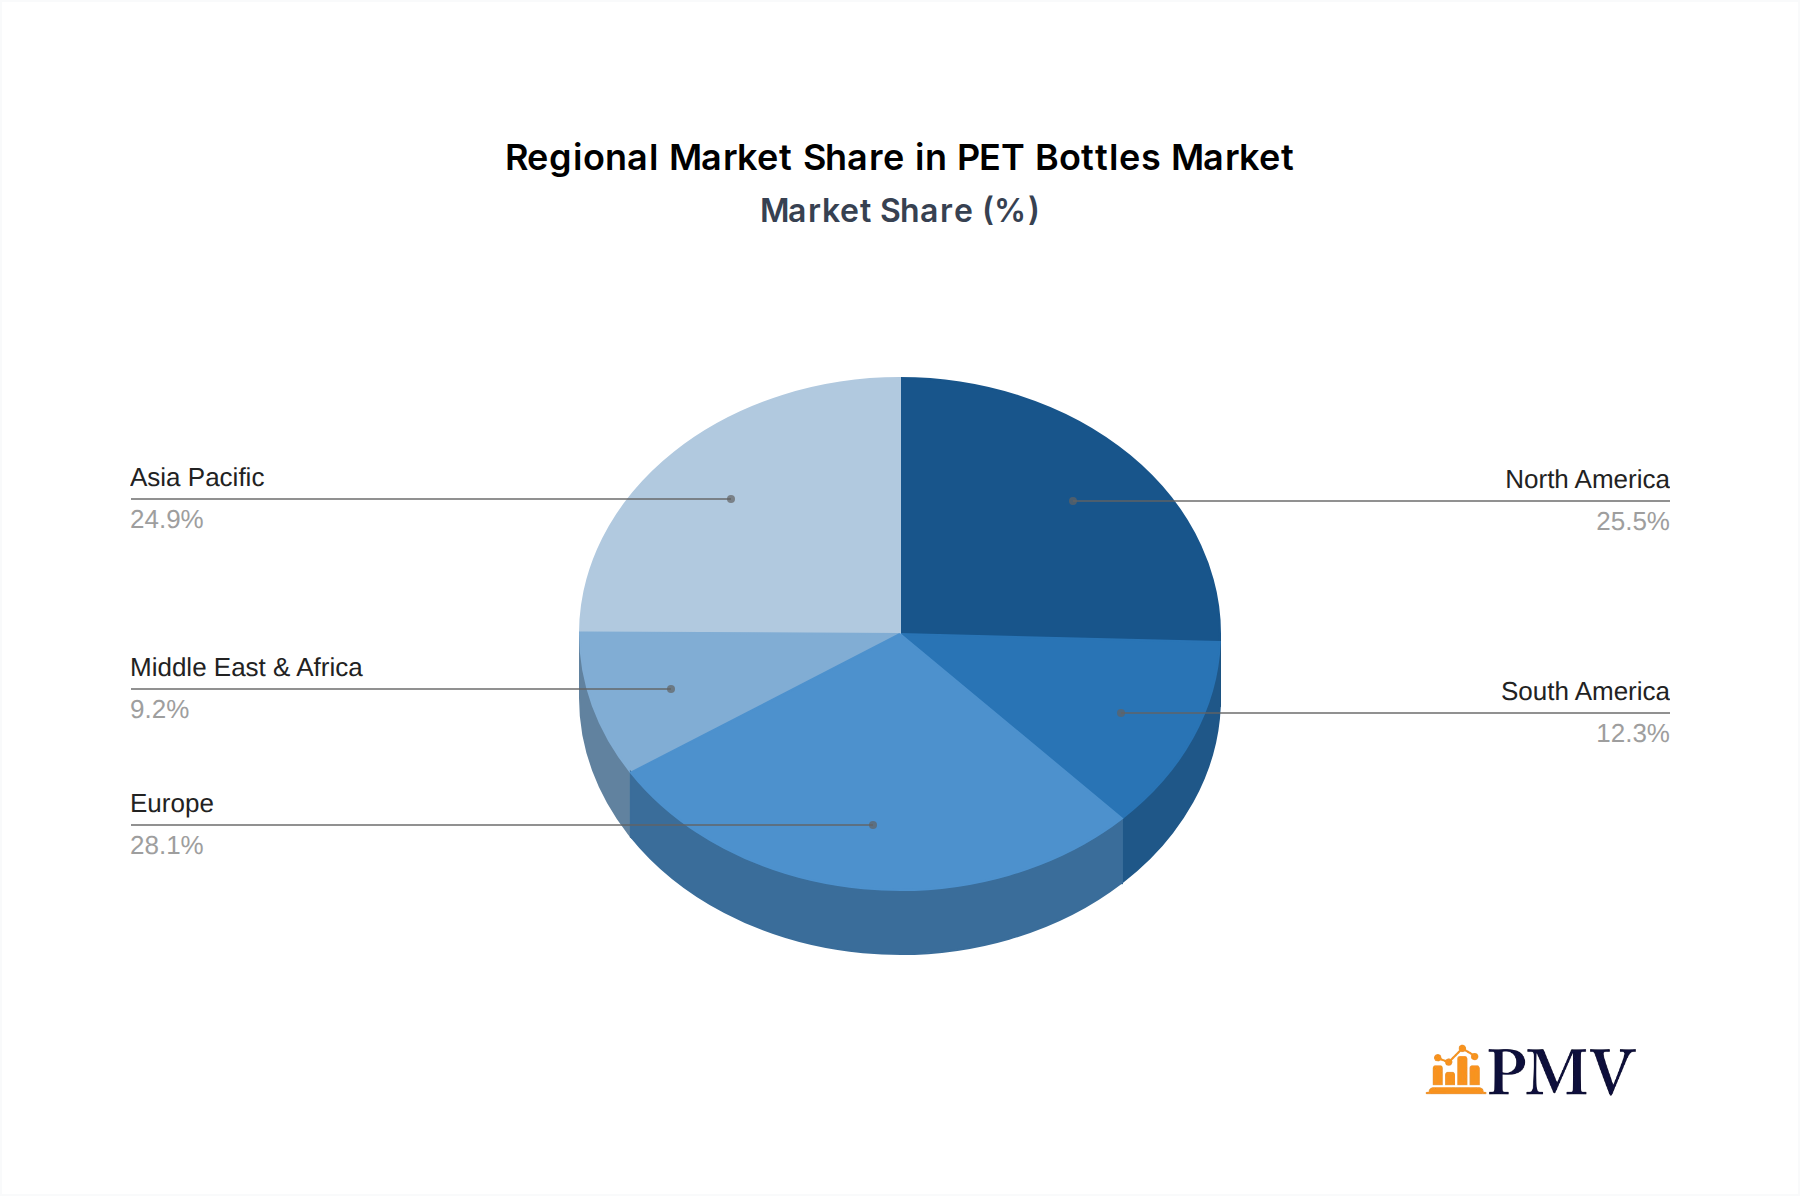
PET Bottles & Containers Regional Market Share
Geographic Coverage of PET Bottles & Containers
PET Bottles & Containers REPORT HIGHLIGHTS
| Aspects | Details |
|---|---|
| Study Period | 2020-2034 |
| Base Year | 2025 |
| Estimated Year | 2026 |
| Forecast Period | 2026-2034 |
| Historical Period | 2020-2025 |
| Growth Rate | CAGR of 3.8% from 2020-2034 |
| Segmentation |
|
Table of Contents
- 1. Introduction
- 1.1. Research Scope
- 1.2. Market Segmentation
- 1.3. Research Objective
- 1.4. Definitions and Assumptions
- 2. Executive Summary
- 2.1. Market Snapshot
- 3. Market Dynamics
- 3.1. Market Drivers
- 3.2. Market Restrains
- 3.3. Market Trends
- 3.4. Market Opportunities
- 4. Market Factor Analysis
- 4.1. Porters Five Forces
- 4.1.1. Bargaining Power of Suppliers
- 4.1.2. Bargaining Power of Buyers
- 4.1.3. Threat of New Entrants
- 4.1.4. Threat of Substitutes
- 4.1.5. Competitive Rivalry
- 4.2. PESTEL analysis
- 4.3. BCG Analysis
- 4.3.1. Stars (High Growth, High Market Share)
- 4.3.2. Cash Cows (Low Growth, High Market Share)
- 4.3.3. Question Mark (High Growth, Low Market Share)
- 4.3.4. Dogs (Low Growth, Low Market Share)
- 4.4. Ansoff Matrix Analysis
- 4.5. Supply Chain Analysis
- 4.6. Regulatory Landscape
- 4.7. Current Market Potential and Opportunity Assessment (TAM–SAM–SOM Framework)
- 4.8. PMV Analyst Note
- 4.1. Porters Five Forces
- 5. Market Analysis, Insights and Forecast 2021-2033
- 5.1. Market Analysis, Insights and Forecast - by Application
- 5.1.1. Beverages and Food
- 5.1.2. Pharmaceutical
- 5.1.3. FMCG
- 5.1.4. Others
- 5.2. Market Analysis, Insights and Forecast - by Types
- 5.2.1. Colorful Type
- 5.2.2. Transparent Type
- 5.3. Market Analysis, Insights and Forecast - by Region
- 5.3.1. North America
- 5.3.2. South America
- 5.3.3. Europe
- 5.3.4. Middle East & Africa
- 5.3.5. Asia Pacific
- 5.1. Market Analysis, Insights and Forecast - by Application
- 6. Global PET Bottles & Containers Analysis, Insights and Forecast, 2021-2033
- 6.1. Market Analysis, Insights and Forecast - by Application
- 6.1.1. Beverages and Food
- 6.1.2. Pharmaceutical
- 6.1.3. FMCG
- 6.1.4. Others
- 6.2. Market Analysis, Insights and Forecast - by Types
- 6.2.1. Colorful Type
- 6.2.2. Transparent Type
- 6.1. Market Analysis, Insights and Forecast - by Application
- 7. North America PET Bottles & Containers Analysis, Insights and Forecast, 2020-2032
- 7.1. Market Analysis, Insights and Forecast - by Application
- 7.1.1. Beverages and Food
- 7.1.2. Pharmaceutical
- 7.1.3. FMCG
- 7.1.4. Others
- 7.2. Market Analysis, Insights and Forecast - by Types
- 7.2.1. Colorful Type
- 7.2.2. Transparent Type
- 7.1. Market Analysis, Insights and Forecast - by Application
- 8. South America PET Bottles & Containers Analysis, Insights and Forecast, 2020-2032
- 8.1. Market Analysis, Insights and Forecast - by Application
- 8.1.1. Beverages and Food
- 8.1.2. Pharmaceutical
- 8.1.3. FMCG
- 8.1.4. Others
- 8.2. Market Analysis, Insights and Forecast - by Types
- 8.2.1. Colorful Type
- 8.2.2. Transparent Type
- 8.1. Market Analysis, Insights and Forecast - by Application
- 9. Europe PET Bottles & Containers Analysis, Insights and Forecast, 2020-2032
- 9.1. Market Analysis, Insights and Forecast - by Application
- 9.1.1. Beverages and Food
- 9.1.2. Pharmaceutical
- 9.1.3. FMCG
- 9.1.4. Others
- 9.2. Market Analysis, Insights and Forecast - by Types
- 9.2.1. Colorful Type
- 9.2.2. Transparent Type
- 9.1. Market Analysis, Insights and Forecast - by Application
- 10. Middle East & Africa PET Bottles & Containers Analysis, Insights and Forecast, 2020-2032
- 10.1. Market Analysis, Insights and Forecast - by Application
- 10.1.1. Beverages and Food
- 10.1.2. Pharmaceutical
- 10.1.3. FMCG
- 10.1.4. Others
- 10.2. Market Analysis, Insights and Forecast - by Types
- 10.2.1. Colorful Type
- 10.2.2. Transparent Type
- 10.1. Market Analysis, Insights and Forecast - by Application
- 11. Asia Pacific PET Bottles & Containers Analysis, Insights and Forecast, 2020-2032
- 11.1. Market Analysis, Insights and Forecast - by Application
- 11.1.1. Beverages and Food
- 11.1.2. Pharmaceutical
- 11.1.3. FMCG
- 11.1.4. Others
- 11.2. Market Analysis, Insights and Forecast - by Types
- 11.2.1. Colorful Type
- 11.2.2. Transparent Type
- 11.1. Market Analysis, Insights and Forecast - by Application
- 12. Competitive Analysis
- 12.1. Company Profiles
- 12.1.1 ALPLA
- 12.1.1.1. Company Overview
- 12.1.1.2. Products
- 12.1.1.3. Company Financials
- 12.1.1.4. SWOT Analysis
- 12.1.2 Amcor
- 12.1.2.1. Company Overview
- 12.1.2.2. Products
- 12.1.2.3. Company Financials
- 12.1.2.4. SWOT Analysis
- 12.1.3 Plastipak Packaging
- 12.1.3.1. Company Overview
- 12.1.3.2. Products
- 12.1.3.3. Company Financials
- 12.1.3.4. SWOT Analysis
- 12.1.4 Graham Packaging
- 12.1.4.1. Company Overview
- 12.1.4.2. Products
- 12.1.4.3. Company Financials
- 12.1.4.4. SWOT Analysis
- 12.1.5 RPC
- 12.1.5.1. Company Overview
- 12.1.5.2. Products
- 12.1.5.3. Company Financials
- 12.1.5.4. SWOT Analysis
- 12.1.6 Berry Plastics
- 12.1.6.1. Company Overview
- 12.1.6.2. Products
- 12.1.6.3. Company Financials
- 12.1.6.4. SWOT Analysis
- 12.1.7 Greiner Packaging
- 12.1.7.1. Company Overview
- 12.1.7.2. Products
- 12.1.7.3. Company Financials
- 12.1.7.4. SWOT Analysis
- 12.1.8 Alpha Packaging
- 12.1.8.1. Company Overview
- 12.1.8.2. Products
- 12.1.8.3. Company Financials
- 12.1.8.4. SWOT Analysis
- 12.1.9 Zijiang
- 12.1.9.1. Company Overview
- 12.1.9.2. Products
- 12.1.9.3. Company Financials
- 12.1.9.4. SWOT Analysis
- 12.1.10 Visy
- 12.1.10.1. Company Overview
- 12.1.10.2. Products
- 12.1.10.3. Company Financials
- 12.1.10.4. SWOT Analysis
- 12.1.11 Zhongfu
- 12.1.11.1. Company Overview
- 12.1.11.2. Products
- 12.1.11.3. Company Financials
- 12.1.11.4. SWOT Analysis
- 12.1.12 XLZT
- 12.1.12.1. Company Overview
- 12.1.12.2. Products
- 12.1.12.3. Company Financials
- 12.1.12.4. SWOT Analysis
- 12.1.13 Polycon Industries
- 12.1.13.1. Company Overview
- 12.1.13.2. Products
- 12.1.13.3. Company Financials
- 12.1.13.4. SWOT Analysis
- 12.1.14 KW Plastics
- 12.1.14.1. Company Overview
- 12.1.14.2. Products
- 12.1.14.3. Company Financials
- 12.1.14.4. SWOT Analysis
- 12.1.15 Boxmore Packaging
- 12.1.15.1. Company Overview
- 12.1.15.2. Products
- 12.1.15.3. Company Financials
- 12.1.15.4. SWOT Analysis
- 12.1.1 ALPLA
- 12.2. Market Entropy
- 12.2.1 Company's Key Areas Served
- 12.2.2 Recent Developments
- 12.3. Company Market Share Analysis 2025
- 12.3.1 Top 5 Companies Market Share Analysis
- 12.3.2 Top 3 Companies Market Share Analysis
- 12.4. List of Potential Customers
- 13. Research Methodology
List of Figures
- Figure 1: Global PET Bottles & Containers Revenue Breakdown (billion, %) by Region 2025 & 2033
- Figure 2: Global PET Bottles & Containers Volume Breakdown (K, %) by Region 2025 & 2033
- Figure 3: North America PET Bottles & Containers Revenue (billion), by Application 2025 & 2033
- Figure 4: North America PET Bottles & Containers Volume (K), by Application 2025 & 2033
- Figure 5: North America PET Bottles & Containers Revenue Share (%), by Application 2025 & 2033
- Figure 6: North America PET Bottles & Containers Volume Share (%), by Application 2025 & 2033
- Figure 7: North America PET Bottles & Containers Revenue (billion), by Types 2025 & 2033
- Figure 8: North America PET Bottles & Containers Volume (K), by Types 2025 & 2033
- Figure 9: North America PET Bottles & Containers Revenue Share (%), by Types 2025 & 2033
- Figure 10: North America PET Bottles & Containers Volume Share (%), by Types 2025 & 2033
- Figure 11: North America PET Bottles & Containers Revenue (billion), by Country 2025 & 2033
- Figure 12: North America PET Bottles & Containers Volume (K), by Country 2025 & 2033
- Figure 13: North America PET Bottles & Containers Revenue Share (%), by Country 2025 & 2033
- Figure 14: North America PET Bottles & Containers Volume Share (%), by Country 2025 & 2033
- Figure 15: South America PET Bottles & Containers Revenue (billion), by Application 2025 & 2033
- Figure 16: South America PET Bottles & Containers Volume (K), by Application 2025 & 2033
- Figure 17: South America PET Bottles & Containers Revenue Share (%), by Application 2025 & 2033
- Figure 18: South America PET Bottles & Containers Volume Share (%), by Application 2025 & 2033
- Figure 19: South America PET Bottles & Containers Revenue (billion), by Types 2025 & 2033
- Figure 20: South America PET Bottles & Containers Volume (K), by Types 2025 & 2033
- Figure 21: South America PET Bottles & Containers Revenue Share (%), by Types 2025 & 2033
- Figure 22: South America PET Bottles & Containers Volume Share (%), by Types 2025 & 2033
- Figure 23: South America PET Bottles & Containers Revenue (billion), by Country 2025 & 2033
- Figure 24: South America PET Bottles & Containers Volume (K), by Country 2025 & 2033
- Figure 25: South America PET Bottles & Containers Revenue Share (%), by Country 2025 & 2033
- Figure 26: South America PET Bottles & Containers Volume Share (%), by Country 2025 & 2033
- Figure 27: Europe PET Bottles & Containers Revenue (billion), by Application 2025 & 2033
- Figure 28: Europe PET Bottles & Containers Volume (K), by Application 2025 & 2033
- Figure 29: Europe PET Bottles & Containers Revenue Share (%), by Application 2025 & 2033
- Figure 30: Europe PET Bottles & Containers Volume Share (%), by Application 2025 & 2033
- Figure 31: Europe PET Bottles & Containers Revenue (billion), by Types 2025 & 2033
- Figure 32: Europe PET Bottles & Containers Volume (K), by Types 2025 & 2033
- Figure 33: Europe PET Bottles & Containers Revenue Share (%), by Types 2025 & 2033
- Figure 34: Europe PET Bottles & Containers Volume Share (%), by Types 2025 & 2033
- Figure 35: Europe PET Bottles & Containers Revenue (billion), by Country 2025 & 2033
- Figure 36: Europe PET Bottles & Containers Volume (K), by Country 2025 & 2033
- Figure 37: Europe PET Bottles & Containers Revenue Share (%), by Country 2025 & 2033
- Figure 38: Europe PET Bottles & Containers Volume Share (%), by Country 2025 & 2033
- Figure 39: Middle East & Africa PET Bottles & Containers Revenue (billion), by Application 2025 & 2033
- Figure 40: Middle East & Africa PET Bottles & Containers Volume (K), by Application 2025 & 2033
- Figure 41: Middle East & Africa PET Bottles & Containers Revenue Share (%), by Application 2025 & 2033
- Figure 42: Middle East & Africa PET Bottles & Containers Volume Share (%), by Application 2025 & 2033
- Figure 43: Middle East & Africa PET Bottles & Containers Revenue (billion), by Types 2025 & 2033
- Figure 44: Middle East & Africa PET Bottles & Containers Volume (K), by Types 2025 & 2033
- Figure 45: Middle East & Africa PET Bottles & Containers Revenue Share (%), by Types 2025 & 2033
- Figure 46: Middle East & Africa PET Bottles & Containers Volume Share (%), by Types 2025 & 2033
- Figure 47: Middle East & Africa PET Bottles & Containers Revenue (billion), by Country 2025 & 2033
- Figure 48: Middle East & Africa PET Bottles & Containers Volume (K), by Country 2025 & 2033
- Figure 49: Middle East & Africa PET Bottles & Containers Revenue Share (%), by Country 2025 & 2033
- Figure 50: Middle East & Africa PET Bottles & Containers Volume Share (%), by Country 2025 & 2033
- Figure 51: Asia Pacific PET Bottles & Containers Revenue (billion), by Application 2025 & 2033
- Figure 52: Asia Pacific PET Bottles & Containers Volume (K), by Application 2025 & 2033
- Figure 53: Asia Pacific PET Bottles & Containers Revenue Share (%), by Application 2025 & 2033
- Figure 54: Asia Pacific PET Bottles & Containers Volume Share (%), by Application 2025 & 2033
- Figure 55: Asia Pacific PET Bottles & Containers Revenue (billion), by Types 2025 & 2033
- Figure 56: Asia Pacific PET Bottles & Containers Volume (K), by Types 2025 & 2033
- Figure 57: Asia Pacific PET Bottles & Containers Revenue Share (%), by Types 2025 & 2033
- Figure 58: Asia Pacific PET Bottles & Containers Volume Share (%), by Types 2025 & 2033
- Figure 59: Asia Pacific PET Bottles & Containers Revenue (billion), by Country 2025 & 2033
- Figure 60: Asia Pacific PET Bottles & Containers Volume (K), by Country 2025 & 2033
- Figure 61: Asia Pacific PET Bottles & Containers Revenue Share (%), by Country 2025 & 2033
- Figure 62: Asia Pacific PET Bottles & Containers Volume Share (%), by Country 2025 & 2033
List of Tables
- Table 1: Global PET Bottles & Containers Revenue billion Forecast, by Application 2020 & 2033
- Table 2: Global PET Bottles & Containers Volume K Forecast, by Application 2020 & 2033
- Table 3: Global PET Bottles & Containers Revenue billion Forecast, by Types 2020 & 2033
- Table 4: Global PET Bottles & Containers Volume K Forecast, by Types 2020 & 2033
- Table 5: Global PET Bottles & Containers Revenue billion Forecast, by Region 2020 & 2033
- Table 6: Global PET Bottles & Containers Volume K Forecast, by Region 2020 & 2033
- Table 7: Global PET Bottles & Containers Revenue billion Forecast, by Application 2020 & 2033
- Table 8: Global PET Bottles & Containers Volume K Forecast, by Application 2020 & 2033
- Table 9: Global PET Bottles & Containers Revenue billion Forecast, by Types 2020 & 2033
- Table 10: Global PET Bottles & Containers Volume K Forecast, by Types 2020 & 2033
- Table 11: Global PET Bottles & Containers Revenue billion Forecast, by Country 2020 & 2033
- Table 12: Global PET Bottles & Containers Volume K Forecast, by Country 2020 & 2033
- Table 13: United States PET Bottles & Containers Revenue (billion) Forecast, by Application 2020 & 2033
- Table 14: United States PET Bottles & Containers Volume (K) Forecast, by Application 2020 & 2033
- Table 15: Canada PET Bottles & Containers Revenue (billion) Forecast, by Application 2020 & 2033
- Table 16: Canada PET Bottles & Containers Volume (K) Forecast, by Application 2020 & 2033
- Table 17: Mexico PET Bottles & Containers Revenue (billion) Forecast, by Application 2020 & 2033
- Table 18: Mexico PET Bottles & Containers Volume (K) Forecast, by Application 2020 & 2033
- Table 19: Global PET Bottles & Containers Revenue billion Forecast, by Application 2020 & 2033
- Table 20: Global PET Bottles & Containers Volume K Forecast, by Application 2020 & 2033
- Table 21: Global PET Bottles & Containers Revenue billion Forecast, by Types 2020 & 2033
- Table 22: Global PET Bottles & Containers Volume K Forecast, by Types 2020 & 2033
- Table 23: Global PET Bottles & Containers Revenue billion Forecast, by Country 2020 & 2033
- Table 24: Global PET Bottles & Containers Volume K Forecast, by Country 2020 & 2033
- Table 25: Brazil PET Bottles & Containers Revenue (billion) Forecast, by Application 2020 & 2033
- Table 26: Brazil PET Bottles & Containers Volume (K) Forecast, by Application 2020 & 2033
- Table 27: Argentina PET Bottles & Containers Revenue (billion) Forecast, by Application 2020 & 2033
- Table 28: Argentina PET Bottles & Containers Volume (K) Forecast, by Application 2020 & 2033
- Table 29: Rest of South America PET Bottles & Containers Revenue (billion) Forecast, by Application 2020 & 2033
- Table 30: Rest of South America PET Bottles & Containers Volume (K) Forecast, by Application 2020 & 2033
- Table 31: Global PET Bottles & Containers Revenue billion Forecast, by Application 2020 & 2033
- Table 32: Global PET Bottles & Containers Volume K Forecast, by Application 2020 & 2033
- Table 33: Global PET Bottles & Containers Revenue billion Forecast, by Types 2020 & 2033
- Table 34: Global PET Bottles & Containers Volume K Forecast, by Types 2020 & 2033
- Table 35: Global PET Bottles & Containers Revenue billion Forecast, by Country 2020 & 2033
- Table 36: Global PET Bottles & Containers Volume K Forecast, by Country 2020 & 2033
- Table 37: United Kingdom PET Bottles & Containers Revenue (billion) Forecast, by Application 2020 & 2033
- Table 38: United Kingdom PET Bottles & Containers Volume (K) Forecast, by Application 2020 & 2033
- Table 39: Germany PET Bottles & Containers Revenue (billion) Forecast, by Application 2020 & 2033
- Table 40: Germany PET Bottles & Containers Volume (K) Forecast, by Application 2020 & 2033
- Table 41: France PET Bottles & Containers Revenue (billion) Forecast, by Application 2020 & 2033
- Table 42: France PET Bottles & Containers Volume (K) Forecast, by Application 2020 & 2033
- Table 43: Italy PET Bottles & Containers Revenue (billion) Forecast, by Application 2020 & 2033
- Table 44: Italy PET Bottles & Containers Volume (K) Forecast, by Application 2020 & 2033
- Table 45: Spain PET Bottles & Containers Revenue (billion) Forecast, by Application 2020 & 2033
- Table 46: Spain PET Bottles & Containers Volume (K) Forecast, by Application 2020 & 2033
- Table 47: Russia PET Bottles & Containers Revenue (billion) Forecast, by Application 2020 & 2033
- Table 48: Russia PET Bottles & Containers Volume (K) Forecast, by Application 2020 & 2033
- Table 49: Benelux PET Bottles & Containers Revenue (billion) Forecast, by Application 2020 & 2033
- Table 50: Benelux PET Bottles & Containers Volume (K) Forecast, by Application 2020 & 2033
- Table 51: Nordics PET Bottles & Containers Revenue (billion) Forecast, by Application 2020 & 2033
- Table 52: Nordics PET Bottles & Containers Volume (K) Forecast, by Application 2020 & 2033
- Table 53: Rest of Europe PET Bottles & Containers Revenue (billion) Forecast, by Application 2020 & 2033
- Table 54: Rest of Europe PET Bottles & Containers Volume (K) Forecast, by Application 2020 & 2033
- Table 55: Global PET Bottles & Containers Revenue billion Forecast, by Application 2020 & 2033
- Table 56: Global PET Bottles & Containers Volume K Forecast, by Application 2020 & 2033
- Table 57: Global PET Bottles & Containers Revenue billion Forecast, by Types 2020 & 2033
- Table 58: Global PET Bottles & Containers Volume K Forecast, by Types 2020 & 2033
- Table 59: Global PET Bottles & Containers Revenue billion Forecast, by Country 2020 & 2033
- Table 60: Global PET Bottles & Containers Volume K Forecast, by Country 2020 & 2033
- Table 61: Turkey PET Bottles & Containers Revenue (billion) Forecast, by Application 2020 & 2033
- Table 62: Turkey PET Bottles & Containers Volume (K) Forecast, by Application 2020 & 2033
- Table 63: Israel PET Bottles & Containers Revenue (billion) Forecast, by Application 2020 & 2033
- Table 64: Israel PET Bottles & Containers Volume (K) Forecast, by Application 2020 & 2033
- Table 65: GCC PET Bottles & Containers Revenue (billion) Forecast, by Application 2020 & 2033
- Table 66: GCC PET Bottles & Containers Volume (K) Forecast, by Application 2020 & 2033
- Table 67: North Africa PET Bottles & Containers Revenue (billion) Forecast, by Application 2020 & 2033
- Table 68: North Africa PET Bottles & Containers Volume (K) Forecast, by Application 2020 & 2033
- Table 69: South Africa PET Bottles & Containers Revenue (billion) Forecast, by Application 2020 & 2033
- Table 70: South Africa PET Bottles & Containers Volume (K) Forecast, by Application 2020 & 2033
- Table 71: Rest of Middle East & Africa PET Bottles & Containers Revenue (billion) Forecast, by Application 2020 & 2033
- Table 72: Rest of Middle East & Africa PET Bottles & Containers Volume (K) Forecast, by Application 2020 & 2033
- Table 73: Global PET Bottles & Containers Revenue billion Forecast, by Application 2020 & 2033
- Table 74: Global PET Bottles & Containers Volume K Forecast, by Application 2020 & 2033
- Table 75: Global PET Bottles & Containers Revenue billion Forecast, by Types 2020 & 2033
- Table 76: Global PET Bottles & Containers Volume K Forecast, by Types 2020 & 2033
- Table 77: Global PET Bottles & Containers Revenue billion Forecast, by Country 2020 & 2033
- Table 78: Global PET Bottles & Containers Volume K Forecast, by Country 2020 & 2033
- Table 79: China PET Bottles & Containers Revenue (billion) Forecast, by Application 2020 & 2033
- Table 80: China PET Bottles & Containers Volume (K) Forecast, by Application 2020 & 2033
- Table 81: India PET Bottles & Containers Revenue (billion) Forecast, by Application 2020 & 2033
- Table 82: India PET Bottles & Containers Volume (K) Forecast, by Application 2020 & 2033
- Table 83: Japan PET Bottles & Containers Revenue (billion) Forecast, by Application 2020 & 2033
- Table 84: Japan PET Bottles & Containers Volume (K) Forecast, by Application 2020 & 2033
- Table 85: South Korea PET Bottles & Containers Revenue (billion) Forecast, by Application 2020 & 2033
- Table 86: South Korea PET Bottles & Containers Volume (K) Forecast, by Application 2020 & 2033
- Table 87: ASEAN PET Bottles & Containers Revenue (billion) Forecast, by Application 2020 & 2033
- Table 88: ASEAN PET Bottles & Containers Volume (K) Forecast, by Application 2020 & 2033
- Table 89: Oceania PET Bottles & Containers Revenue (billion) Forecast, by Application 2020 & 2033
- Table 90: Oceania PET Bottles & Containers Volume (K) Forecast, by Application 2020 & 2033
- Table 91: Rest of Asia Pacific PET Bottles & Containers Revenue (billion) Forecast, by Application 2020 & 2033
- Table 92: Rest of Asia Pacific PET Bottles & Containers Volume (K) Forecast, by Application 2020 & 2033
Frequently Asked Questions
1. What is the projected Compound Annual Growth Rate (CAGR) of the PET Bottles & Containers?
The projected CAGR is approximately 3.8%.
2. Which companies are prominent players in the PET Bottles & Containers?
Key companies in the market include ALPLA, Amcor, Plastipak Packaging, Graham Packaging, RPC, Berry Plastics, Greiner Packaging, Alpha Packaging, Zijiang, Visy, Zhongfu, XLZT, Polycon Industries, KW Plastics, Boxmore Packaging.
3. What are the main segments of the PET Bottles & Containers?
The market segments include Application, Types.
4. Can you provide details about the market size?
The market size is estimated to be USD 73.2 billion as of 2022.
5. What are some drivers contributing to market growth?
N/A
6. What are the notable trends driving market growth?
N/A
7. Are there any restraints impacting market growth?
N/A
8. Can you provide examples of recent developments in the market?
N/A
9. What pricing options are available for accessing the report?
Pricing options include single-user, multi-user, and enterprise licenses priced at USD 3350.00, USD 5025.00, and USD 6700.00 respectively.
10. Is the market size provided in terms of value or volume?
The market size is provided in terms of value, measured in billion and volume, measured in K.
11. Are there any specific market keywords associated with the report?
Yes, the market keyword associated with the report is "PET Bottles & Containers," which aids in identifying and referencing the specific market segment covered.
12. How do I determine which pricing option suits my needs best?
The pricing options vary based on user requirements and access needs. Individual users may opt for single-user licenses, while businesses requiring broader access may choose multi-user or enterprise licenses for cost-effective access to the report.
13. Are there any additional resources or data provided in the PET Bottles & Containers report?
While the report offers comprehensive insights, it's advisable to review the specific contents or supplementary materials provided to ascertain if additional resources or data are available.
14. How can I stay updated on further developments or reports in the PET Bottles & Containers?
To stay informed about further developments, trends, and reports in the PET Bottles & Containers, consider subscribing to industry newsletters, following relevant companies and organizations, or regularly checking reputable industry news sources and publications.
Methodology
Step 1 - Identification of Relevant Samples Size from Population Database


Step 2 - Approaches for Defining Global Market Size (Value, Volume* & Price*)

Note*: In applicable scenarios
Step 3 - Data Sources
Primary Research
- Web Analytics
- Survey Reports
- Research Institute
- Latest Research Reports
- Opinion Leaders
Secondary Research
- Annual Reports
- White Paper
- Latest Press Release
- Industry Association
- Paid Database
- Investor Presentations

Step 4 - Data Triangulation
Involves using different sources of information in order to increase the validity of a study
These sources are likely to be stakeholders in a program - participants, other researchers, program staff, other community members, and so on.
Then we put all data in single framework & apply various statistical tools to find out the dynamic on the market.
During the analysis stage, feedback from the stakeholder groups would be compared to determine areas of agreement as well as areas of divergence

