Key Insights
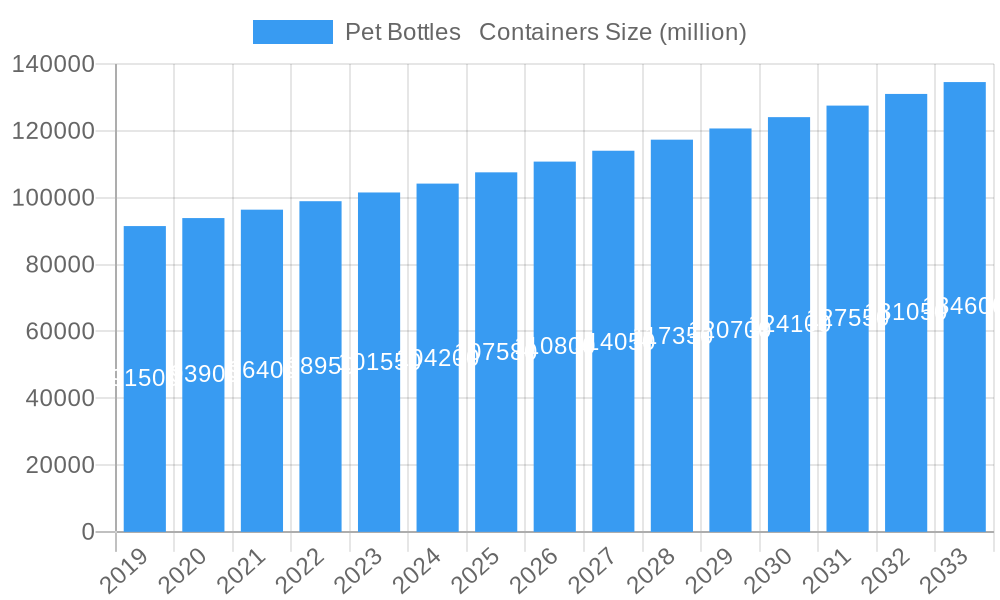
The global PET bottles and containers market is poised for robust growth, projected to reach a substantial market size of USD 107,580 million by 2025, with a Compound Annual Growth Rate (CAGR) of 4.4% through the forecast period of 2025-2033. This expansion is largely driven by the escalating demand from the beverages and food sector, which constitutes a significant application segment, benefiting from increasing consumer consumption and the convenience offered by PET packaging. The pharmaceutical industry also plays a crucial role, leveraging PET's excellent barrier properties and inertness for safe storage and transportation of medicines. Furthermore, the widespread use of PET bottles and containers in the Fast-Moving Consumer Goods (FMCG) sector, encompassing a vast array of products from personal care to household items, underpins this market's steady upward trajectory. The growing emphasis on lightweight, durable, and cost-effective packaging solutions worldwide continues to fuel the adoption of PET.
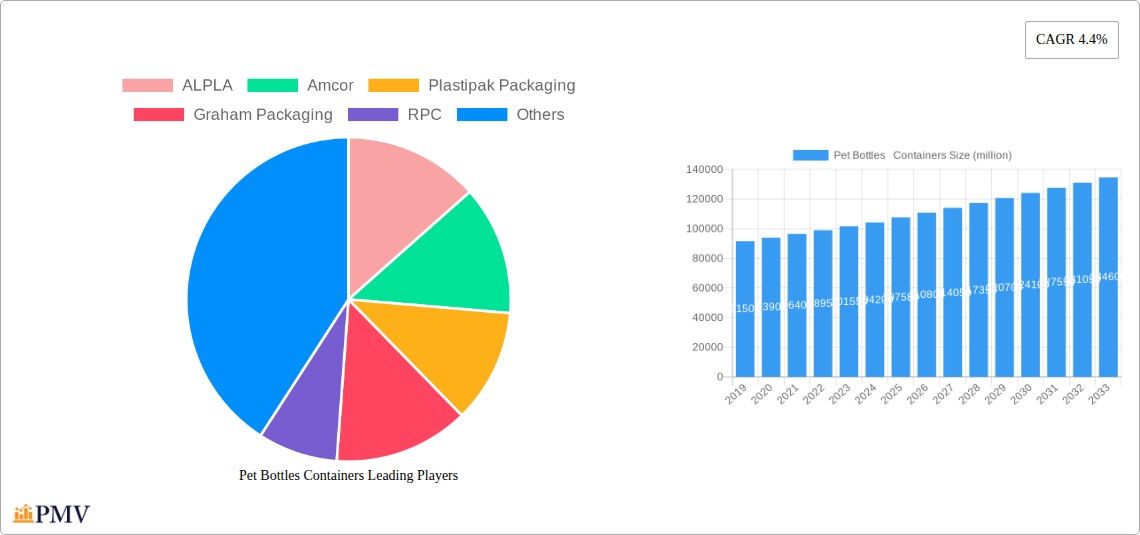
Pet Bottles Containers Market Size (In Billion)
The market is characterized by distinct trends, including a growing preference for colorful PET containers, which enhance product appeal and brand differentiation, alongside the continued dominance of transparent PET containers for their versatility and visibility. Innovation in manufacturing processes and material science is expected to further drive growth, focusing on enhanced recyclability and sustainability. However, certain restraints, such as fluctuating raw material prices and increasing regulatory scrutiny concerning plastic waste, present challenges. Despite these, the market is demonstrating resilience, with companies like ALPLA, Amcor, and Plastipak Packaging actively investing in capacity expansion and sustainable packaging solutions. The Asia Pacific region, led by China and India, is anticipated to be a key growth engine, driven by burgeoning populations and expanding industrial sectors. North America and Europe, while mature markets, continue to show steady demand driven by sophisticated consumer preferences and a strong focus on recycling initiatives.
Pet Bottles Containers Company Market Share
Unlocking Growth: Comprehensive Analysis of the Global Pet Bottles Containers Market (2019-2033)
This in-depth report delivers an exhaustive analysis of the global Pet Bottles Containers market, meticulously covering market dynamics, trends, growth drivers, challenges, and competitive landscapes from 2019 to 2033. With a base year of 2025 and a forecast period extending to 2033, this study provides critical insights for stakeholders seeking to navigate this dynamic industry. Our analysis leverages extensive data and expert intelligence to offer actionable strategies and a clear market outlook.
Pet Bottles Containers Market Structure & Competitive Dynamics
The global Pet Bottles Containers market exhibits a moderately concentrated structure, with key players like ALPLA, Amcor, and Plastipak Packaging holding substantial market share, estimated to be between 15-20% each. The innovation ecosystem is vibrant, driven by increasing demand for sustainable packaging solutions and advancements in lightweighting technologies. Regulatory frameworks are evolving, with a growing emphasis on recyclability and reduced plastic waste, impacting product design and material choices. Product substitutes, such as glass and aluminum, pose a competitive threat, particularly in premium beverage segments, though PET's cost-effectiveness and versatility continue to drive its dominance. End-user trends show a clear preference for convenience, shelf appeal, and eco-friendly packaging. Mergers and acquisitions (M&A) are active, with recent deals valued in the hundreds of million dollars, aiming to consolidate market presence and expand technological capabilities. For instance, a recent M&A involving RPC and Berry Plastics was valued at approximately $700 million, highlighting strategic consolidation. The market anticipates a CAGR of 5.5% over the forecast period, driven by innovation and demand across diverse applications.
Pet Bottles Containers Industry Trends & Insights
The Pet Bottles Containers industry is experiencing robust growth, fueled by a confluence of factors that are reshaping its trajectory. A primary growth driver is the insatiable demand from the beverage and food sectors, which account for over 60% of the market's revenue. This demand is propelled by a growing global population, rising disposable incomes, and an increasing consumption of packaged goods. Technological disruptions are playing a pivotal role, with advancements in injection stretch blow molding (ISBM) and reheat stretch blow molding (RSBM) significantly improving production efficiency, reducing material usage, and enabling the creation of complex container designs. The industry is witnessing a heightened focus on sustainability, with a surge in demand for recycled PET (rPET) and the development of bio-based PET alternatives. Consumer preferences are leaning towards lightweight, durable, and aesthetically pleasing packaging that offers convenience and extends product shelf life. The push for circular economy principles is also influencing product development, with manufacturers investing heavily in recycling infrastructure and designing for recyclability. Competitive dynamics are intense, characterized by price sensitivity in certain segments and a strong emphasis on innovation and customization in others. Key players are investing in R&D to develop thinner-walled bottles, explore novel barrier technologies to enhance product preservation, and implement smart packaging features. The market penetration of sustainable PET solutions is projected to increase by 15% by 2028. The overall market is poised for a Compound Annual Growth Rate (CAGR) of approximately 5.5% during the forecast period. This sustained growth underscores the enduring relevance and adaptability of PET as a primary packaging material. Furthermore, the integration of advanced automation and AI in manufacturing processes is optimizing production lines, reducing waste, and enhancing quality control, further solidifying the industry's competitive edge. The exploration of novel additive technologies for improved UV protection and oxygen scavenging is also a significant trend, catering to specific product preservation needs and expanding PET's application spectrum. The ongoing shift towards e-commerce also necessitates robust and lightweight packaging, further bolstering the demand for PET containers.
Dominant Markets & Segments in Pet Bottles Containers
The global Pet Bottles Containers market is characterized by a clear dominance of certain regions and segments, driven by specific economic, demographic, and regulatory factors.
Leading Region: Asia Pacific
- Economic Policies and Growth: The Asia Pacific region, particularly China and India, is the dominant force in the Pet Bottles Containers market. Rapid industrialization, a burgeoning middle class with increasing disposable income, and aggressive government policies promoting manufacturing and consumption have created an unprecedented demand for packaged goods.
- Infrastructure Development: Significant investments in infrastructure, including logistics and retail networks, have facilitated the widespread distribution of PET-packaged products, further cementing its dominance.
- Growing Beverage and Food Industry: This region is the largest consumer of PET bottles for beverages (water, carbonated soft drinks, juices) and food products. The sheer volume of consumption, coupled with a growing preference for convenience and ready-to-eat meals, makes this segment the primary growth engine.
- FMCG Expansion: The rapid expansion of the Fast-Moving Consumer Goods (FMCG) sector, driven by urbanization and changing lifestyles, further amplifies the demand for PET packaging solutions across a wide array of products.
Dominant Segment: Application - Beverages and Food
- Market Share: The Beverages and Food application segment consistently commands the largest market share, estimated at over 60% of the total Pet Bottles Containers market. This dominance is attributed to the sheer volume of liquid and solid food products that rely on PET for safe, convenient, and cost-effective packaging.
- Key Drivers:
- Hydration and Refreshment: The perennial demand for bottled water and carbonated soft drinks forms the bedrock of this segment's strength.
- Product Shelf Life and Preservation: PET's excellent barrier properties, especially when enhanced with coatings or multi-layer structures, are crucial for extending the shelf life of various food and beverage products, reducing spoilage and waste.
- Consumer Convenience: The portability and resealability of PET bottles cater to on-the-go consumption trends, a significant factor in modern consumer habits.
- Cost-Effectiveness: Compared to alternatives like glass, PET offers a more economical packaging solution for high-volume production, making it the preferred choice for many manufacturers.
- Lightweighting Benefits: Reduced transportation costs and lower carbon footprint due to the lightweight nature of PET bottles further enhance its appeal.
Dominant Segment: Type - Transparent Type
- Consumer Appeal: Transparent Type PET bottles are the preferred choice for a majority of applications, particularly in the beverages and food segments. This preference is driven by consumer psychology, where the ability to visually inspect the product enhances trust and purchase intent.
- Product Visibility: Transparency allows consumers to see the color, clarity, and quality of the product within, which is crucial for beverages like water, juices, and clear soft drinks.
- Brand Perception: Clear packaging often conveys a sense of purity, freshness, and premium quality, aligning with brand marketing strategies.
- Market Penetration: While colorful and opaque PET bottles are utilized for specific product protection needs (e.g., UV-sensitive beverages) or branding purposes, the sheer volume and broad applicability of transparent PET bottles ensure its continued market dominance. The market share for transparent PET bottles is estimated to be around 75-80%.
The interplay of these dominant factors—a rapidly growing Asia Pacific region, the pervasive need for PET in food and beverages, and the consumer preference for transparent packaging—collectively shapes the landscape and drives the sustained growth of the global Pet Bottles Containers market.
Pet Bottles Containers Product Innovations
Recent product innovations in the Pet Bottles Containers market are primarily focused on enhancing sustainability and functionality. The development of lightweighting technologies has led to thinner-walled bottles without compromising structural integrity, reducing material consumption by up to 10%. Advancements in high-barrier PET are extending product shelf life for sensitive contents, while the increased adoption of recycled PET (rPET), now reaching up to 50% in some applications, addresses environmental concerns. Innovations in hot-fill PET are enabling its use in a wider range of food and beverage products previously limited to glass. These developments offer competitive advantages by reducing costs, improving environmental footprints, and meeting evolving consumer and regulatory demands.
Report Segmentation & Scope
This comprehensive report segments the Pet Bottles Containers market based on key parameters to provide granular insights. The Application segmentation includes Beverages and Food, Pharmaceutical, FMCG, and Others. The Beverages and Food segment, estimated at $60 billion in 2025, is projected to grow at a CAGR of 5.8%. The Pharmaceutical segment, valued at $15 billion in 2025, is expected to see a CAGR of 4.5% driven by increased healthcare spending. The FMCG segment, at $25 billion in 2025, will grow at a CAGR of 5.2%, influenced by expanding consumer markets. The Others segment encompasses industrial and cosmetic applications. The Type segmentation categorizes the market into Colorful Type and Transparent Type. Transparent Type holds an estimated 78% market share ($80 billion in 2025) with a CAGR of 5.6%. Colorful Type, valued at $22 billion in 2025, is projected to grow at a CAGR of 4.9%, driven by specific branding and product protection needs. The scope of this report covers global market analysis, regional breakdowns, and competitive intelligence.
Key Drivers of Pet Bottles Containers Growth
The growth of the Pet Bottles Containers market is propelled by several key drivers. The increasing global demand for packaged beverages and food, fueled by population growth and urbanization, is a primary catalyst. Technological advancements, such as lightweighting and improved barrier properties in PET, enhance product performance and reduce costs. The growing emphasis on sustainability and the circular economy is driving the adoption of recycled PET (rPET) and bio-based alternatives. Furthermore, favorable regulatory policies supporting recycling initiatives and waste reduction indirectly boost the demand for recyclable PET solutions. The expansion of the e-commerce sector also necessitates lightweight, durable, and cost-effective packaging, further bolstering PET container demand.
Challenges in the Pet Bottles Containers Sector
Despite robust growth, the Pet Bottles Containers sector faces significant challenges. Plastic waste and environmental concerns continue to be a major hurdle, leading to increased scrutiny and calls for stricter regulations. Volatility in raw material prices, particularly for PET resin derived from crude oil, can impact profitability and pricing strategies. Intensifying competition from alternative packaging materials like glass, aluminum, and paperboard, especially in premium segments, poses a threat. Supply chain disruptions, as witnessed in recent global events, can affect production and delivery timelines. Furthermore, evolving consumer perceptions and preferences towards more sustainable or novel packaging options require continuous innovation and adaptation from PET manufacturers. The cost of implementing advanced recycling technologies can also be a barrier for some players.
Leading Players in the Pet Bottles Containers Market
- ALPLA
- Amcor
- Plastipak Packaging
- Graham Packaging
- RPC
- Berry Plastics
- Greiner Packaging
- Alpha Packaging
- Zijiang
- Visy
- Zhongfu
- XLZT
- Polycon Industries
- KW Plastics
- Boxmore Packaging
Key Developments in Pet Bottles Containers Sector
- 2023: Amcor launches its first 100% recycled PET bottle for the beverage industry, marking a significant step towards circularity.
- 2023: ALPLA invests $50 million in advanced recycling facilities to increase its rPET production capacity.
- 2024: Plastipak Packaging acquires a leading European manufacturer of PET preforms, expanding its global footprint.
- 2024: Graham Packaging introduces a new lightweight PET bottle design that reduces material usage by 12%.
- 2024: Berry Plastics innovates with a new bio-based PET resin, offering a more sustainable alternative.
- 2024: Greiner Packaging develops a novel hot-fill PET bottle for dairy and juice applications, expanding product compatibility.
- 2025: RPC announces a strategic partnership to develop advanced PET recycling technologies.
- 2025: Alpha Packaging invests in state-of-the-art manufacturing to enhance production efficiency and product quality.
- 2025: Zijiang expands its product portfolio with innovative PET containers for pharmaceutical applications.
- 2025: Visy enhances its sustainability initiatives by increasing the use of post-consumer recycled content in its PET bottles.
- 2025: Zhongfu launches a new range of colorful PET bottles with enhanced UV protection for sensitive products.
- 2025: XLZT focuses on R&D for thinner-walled PET containers, aiming for further material reduction.
- 2025: Polycon Industries partners with a technology firm to integrate AI in its PET bottle manufacturing process.
- 2025: KW Plastics invests in new machinery to boost production capacity for rPET bottles.
- 2025: Boxmore Packaging expands its market reach through strategic distribution agreements in emerging economies.
Strategic Pet Bottles Containers Market Outlook
The strategic outlook for the Pet Bottles Containers market is exceptionally positive, driven by ongoing innovation and the enduring demand for versatile packaging solutions. Growth accelerators include the continued expansion of the global beverage and food industries, coupled with increasing penetration in pharmaceutical and FMCG sectors. The escalating focus on sustainability will favor manufacturers that can effectively integrate high percentages of recycled PET and explore bio-based alternatives. Investments in advanced manufacturing technologies, such as lightweighting and improved barrier properties, will be crucial for maintaining a competitive edge. Strategic opportunities lie in capitalizing on emerging markets, developing customized packaging for niche applications, and collaborating across the value chain to advance circular economy initiatives. The market is poised for sustained growth, with companies prioritizing innovation and sustainability set to lead the charge.
Pet Bottles Containers Segmentation
-
1. Application
- 1.1. Beverages and Food
- 1.2. Pharmaceutical
- 1.3. FMCG
- 1.4. Others
-
2. Type
- 2.1. Colorful Type
- 2.2. Transparent Type
Pet Bottles Containers Segmentation By Geography
-
1. North America
- 1.1. United States
- 1.2. Canada
- 1.3. Mexico
-
2. South America
- 2.1. Brazil
- 2.2. Argentina
- 2.3. Rest of South America
-
3. Europe
- 3.1. United Kingdom
- 3.2. Germany
- 3.3. France
- 3.4. Italy
- 3.5. Spain
- 3.6. Russia
- 3.7. Benelux
- 3.8. Nordics
- 3.9. Rest of Europe
-
4. Middle East & Africa
- 4.1. Turkey
- 4.2. Israel
- 4.3. GCC
- 4.4. North Africa
- 4.5. South Africa
- 4.6. Rest of Middle East & Africa
-
5. Asia Pacific
- 5.1. China
- 5.2. India
- 5.3. Japan
- 5.4. South Korea
- 5.5. ASEAN
- 5.6. Oceania
- 5.7. Rest of Asia Pacific
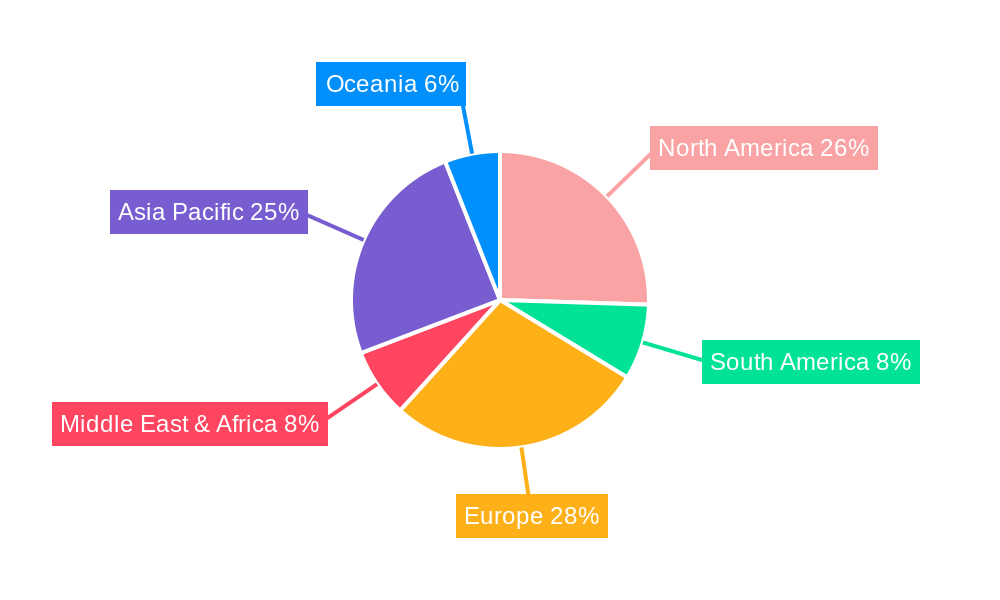
Pet Bottles Containers Regional Market Share
Geographic Coverage of Pet Bottles Containers
Pet Bottles Containers REPORT HIGHLIGHTS
| Aspects | Details |
|---|---|
| Study Period | 2020-2034 |
| Base Year | 2025 |
| Estimated Year | 2026 |
| Forecast Period | 2026-2034 |
| Historical Period | 2020-2025 |
| Growth Rate | CAGR of 4.4% from 2020-2034 |
| Segmentation |
|
Table of Contents
- 1. Introduction
- 1.1. Research Scope
- 1.2. Market Segmentation
- 1.3. Research Objective
- 1.4. Definitions and Assumptions
- 2. Executive Summary
- 2.1. Market Snapshot
- 3. Market Dynamics
- 3.1. Market Drivers
- 3.2. Market Restrains
- 3.3. Market Trends
- 3.4. Market Opportunities
- 4. Market Factor Analysis
- 4.1. Porters Five Forces
- 4.1.1. Bargaining Power of Suppliers
- 4.1.2. Bargaining Power of Buyers
- 4.1.3. Threat of New Entrants
- 4.1.4. Threat of Substitutes
- 4.1.5. Competitive Rivalry
- 4.2. PESTEL analysis
- 4.3. BCG Analysis
- 4.3.1. Stars (High Growth, High Market Share)
- 4.3.2. Cash Cows (Low Growth, High Market Share)
- 4.3.3. Question Mark (High Growth, Low Market Share)
- 4.3.4. Dogs (Low Growth, Low Market Share)
- 4.4. Ansoff Matrix Analysis
- 4.5. Supply Chain Analysis
- 4.6. Regulatory Landscape
- 4.7. Current Market Potential and Opportunity Assessment (TAM–SAM–SOM Framework)
- 4.8. PMV Analyst Note
- 4.1. Porters Five Forces
- 5. Market Analysis, Insights and Forecast 2021-2033
- 5.1. Market Analysis, Insights and Forecast - by Application
- 5.1.1. Beverages and Food
- 5.1.2. Pharmaceutical
- 5.1.3. FMCG
- 5.1.4. Others
- 5.2. Market Analysis, Insights and Forecast - by Type
- 5.2.1. Colorful Type
- 5.2.2. Transparent Type
- 5.3. Market Analysis, Insights and Forecast - by Region
- 5.3.1. North America
- 5.3.2. South America
- 5.3.3. Europe
- 5.3.4. Middle East & Africa
- 5.3.5. Asia Pacific
- 5.1. Market Analysis, Insights and Forecast - by Application
- 6. Global Pet Bottles Containers Analysis, Insights and Forecast, 2021-2033
- 6.1. Market Analysis, Insights and Forecast - by Application
- 6.1.1. Beverages and Food
- 6.1.2. Pharmaceutical
- 6.1.3. FMCG
- 6.1.4. Others
- 6.2. Market Analysis, Insights and Forecast - by Type
- 6.2.1. Colorful Type
- 6.2.2. Transparent Type
- 6.1. Market Analysis, Insights and Forecast - by Application
- 7. North America Pet Bottles Containers Analysis, Insights and Forecast, 2020-2032
- 7.1. Market Analysis, Insights and Forecast - by Application
- 7.1.1. Beverages and Food
- 7.1.2. Pharmaceutical
- 7.1.3. FMCG
- 7.1.4. Others
- 7.2. Market Analysis, Insights and Forecast - by Type
- 7.2.1. Colorful Type
- 7.2.2. Transparent Type
- 7.1. Market Analysis, Insights and Forecast - by Application
- 8. South America Pet Bottles Containers Analysis, Insights and Forecast, 2020-2032
- 8.1. Market Analysis, Insights and Forecast - by Application
- 8.1.1. Beverages and Food
- 8.1.2. Pharmaceutical
- 8.1.3. FMCG
- 8.1.4. Others
- 8.2. Market Analysis, Insights and Forecast - by Type
- 8.2.1. Colorful Type
- 8.2.2. Transparent Type
- 8.1. Market Analysis, Insights and Forecast - by Application
- 9. Europe Pet Bottles Containers Analysis, Insights and Forecast, 2020-2032
- 9.1. Market Analysis, Insights and Forecast - by Application
- 9.1.1. Beverages and Food
- 9.1.2. Pharmaceutical
- 9.1.3. FMCG
- 9.1.4. Others
- 9.2. Market Analysis, Insights and Forecast - by Type
- 9.2.1. Colorful Type
- 9.2.2. Transparent Type
- 9.1. Market Analysis, Insights and Forecast - by Application
- 10. Middle East & Africa Pet Bottles Containers Analysis, Insights and Forecast, 2020-2032
- 10.1. Market Analysis, Insights and Forecast - by Application
- 10.1.1. Beverages and Food
- 10.1.2. Pharmaceutical
- 10.1.3. FMCG
- 10.1.4. Others
- 10.2. Market Analysis, Insights and Forecast - by Type
- 10.2.1. Colorful Type
- 10.2.2. Transparent Type
- 10.1. Market Analysis, Insights and Forecast - by Application
- 11. Asia Pacific Pet Bottles Containers Analysis, Insights and Forecast, 2020-2032
- 11.1. Market Analysis, Insights and Forecast - by Application
- 11.1.1. Beverages and Food
- 11.1.2. Pharmaceutical
- 11.1.3. FMCG
- 11.1.4. Others
- 11.2. Market Analysis, Insights and Forecast - by Type
- 11.2.1. Colorful Type
- 11.2.2. Transparent Type
- 11.1. Market Analysis, Insights and Forecast - by Application
- 12. Competitive Analysis
- 12.1. Company Profiles
- 12.1.1 ALPLA
- 12.1.1.1. Company Overview
- 12.1.1.2. Products
- 12.1.1.3. Company Financials
- 12.1.1.4. SWOT Analysis
- 12.1.2 Amcor
- 12.1.2.1. Company Overview
- 12.1.2.2. Products
- 12.1.2.3. Company Financials
- 12.1.2.4. SWOT Analysis
- 12.1.3 Plastipak Packaging
- 12.1.3.1. Company Overview
- 12.1.3.2. Products
- 12.1.3.3. Company Financials
- 12.1.3.4. SWOT Analysis
- 12.1.4 Graham Packaging
- 12.1.4.1. Company Overview
- 12.1.4.2. Products
- 12.1.4.3. Company Financials
- 12.1.4.4. SWOT Analysis
- 12.1.5 RPC
- 12.1.5.1. Company Overview
- 12.1.5.2. Products
- 12.1.5.3. Company Financials
- 12.1.5.4. SWOT Analysis
- 12.1.6 Berry Plastics
- 12.1.6.1. Company Overview
- 12.1.6.2. Products
- 12.1.6.3. Company Financials
- 12.1.6.4. SWOT Analysis
- 12.1.7 Greiner Packaging
- 12.1.7.1. Company Overview
- 12.1.7.2. Products
- 12.1.7.3. Company Financials
- 12.1.7.4. SWOT Analysis
- 12.1.8 Alpha Packaging
- 12.1.8.1. Company Overview
- 12.1.8.2. Products
- 12.1.8.3. Company Financials
- 12.1.8.4. SWOT Analysis
- 12.1.9 Zijiang
- 12.1.9.1. Company Overview
- 12.1.9.2. Products
- 12.1.9.3. Company Financials
- 12.1.9.4. SWOT Analysis
- 12.1.10 Visy
- 12.1.10.1. Company Overview
- 12.1.10.2. Products
- 12.1.10.3. Company Financials
- 12.1.10.4. SWOT Analysis
- 12.1.11 Zhongfu
- 12.1.11.1. Company Overview
- 12.1.11.2. Products
- 12.1.11.3. Company Financials
- 12.1.11.4. SWOT Analysis
- 12.1.12 XLZT
- 12.1.12.1. Company Overview
- 12.1.12.2. Products
- 12.1.12.3. Company Financials
- 12.1.12.4. SWOT Analysis
- 12.1.13 Polycon Industries
- 12.1.13.1. Company Overview
- 12.1.13.2. Products
- 12.1.13.3. Company Financials
- 12.1.13.4. SWOT Analysis
- 12.1.14 KW Plastics
- 12.1.14.1. Company Overview
- 12.1.14.2. Products
- 12.1.14.3. Company Financials
- 12.1.14.4. SWOT Analysis
- 12.1.15 Boxmore Packaging
- 12.1.15.1. Company Overview
- 12.1.15.2. Products
- 12.1.15.3. Company Financials
- 12.1.15.4. SWOT Analysis
- 12.1.1 ALPLA
- 12.2. Market Entropy
- 12.2.1 Company's Key Areas Served
- 12.2.2 Recent Developments
- 12.3. Company Market Share Analysis 2025
- 12.3.1 Top 5 Companies Market Share Analysis
- 12.3.2 Top 3 Companies Market Share Analysis
- 12.4. List of Potential Customers
- 13. Research Methodology
List of Figures
- Figure 1: Global Pet Bottles Containers Revenue Breakdown (million, %) by Region 2025 & 2033
- Figure 2: North America Pet Bottles Containers Revenue (million), by Application 2025 & 2033
- Figure 3: North America Pet Bottles Containers Revenue Share (%), by Application 2025 & 2033
- Figure 4: North America Pet Bottles Containers Revenue (million), by Type 2025 & 2033
- Figure 5: North America Pet Bottles Containers Revenue Share (%), by Type 2025 & 2033
- Figure 6: North America Pet Bottles Containers Revenue (million), by Country 2025 & 2033
- Figure 7: North America Pet Bottles Containers Revenue Share (%), by Country 2025 & 2033
- Figure 8: South America Pet Bottles Containers Revenue (million), by Application 2025 & 2033
- Figure 9: South America Pet Bottles Containers Revenue Share (%), by Application 2025 & 2033
- Figure 10: South America Pet Bottles Containers Revenue (million), by Type 2025 & 2033
- Figure 11: South America Pet Bottles Containers Revenue Share (%), by Type 2025 & 2033
- Figure 12: South America Pet Bottles Containers Revenue (million), by Country 2025 & 2033
- Figure 13: South America Pet Bottles Containers Revenue Share (%), by Country 2025 & 2033
- Figure 14: Europe Pet Bottles Containers Revenue (million), by Application 2025 & 2033
- Figure 15: Europe Pet Bottles Containers Revenue Share (%), by Application 2025 & 2033
- Figure 16: Europe Pet Bottles Containers Revenue (million), by Type 2025 & 2033
- Figure 17: Europe Pet Bottles Containers Revenue Share (%), by Type 2025 & 2033
- Figure 18: Europe Pet Bottles Containers Revenue (million), by Country 2025 & 2033
- Figure 19: Europe Pet Bottles Containers Revenue Share (%), by Country 2025 & 2033
- Figure 20: Middle East & Africa Pet Bottles Containers Revenue (million), by Application 2025 & 2033
- Figure 21: Middle East & Africa Pet Bottles Containers Revenue Share (%), by Application 2025 & 2033
- Figure 22: Middle East & Africa Pet Bottles Containers Revenue (million), by Type 2025 & 2033
- Figure 23: Middle East & Africa Pet Bottles Containers Revenue Share (%), by Type 2025 & 2033
- Figure 24: Middle East & Africa Pet Bottles Containers Revenue (million), by Country 2025 & 2033
- Figure 25: Middle East & Africa Pet Bottles Containers Revenue Share (%), by Country 2025 & 2033
- Figure 26: Asia Pacific Pet Bottles Containers Revenue (million), by Application 2025 & 2033
- Figure 27: Asia Pacific Pet Bottles Containers Revenue Share (%), by Application 2025 & 2033
- Figure 28: Asia Pacific Pet Bottles Containers Revenue (million), by Type 2025 & 2033
- Figure 29: Asia Pacific Pet Bottles Containers Revenue Share (%), by Type 2025 & 2033
- Figure 30: Asia Pacific Pet Bottles Containers Revenue (million), by Country 2025 & 2033
- Figure 31: Asia Pacific Pet Bottles Containers Revenue Share (%), by Country 2025 & 2033
List of Tables
- Table 1: Global Pet Bottles Containers Revenue million Forecast, by Application 2020 & 2033
- Table 2: Global Pet Bottles Containers Revenue million Forecast, by Type 2020 & 2033
- Table 3: Global Pet Bottles Containers Revenue million Forecast, by Region 2020 & 2033
- Table 4: Global Pet Bottles Containers Revenue million Forecast, by Application 2020 & 2033
- Table 5: Global Pet Bottles Containers Revenue million Forecast, by Type 2020 & 2033
- Table 6: Global Pet Bottles Containers Revenue million Forecast, by Country 2020 & 2033
- Table 7: United States Pet Bottles Containers Revenue (million) Forecast, by Application 2020 & 2033
- Table 8: Canada Pet Bottles Containers Revenue (million) Forecast, by Application 2020 & 2033
- Table 9: Mexico Pet Bottles Containers Revenue (million) Forecast, by Application 2020 & 2033
- Table 10: Global Pet Bottles Containers Revenue million Forecast, by Application 2020 & 2033
- Table 11: Global Pet Bottles Containers Revenue million Forecast, by Type 2020 & 2033
- Table 12: Global Pet Bottles Containers Revenue million Forecast, by Country 2020 & 2033
- Table 13: Brazil Pet Bottles Containers Revenue (million) Forecast, by Application 2020 & 2033
- Table 14: Argentina Pet Bottles Containers Revenue (million) Forecast, by Application 2020 & 2033
- Table 15: Rest of South America Pet Bottles Containers Revenue (million) Forecast, by Application 2020 & 2033
- Table 16: Global Pet Bottles Containers Revenue million Forecast, by Application 2020 & 2033
- Table 17: Global Pet Bottles Containers Revenue million Forecast, by Type 2020 & 2033
- Table 18: Global Pet Bottles Containers Revenue million Forecast, by Country 2020 & 2033
- Table 19: United Kingdom Pet Bottles Containers Revenue (million) Forecast, by Application 2020 & 2033
- Table 20: Germany Pet Bottles Containers Revenue (million) Forecast, by Application 2020 & 2033
- Table 21: France Pet Bottles Containers Revenue (million) Forecast, by Application 2020 & 2033
- Table 22: Italy Pet Bottles Containers Revenue (million) Forecast, by Application 2020 & 2033
- Table 23: Spain Pet Bottles Containers Revenue (million) Forecast, by Application 2020 & 2033
- Table 24: Russia Pet Bottles Containers Revenue (million) Forecast, by Application 2020 & 2033
- Table 25: Benelux Pet Bottles Containers Revenue (million) Forecast, by Application 2020 & 2033
- Table 26: Nordics Pet Bottles Containers Revenue (million) Forecast, by Application 2020 & 2033
- Table 27: Rest of Europe Pet Bottles Containers Revenue (million) Forecast, by Application 2020 & 2033
- Table 28: Global Pet Bottles Containers Revenue million Forecast, by Application 2020 & 2033
- Table 29: Global Pet Bottles Containers Revenue million Forecast, by Type 2020 & 2033
- Table 30: Global Pet Bottles Containers Revenue million Forecast, by Country 2020 & 2033
- Table 31: Turkey Pet Bottles Containers Revenue (million) Forecast, by Application 2020 & 2033
- Table 32: Israel Pet Bottles Containers Revenue (million) Forecast, by Application 2020 & 2033
- Table 33: GCC Pet Bottles Containers Revenue (million) Forecast, by Application 2020 & 2033
- Table 34: North Africa Pet Bottles Containers Revenue (million) Forecast, by Application 2020 & 2033
- Table 35: South Africa Pet Bottles Containers Revenue (million) Forecast, by Application 2020 & 2033
- Table 36: Rest of Middle East & Africa Pet Bottles Containers Revenue (million) Forecast, by Application 2020 & 2033
- Table 37: Global Pet Bottles Containers Revenue million Forecast, by Application 2020 & 2033
- Table 38: Global Pet Bottles Containers Revenue million Forecast, by Type 2020 & 2033
- Table 39: Global Pet Bottles Containers Revenue million Forecast, by Country 2020 & 2033
- Table 40: China Pet Bottles Containers Revenue (million) Forecast, by Application 2020 & 2033
- Table 41: India Pet Bottles Containers Revenue (million) Forecast, by Application 2020 & 2033
- Table 42: Japan Pet Bottles Containers Revenue (million) Forecast, by Application 2020 & 2033
- Table 43: South Korea Pet Bottles Containers Revenue (million) Forecast, by Application 2020 & 2033
- Table 44: ASEAN Pet Bottles Containers Revenue (million) Forecast, by Application 2020 & 2033
- Table 45: Oceania Pet Bottles Containers Revenue (million) Forecast, by Application 2020 & 2033
- Table 46: Rest of Asia Pacific Pet Bottles Containers Revenue (million) Forecast, by Application 2020 & 2033
Frequently Asked Questions
1. What is the projected Compound Annual Growth Rate (CAGR) of the Pet Bottles Containers?
The projected CAGR is approximately 4.4%.
2. Which companies are prominent players in the Pet Bottles Containers?
Key companies in the market include ALPLA, Amcor, Plastipak Packaging, Graham Packaging, RPC, Berry Plastics, Greiner Packaging, Alpha Packaging, Zijiang, Visy, Zhongfu, XLZT, Polycon Industries, KW Plastics, Boxmore Packaging.
3. What are the main segments of the Pet Bottles Containers?
The market segments include Application, Type.
4. Can you provide details about the market size?
The market size is estimated to be USD 107580 million as of 2022.
5. What are some drivers contributing to market growth?
N/A
6. What are the notable trends driving market growth?
N/A
7. Are there any restraints impacting market growth?
N/A
8. Can you provide examples of recent developments in the market?
N/A
9. What pricing options are available for accessing the report?
Pricing options include single-user, multi-user, and enterprise licenses priced at USD 2900.00, USD 4350.00, and USD 5800.00 respectively.
10. Is the market size provided in terms of value or volume?
The market size is provided in terms of value, measured in million.
11. Are there any specific market keywords associated with the report?
Yes, the market keyword associated with the report is "Pet Bottles Containers," which aids in identifying and referencing the specific market segment covered.
12. How do I determine which pricing option suits my needs best?
The pricing options vary based on user requirements and access needs. Individual users may opt for single-user licenses, while businesses requiring broader access may choose multi-user or enterprise licenses for cost-effective access to the report.
13. Are there any additional resources or data provided in the Pet Bottles Containers report?
While the report offers comprehensive insights, it's advisable to review the specific contents or supplementary materials provided to ascertain if additional resources or data are available.
14. How can I stay updated on further developments or reports in the Pet Bottles Containers?
To stay informed about further developments, trends, and reports in the Pet Bottles Containers, consider subscribing to industry newsletters, following relevant companies and organizations, or regularly checking reputable industry news sources and publications.
Methodology
Step 1 - Identification of Relevant Samples Size from Population Database


Step 2 - Approaches for Defining Global Market Size (Value, Volume* & Price*)

Note*: In applicable scenarios
Step 3 - Data Sources
Primary Research
- Web Analytics
- Survey Reports
- Research Institute
- Latest Research Reports
- Opinion Leaders
Secondary Research
- Annual Reports
- White Paper
- Latest Press Release
- Industry Association
- Paid Database
- Investor Presentations

Step 4 - Data Triangulation
Involves using different sources of information in order to increase the validity of a study
These sources are likely to be stakeholders in a program - participants, other researchers, program staff, other community members, and so on.
Then we put all data in single framework & apply various statistical tools to find out the dynamic on the market.
During the analysis stage, feedback from the stakeholder groups would be compared to determine areas of agreement as well as areas of divergence

