
Key Insights
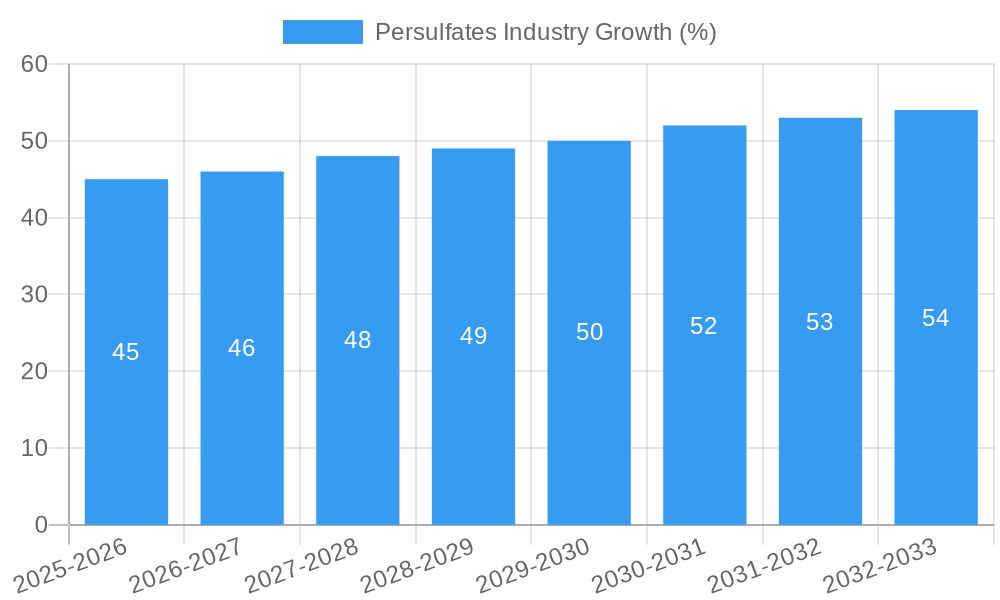
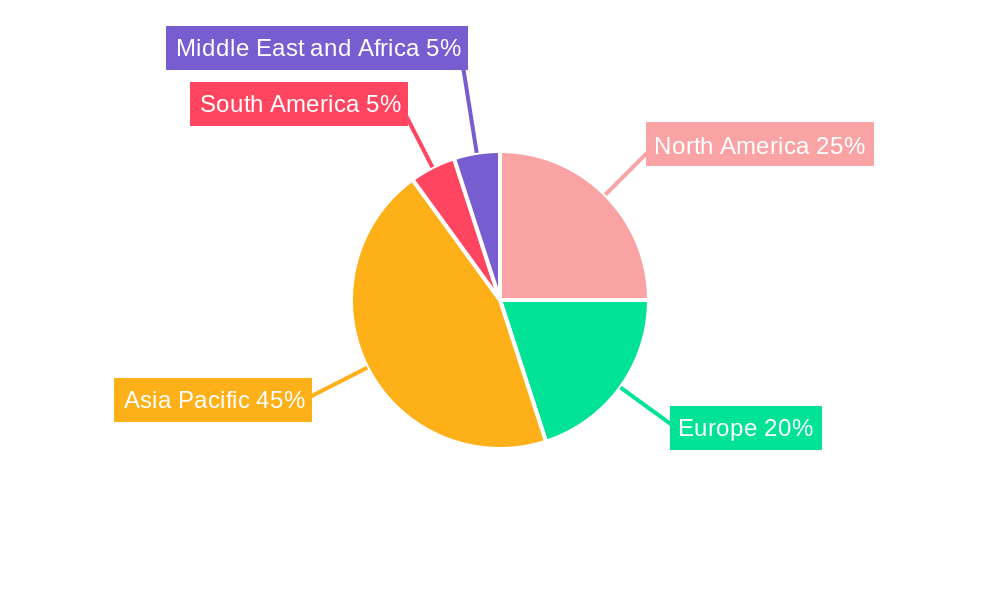
The global persulfates market, valued at approximately $XX million in 2025, is projected to experience robust growth, exceeding a 3% CAGR from 2025 to 2033. This expansion is driven by increasing demand across diverse sectors. The polymer industry, particularly in applications requiring polymerization initiators, constitutes a significant portion of the market. The burgeoning electronics sector, with its need for etching and cleaning solutions, also fuels market growth. Furthermore, the rising adoption of persulfates in water treatment and soil remediation, responding to stringent environmental regulations and the growing focus on sustainable practices, significantly contributes to market expansion. Sodium persulfate remains the dominant type, owing to its cost-effectiveness and widespread applications. However, the demand for potassium and ammonium persulfates is also anticipated to increase, driven by their superior performance in specific applications, like enhanced oil recovery and bleaching processes. Geographic growth is expected to be particularly strong in the Asia-Pacific region, driven by substantial industrialization and rising manufacturing activities in countries like China and India.
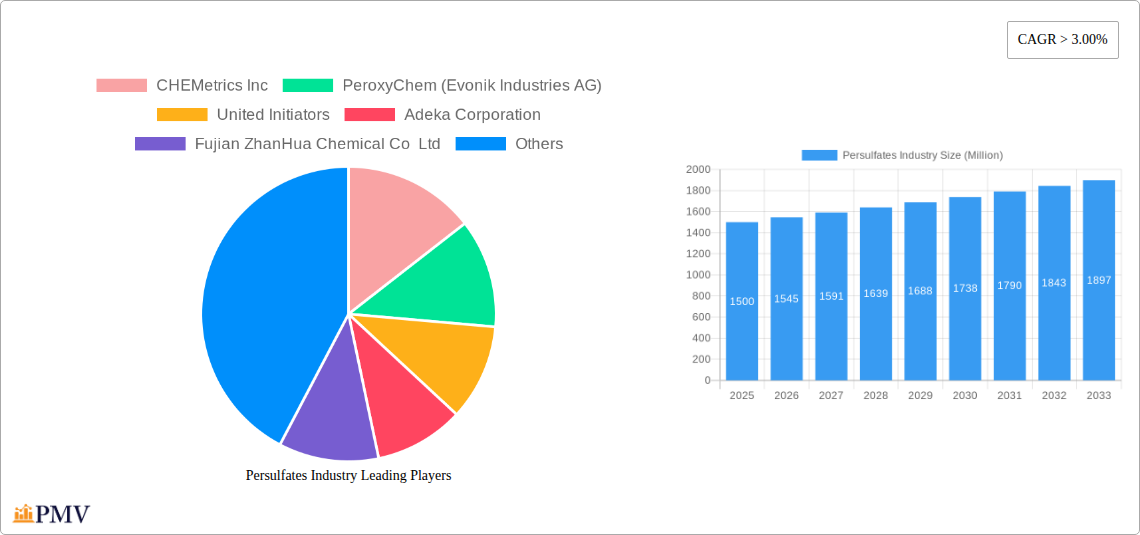
While the market exhibits strong growth potential, certain restraints exist. Price volatility in raw materials, stringent regulatory frameworks surrounding chemical usage, and the emergence of alternative technologies pose challenges to market expansion. Nevertheless, continuous research and development efforts focused on improving persulfate efficiency and developing sustainable production methods are expected to mitigate these challenges and further propel market growth. The competitive landscape is relatively fragmented, with several prominent players like PeroxyChem, United Initiators, and Adeka Corporation holding significant market share. However, the market is also characterized by the presence of several regional players, particularly in Asia-Pacific, indicating potential for further consolidation and competition in the coming years. The market is poised for substantial growth, driven by a confluence of industrial expansion, environmental concerns, and technological advancements.
Persulfates Industry Market Report: 2019-2033
This comprehensive report provides an in-depth analysis of the global persulfates industry, covering market size, growth drivers, competitive landscape, and future outlook. The study period spans from 2019 to 2033, with 2025 serving as the base and estimated year. The forecast period extends from 2025 to 2033, while the historical period encompasses 2019-2024. The report offers actionable insights for industry stakeholders, including manufacturers, distributors, and investors. The total market value is estimated at xx Million in 2025, projected to reach xx Million by 2033.
Persulfates Industry Market Structure & Competitive Dynamics
The global persulfates market exhibits a moderately consolidated structure, with key players holding significant market share. Market concentration is driven by factors including economies of scale in production, established distribution networks, and strong brand recognition. The industry is characterized by a dynamic competitive landscape, with companies engaging in various strategies to gain market share, including product innovation, mergers and acquisitions (M&A), and strategic partnerships. Innovation plays a crucial role, with companies investing heavily in R&D to develop new persulfate formulations and applications. Regulatory frameworks, particularly concerning environmental regulations and safety standards, significantly influence market dynamics. The presence of substitute chemicals, such as other oxidizing agents, creates competitive pressure. End-user trends, particularly in the electronics and water treatment sectors, heavily influence market demand. M&A activity has been notable in recent years, with deal values estimated at xx Million in the past five years. Significant transactions often involve the consolidation of manufacturing capacity or expansion into new geographical markets.
- Market Share: Top 5 players hold approximately xx% of the market share.
- M&A Activity: Significant consolidation is expected in the forecast period, driven by economies of scale and increased regulatory scrutiny.
- Innovation: Focus on developing more environmentally friendly persulfate formulations and expanding applications in high-growth end-user industries.
Persulfates Industry Trends & Insights
The persulfates market is witnessing robust growth, driven by increasing demand from various end-use industries. The compound annual growth rate (CAGR) is projected to be xx% during the forecast period. Key growth drivers include the rising demand for environmentally friendly bleaching agents in the pulp and paper industry, the expanding electronics sector requiring advanced etching solutions, and the growing adoption of persulfates in water treatment for effective oxidation. Technological advancements such as the development of specialized persulfate formulations with improved efficacy and stability are further propelling market growth. Shifting consumer preferences towards sustainable and environmentally friendly products are also positively impacting market expansion. Competitive dynamics are characterized by continuous innovation, strategic collaborations, and capacity expansions by leading players. Market penetration of persulfates in niche applications like soil remediation and enhanced oil recovery is gradually increasing. The market exhibits regional variations in growth rates, with regions like Asia-Pacific experiencing particularly strong expansion due to rapid industrialization and increasing infrastructure development.
Dominant Markets & Segments in Persulfates Industry
The Asia-Pacific region dominates the global persulfates market, driven by robust economic growth, expanding industrial sectors, and significant investments in infrastructure development. China, in particular, is a major market for persulfates, driven by large-scale production capacity and high demand from end-use sectors such as textiles, paper, and electronics.
- Dominant End-User Industries: Polymer, Pulp & Paper, and Electronics account for the largest market share due to the extensive use of persulfates in polymerization processes, bleaching operations, and circuit etching, respectively.
- Dominant Persulfate Type: Sodium Persulfate holds the largest market share, owing to its cost-effectiveness and widespread applications.
- Key Drivers:
- Rapid industrialization and urbanization in Asia-Pacific: This has created significant demand for persulfates in various industries.
- Government initiatives supporting sustainable industrial practices: This is promoting the adoption of environmentally friendly persulfates.
- Expanding electronics sector: This is driving the demand for high-purity persulfates in advanced circuit etching.
Persulfates Industry Product Innovations
Recent innovations focus on developing specialized persulfate formulations with enhanced performance characteristics, such as improved solubility, stability, and efficacy. These innovations are tailored to specific applications, optimizing performance and reducing environmental impact. For example, the development of controlled-release persulfate formulations enhances their effectiveness in specific applications. These innovations are crucial for maintaining a competitive edge in the market and expanding into new applications. The industry is witnessing a trend towards developing biodegradable and environmentally friendly persulfate-based products to address growing environmental concerns.
Report Segmentation & Scope
This report segments the persulfates market by end-user industry (Polymer, Pulp & Paper, Textile, Electronics, Cosmetics & Personal Care, Oil & Gas, Water Treatment, Soil Remediation, Other), type (Sodium Persulfate, Potassium Persulfate, Ammonium Persulfate), and application (Polymer Initiator, Enhanced Oil Recovery, Oxidation, Bleaching & Sizing Agent, Other). Each segment's growth projection, market size, and competitive dynamics are analyzed. The report provides a detailed overview of the market size and forecast for each segment, considering the factors impacting their growth trajectory. The competitive landscape of each segment is analyzed, highlighting the key players and their market strategies.
Key Drivers of Persulfates Industry Growth
Key drivers include the rising demand from various sectors, advancements in technology leading to improved efficacy and environmental friendliness, and supportive government regulations promoting sustainable industrial practices. The increasing adoption of persulfates in water treatment and soil remediation is also boosting market growth. Furthermore, technological advancements have led to the development of highly efficient and environmentally benign persulfate formulations, creating more opportunities for growth.
Challenges in the Persulfates Industry Sector
Challenges include the volatility of raw material prices, stringent environmental regulations, and intense competition from substitute chemicals. Supply chain disruptions and fluctuations in energy prices also present significant challenges to manufacturers. Meeting stringent environmental regulations requires significant investments in pollution control technology, increasing manufacturing costs. Moreover, the presence of substitute chemicals like other oxidizing agents exerts competitive pressure, requiring continuous innovation to maintain market share.
Leading Players in the Persulfates Industry Market
- CHEMetrics Inc
- PeroxyChem (Evonik Industries AG)
- United Initiators
- Adeka Corporation
- Fujian ZhanHua Chemical Co Ltd
- Akkim Kimya
- Shaanxi Baohua Technologies Co Ltd
- Shanghai Ansin Chemical Co Ltd
- LANXESS
- Stars Chemical (YongAn) Co Ltd
- Mitsubishi Gas Chemical Company Inc
- Yatai Electrochemistry Co Ltd
- Powder Pack Chem
- VR Persulfates Pvt Ltd
- ABC Chemicals (Shanghai) Co Ltd
Key Developments in Persulfates Industry Sector
- 2023-Q3: Company X launches a new, environmentally friendly persulfate formulation for water treatment applications.
- 2022-Q4: Company Y announces a significant expansion of its persulfate production capacity in Asia.
- 2021-Q2: A major merger between two key players reshapes the competitive landscape. (Further specific developments would be included here).
Strategic Persulfates Industry Market Outlook
The persulfates market is poised for significant growth driven by the continued expansion of its end-use sectors, especially in developing economies. Strategic opportunities exist for companies to invest in research and development of advanced persulfate formulations, focusing on enhancing efficacy and environmental sustainability. Expanding into new and emerging applications, such as advanced oxidation processes for environmental remediation, presents lucrative possibilities. Further consolidation through mergers and acquisitions is likely, leading to a more concentrated market structure. Companies that effectively leverage technological advancements and adapt to evolving regulatory frameworks will be best positioned for success in this dynamic market.
Persulfates Industry Segmentation
-
1. Type
- 1.1. Sodium Persulfate
- 1.2. Potassium Persulfate
- 1.3. Ammonium Persulfate
-
2. Application
- 2.1. Polymer Initiator
- 2.2. Enhanced Oil Recovery
- 2.3. Oxidation, Bleaching, and Sizing Agent
- 2.4. Other Applications
-
3. End-user Industry
- 3.1. Polymer
- 3.2. Pulp, Paper, and Textile
- 3.3. Electronics
- 3.4. Cosmetics and Personal Care
- 3.5. Oil and Gas
- 3.6. Water Treatment
- 3.7. Soil Remediation
- 3.8. Other End-user Industries
Persulfates Industry Segmentation By Geography
-
1. Asia Pacific
- 1.1. China
- 1.2. India
- 1.3. Japan
- 1.4. South Korea
- 1.5. Rest of Asia Pacific
-
2. North America
- 2.1. United States
- 2.2. Canada
- 2.3. Mexico
-
3. Europe
- 3.1. Germany
- 3.2. United Kingdom
- 3.3. Italy
- 3.4. France
- 3.5. Rest of Europe
-
4. South America
- 4.1. Brazil
- 4.2. Argentina
- 4.3. Rest of South America
-
5. Middle East and Africa
- 5.1. Saudi Arabia
- 5.2. South Africa
- 5.3. Rest of Middle East and Africa
Persulfates Industry REPORT HIGHLIGHTS
| Aspects | Details |
|---|---|
| Study Period | 2019-2033 |
| Base Year | 2024 |
| Estimated Year | 2025 |
| Forecast Period | 2025-2033 |
| Historical Period | 2019-2024 |
| Growth Rate | CAGR of > 3.00% from 2019-2033 |
| Segmentation |
|
Table of Contents
- 1. Introduction
- 1.1. Research Scope
- 1.2. Market Segmentation
- 1.3. Research Methodology
- 1.4. Definitions and Assumptions
- 2. Executive Summary
- 2.1. Introduction
- 3. Market Dynamics
- 3.1. Introduction
- 3.2. Market Drivers
- 3.2.1 Increasing Demand for Persulfates in the Electronics Industry; Growing Demand in the Paper
- 3.2.2 Pulp
- 3.2.3 and Textile Industry
- 3.3. Market Restrains
- 3.3.1. Issues Related to Storage and Transportation of Persulfates; Negative Impact of the COVID-19 Pandemic
- 3.4. Market Trends
- 3.4.1. Increasing Demand from the Electronics Segment
- 4. Market Factor Analysis
- 4.1. Porters Five Forces
- 4.2. Supply/Value Chain
- 4.3. PESTEL analysis
- 4.4. Market Entropy
- 4.5. Patent/Trademark Analysis
- 5. Global Persulfates Industry Analysis, Insights and Forecast, 2019-2031
- 5.1. Market Analysis, Insights and Forecast - by Type
- 5.1.1. Sodium Persulfate
- 5.1.2. Potassium Persulfate
- 5.1.3. Ammonium Persulfate
- 5.2. Market Analysis, Insights and Forecast - by Application
- 5.2.1. Polymer Initiator
- 5.2.2. Enhanced Oil Recovery
- 5.2.3. Oxidation, Bleaching, and Sizing Agent
- 5.2.4. Other Applications
- 5.3. Market Analysis, Insights and Forecast - by End-user Industry
- 5.3.1. Polymer
- 5.3.2. Pulp, Paper, and Textile
- 5.3.3. Electronics
- 5.3.4. Cosmetics and Personal Care
- 5.3.5. Oil and Gas
- 5.3.6. Water Treatment
- 5.3.7. Soil Remediation
- 5.3.8. Other End-user Industries
- 5.4. Market Analysis, Insights and Forecast - by Region
- 5.4.1. Asia Pacific
- 5.4.2. North America
- 5.4.3. Europe
- 5.4.4. South America
- 5.4.5. Middle East and Africa
- 5.1. Market Analysis, Insights and Forecast - by Type
- 6. Asia Pacific Persulfates Industry Analysis, Insights and Forecast, 2019-2031
- 6.1. Market Analysis, Insights and Forecast - by Type
- 6.1.1. Sodium Persulfate
- 6.1.2. Potassium Persulfate
- 6.1.3. Ammonium Persulfate
- 6.2. Market Analysis, Insights and Forecast - by Application
- 6.2.1. Polymer Initiator
- 6.2.2. Enhanced Oil Recovery
- 6.2.3. Oxidation, Bleaching, and Sizing Agent
- 6.2.4. Other Applications
- 6.3. Market Analysis, Insights and Forecast - by End-user Industry
- 6.3.1. Polymer
- 6.3.2. Pulp, Paper, and Textile
- 6.3.3. Electronics
- 6.3.4. Cosmetics and Personal Care
- 6.3.5. Oil and Gas
- 6.3.6. Water Treatment
- 6.3.7. Soil Remediation
- 6.3.8. Other End-user Industries
- 6.1. Market Analysis, Insights and Forecast - by Type
- 7. North America Persulfates Industry Analysis, Insights and Forecast, 2019-2031
- 7.1. Market Analysis, Insights and Forecast - by Type
- 7.1.1. Sodium Persulfate
- 7.1.2. Potassium Persulfate
- 7.1.3. Ammonium Persulfate
- 7.2. Market Analysis, Insights and Forecast - by Application
- 7.2.1. Polymer Initiator
- 7.2.2. Enhanced Oil Recovery
- 7.2.3. Oxidation, Bleaching, and Sizing Agent
- 7.2.4. Other Applications
- 7.3. Market Analysis, Insights and Forecast - by End-user Industry
- 7.3.1. Polymer
- 7.3.2. Pulp, Paper, and Textile
- 7.3.3. Electronics
- 7.3.4. Cosmetics and Personal Care
- 7.3.5. Oil and Gas
- 7.3.6. Water Treatment
- 7.3.7. Soil Remediation
- 7.3.8. Other End-user Industries
- 7.1. Market Analysis, Insights and Forecast - by Type
- 8. Europe Persulfates Industry Analysis, Insights and Forecast, 2019-2031
- 8.1. Market Analysis, Insights and Forecast - by Type
- 8.1.1. Sodium Persulfate
- 8.1.2. Potassium Persulfate
- 8.1.3. Ammonium Persulfate
- 8.2. Market Analysis, Insights and Forecast - by Application
- 8.2.1. Polymer Initiator
- 8.2.2. Enhanced Oil Recovery
- 8.2.3. Oxidation, Bleaching, and Sizing Agent
- 8.2.4. Other Applications
- 8.3. Market Analysis, Insights and Forecast - by End-user Industry
- 8.3.1. Polymer
- 8.3.2. Pulp, Paper, and Textile
- 8.3.3. Electronics
- 8.3.4. Cosmetics and Personal Care
- 8.3.5. Oil and Gas
- 8.3.6. Water Treatment
- 8.3.7. Soil Remediation
- 8.3.8. Other End-user Industries
- 8.1. Market Analysis, Insights and Forecast - by Type
- 9. South America Persulfates Industry Analysis, Insights and Forecast, 2019-2031
- 9.1. Market Analysis, Insights and Forecast - by Type
- 9.1.1. Sodium Persulfate
- 9.1.2. Potassium Persulfate
- 9.1.3. Ammonium Persulfate
- 9.2. Market Analysis, Insights and Forecast - by Application
- 9.2.1. Polymer Initiator
- 9.2.2. Enhanced Oil Recovery
- 9.2.3. Oxidation, Bleaching, and Sizing Agent
- 9.2.4. Other Applications
- 9.3. Market Analysis, Insights and Forecast - by End-user Industry
- 9.3.1. Polymer
- 9.3.2. Pulp, Paper, and Textile
- 9.3.3. Electronics
- 9.3.4. Cosmetics and Personal Care
- 9.3.5. Oil and Gas
- 9.3.6. Water Treatment
- 9.3.7. Soil Remediation
- 9.3.8. Other End-user Industries
- 9.1. Market Analysis, Insights and Forecast - by Type
- 10. Middle East and Africa Persulfates Industry Analysis, Insights and Forecast, 2019-2031
- 10.1. Market Analysis, Insights and Forecast - by Type
- 10.1.1. Sodium Persulfate
- 10.1.2. Potassium Persulfate
- 10.1.3. Ammonium Persulfate
- 10.2. Market Analysis, Insights and Forecast - by Application
- 10.2.1. Polymer Initiator
- 10.2.2. Enhanced Oil Recovery
- 10.2.3. Oxidation, Bleaching, and Sizing Agent
- 10.2.4. Other Applications
- 10.3. Market Analysis, Insights and Forecast - by End-user Industry
- 10.3.1. Polymer
- 10.3.2. Pulp, Paper, and Textile
- 10.3.3. Electronics
- 10.3.4. Cosmetics and Personal Care
- 10.3.5. Oil and Gas
- 10.3.6. Water Treatment
- 10.3.7. Soil Remediation
- 10.3.8. Other End-user Industries
- 10.1. Market Analysis, Insights and Forecast - by Type
- 11. Asia Pacific Persulfates Industry Analysis, Insights and Forecast, 2019-2031
- 11.1. Market Analysis, Insights and Forecast - By Country/Sub-region
- 11.1.1 China
- 11.1.2 India
- 11.1.3 Japan
- 11.1.4 South Korea
- 11.1.5 Rest of Asia Pacific
- 12. North America Persulfates Industry Analysis, Insights and Forecast, 2019-2031
- 12.1. Market Analysis, Insights and Forecast - By Country/Sub-region
- 12.1.1 United States
- 12.1.2 Canada
- 12.1.3 Mexico
- 13. Europe Persulfates Industry Analysis, Insights and Forecast, 2019-2031
- 13.1. Market Analysis, Insights and Forecast - By Country/Sub-region
- 13.1.1 Germany
- 13.1.2 United Kingdom
- 13.1.3 Italy
- 13.1.4 France
- 13.1.5 Rest of Europe
- 14. South America Persulfates Industry Analysis, Insights and Forecast, 2019-2031
- 14.1. Market Analysis, Insights and Forecast - By Country/Sub-region
- 14.1.1 Brazil
- 14.1.2 Argentina
- 14.1.3 Rest of South America
- 15. Middle East and Africa Persulfates Industry Analysis, Insights and Forecast, 2019-2031
- 15.1. Market Analysis, Insights and Forecast - By Country/Sub-region
- 15.1.1 Saudi Arabia
- 15.1.2 South Africa
- 15.1.3 Rest of Middle East and Africa
- 16. Competitive Analysis
- 16.1. Global Market Share Analysis 2024
- 16.2. Company Profiles
- 16.2.1 CHEMetrics Inc
- 16.2.1.1. Overview
- 16.2.1.2. Products
- 16.2.1.3. SWOT Analysis
- 16.2.1.4. Recent Developments
- 16.2.1.5. Financials (Based on Availability)
- 16.2.2 PeroxyChem (Evonik Industries AG)
- 16.2.2.1. Overview
- 16.2.2.2. Products
- 16.2.2.3. SWOT Analysis
- 16.2.2.4. Recent Developments
- 16.2.2.5. Financials (Based on Availability)
- 16.2.3 United Initiators
- 16.2.3.1. Overview
- 16.2.3.2. Products
- 16.2.3.3. SWOT Analysis
- 16.2.3.4. Recent Developments
- 16.2.3.5. Financials (Based on Availability)
- 16.2.4 Adeka Corporation
- 16.2.4.1. Overview
- 16.2.4.2. Products
- 16.2.4.3. SWOT Analysis
- 16.2.4.4. Recent Developments
- 16.2.4.5. Financials (Based on Availability)
- 16.2.5 Fujian ZhanHua Chemical Co Ltd
- 16.2.5.1. Overview
- 16.2.5.2. Products
- 16.2.5.3. SWOT Analysis
- 16.2.5.4. Recent Developments
- 16.2.5.5. Financials (Based on Availability)
- 16.2.6 Akkim Kimya
- 16.2.6.1. Overview
- 16.2.6.2. Products
- 16.2.6.3. SWOT Analysis
- 16.2.6.4. Recent Developments
- 16.2.6.5. Financials (Based on Availability)
- 16.2.7 Shaanxi Baohua Technologies Co Ltd
- 16.2.7.1. Overview
- 16.2.7.2. Products
- 16.2.7.3. SWOT Analysis
- 16.2.7.4. Recent Developments
- 16.2.7.5. Financials (Based on Availability)
- 16.2.8 Shanghai Ansin Chemical Co Ltd
- 16.2.8.1. Overview
- 16.2.8.2. Products
- 16.2.8.3. SWOT Analysis
- 16.2.8.4. Recent Developments
- 16.2.8.5. Financials (Based on Availability)
- 16.2.9 LANXESS
- 16.2.9.1. Overview
- 16.2.9.2. Products
- 16.2.9.3. SWOT Analysis
- 16.2.9.4. Recent Developments
- 16.2.9.5. Financials (Based on Availability)
- 16.2.10 Stars Chemical (YongAn) Co Ltd
- 16.2.10.1. Overview
- 16.2.10.2. Products
- 16.2.10.3. SWOT Analysis
- 16.2.10.4. Recent Developments
- 16.2.10.5. Financials (Based on Availability)
- 16.2.11 Mitsubishi Gas Chemical Company Inc
- 16.2.11.1. Overview
- 16.2.11.2. Products
- 16.2.11.3. SWOT Analysis
- 16.2.11.4. Recent Developments
- 16.2.11.5. Financials (Based on Availability)
- 16.2.12 Yatai Electrochemistry Co Ltd*List Not Exhaustive
- 16.2.12.1. Overview
- 16.2.12.2. Products
- 16.2.12.3. SWOT Analysis
- 16.2.12.4. Recent Developments
- 16.2.12.5. Financials (Based on Availability)
- 16.2.13 Powder Pack Chem
- 16.2.13.1. Overview
- 16.2.13.2. Products
- 16.2.13.3. SWOT Analysis
- 16.2.13.4. Recent Developments
- 16.2.13.5. Financials (Based on Availability)
- 16.2.14 VR Persulfates Pvt Ltd
- 16.2.14.1. Overview
- 16.2.14.2. Products
- 16.2.14.3. SWOT Analysis
- 16.2.14.4. Recent Developments
- 16.2.14.5. Financials (Based on Availability)
- 16.2.15 ABC Chemicals (Shanghai) Co Ltd
- 16.2.15.1. Overview
- 16.2.15.2. Products
- 16.2.15.3. SWOT Analysis
- 16.2.15.4. Recent Developments
- 16.2.15.5. Financials (Based on Availability)
- 16.2.1 CHEMetrics Inc
List of Figures
- Figure 1: Global Persulfates Industry Revenue Breakdown (Million, %) by Region 2024 & 2032
- Figure 2: Asia Pacific Persulfates Industry Revenue (Million), by Country 2024 & 2032
- Figure 3: Asia Pacific Persulfates Industry Revenue Share (%), by Country 2024 & 2032
- Figure 4: North America Persulfates Industry Revenue (Million), by Country 2024 & 2032
- Figure 5: North America Persulfates Industry Revenue Share (%), by Country 2024 & 2032
- Figure 6: Europe Persulfates Industry Revenue (Million), by Country 2024 & 2032
- Figure 7: Europe Persulfates Industry Revenue Share (%), by Country 2024 & 2032
- Figure 8: South America Persulfates Industry Revenue (Million), by Country 2024 & 2032
- Figure 9: South America Persulfates Industry Revenue Share (%), by Country 2024 & 2032
- Figure 10: Middle East and Africa Persulfates Industry Revenue (Million), by Country 2024 & 2032
- Figure 11: Middle East and Africa Persulfates Industry Revenue Share (%), by Country 2024 & 2032
- Figure 12: Asia Pacific Persulfates Industry Revenue (Million), by Type 2024 & 2032
- Figure 13: Asia Pacific Persulfates Industry Revenue Share (%), by Type 2024 & 2032
- Figure 14: Asia Pacific Persulfates Industry Revenue (Million), by Application 2024 & 2032
- Figure 15: Asia Pacific Persulfates Industry Revenue Share (%), by Application 2024 & 2032
- Figure 16: Asia Pacific Persulfates Industry Revenue (Million), by End-user Industry 2024 & 2032
- Figure 17: Asia Pacific Persulfates Industry Revenue Share (%), by End-user Industry 2024 & 2032
- Figure 18: Asia Pacific Persulfates Industry Revenue (Million), by Country 2024 & 2032
- Figure 19: Asia Pacific Persulfates Industry Revenue Share (%), by Country 2024 & 2032
- Figure 20: North America Persulfates Industry Revenue (Million), by Type 2024 & 2032
- Figure 21: North America Persulfates Industry Revenue Share (%), by Type 2024 & 2032
- Figure 22: North America Persulfates Industry Revenue (Million), by Application 2024 & 2032
- Figure 23: North America Persulfates Industry Revenue Share (%), by Application 2024 & 2032
- Figure 24: North America Persulfates Industry Revenue (Million), by End-user Industry 2024 & 2032
- Figure 25: North America Persulfates Industry Revenue Share (%), by End-user Industry 2024 & 2032
- Figure 26: North America Persulfates Industry Revenue (Million), by Country 2024 & 2032
- Figure 27: North America Persulfates Industry Revenue Share (%), by Country 2024 & 2032
- Figure 28: Europe Persulfates Industry Revenue (Million), by Type 2024 & 2032
- Figure 29: Europe Persulfates Industry Revenue Share (%), by Type 2024 & 2032
- Figure 30: Europe Persulfates Industry Revenue (Million), by Application 2024 & 2032
- Figure 31: Europe Persulfates Industry Revenue Share (%), by Application 2024 & 2032
- Figure 32: Europe Persulfates Industry Revenue (Million), by End-user Industry 2024 & 2032
- Figure 33: Europe Persulfates Industry Revenue Share (%), by End-user Industry 2024 & 2032
- Figure 34: Europe Persulfates Industry Revenue (Million), by Country 2024 & 2032
- Figure 35: Europe Persulfates Industry Revenue Share (%), by Country 2024 & 2032
- Figure 36: South America Persulfates Industry Revenue (Million), by Type 2024 & 2032
- Figure 37: South America Persulfates Industry Revenue Share (%), by Type 2024 & 2032
- Figure 38: South America Persulfates Industry Revenue (Million), by Application 2024 & 2032
- Figure 39: South America Persulfates Industry Revenue Share (%), by Application 2024 & 2032
- Figure 40: South America Persulfates Industry Revenue (Million), by End-user Industry 2024 & 2032
- Figure 41: South America Persulfates Industry Revenue Share (%), by End-user Industry 2024 & 2032
- Figure 42: South America Persulfates Industry Revenue (Million), by Country 2024 & 2032
- Figure 43: South America Persulfates Industry Revenue Share (%), by Country 2024 & 2032
- Figure 44: Middle East and Africa Persulfates Industry Revenue (Million), by Type 2024 & 2032
- Figure 45: Middle East and Africa Persulfates Industry Revenue Share (%), by Type 2024 & 2032
- Figure 46: Middle East and Africa Persulfates Industry Revenue (Million), by Application 2024 & 2032
- Figure 47: Middle East and Africa Persulfates Industry Revenue Share (%), by Application 2024 & 2032
- Figure 48: Middle East and Africa Persulfates Industry Revenue (Million), by End-user Industry 2024 & 2032
- Figure 49: Middle East and Africa Persulfates Industry Revenue Share (%), by End-user Industry 2024 & 2032
- Figure 50: Middle East and Africa Persulfates Industry Revenue (Million), by Country 2024 & 2032
- Figure 51: Middle East and Africa Persulfates Industry Revenue Share (%), by Country 2024 & 2032
List of Tables
- Table 1: Global Persulfates Industry Revenue Million Forecast, by Region 2019 & 2032
- Table 2: Global Persulfates Industry Revenue Million Forecast, by Type 2019 & 2032
- Table 3: Global Persulfates Industry Revenue Million Forecast, by Application 2019 & 2032
- Table 4: Global Persulfates Industry Revenue Million Forecast, by End-user Industry 2019 & 2032
- Table 5: Global Persulfates Industry Revenue Million Forecast, by Region 2019 & 2032
- Table 6: Global Persulfates Industry Revenue Million Forecast, by Country 2019 & 2032
- Table 7: China Persulfates Industry Revenue (Million) Forecast, by Application 2019 & 2032
- Table 8: India Persulfates Industry Revenue (Million) Forecast, by Application 2019 & 2032
- Table 9: Japan Persulfates Industry Revenue (Million) Forecast, by Application 2019 & 2032
- Table 10: South Korea Persulfates Industry Revenue (Million) Forecast, by Application 2019 & 2032
- Table 11: Rest of Asia Pacific Persulfates Industry Revenue (Million) Forecast, by Application 2019 & 2032
- Table 12: Global Persulfates Industry Revenue Million Forecast, by Country 2019 & 2032
- Table 13: United States Persulfates Industry Revenue (Million) Forecast, by Application 2019 & 2032
- Table 14: Canada Persulfates Industry Revenue (Million) Forecast, by Application 2019 & 2032
- Table 15: Mexico Persulfates Industry Revenue (Million) Forecast, by Application 2019 & 2032
- Table 16: Global Persulfates Industry Revenue Million Forecast, by Country 2019 & 2032
- Table 17: Germany Persulfates Industry Revenue (Million) Forecast, by Application 2019 & 2032
- Table 18: United Kingdom Persulfates Industry Revenue (Million) Forecast, by Application 2019 & 2032
- Table 19: Italy Persulfates Industry Revenue (Million) Forecast, by Application 2019 & 2032
- Table 20: France Persulfates Industry Revenue (Million) Forecast, by Application 2019 & 2032
- Table 21: Rest of Europe Persulfates Industry Revenue (Million) Forecast, by Application 2019 & 2032
- Table 22: Global Persulfates Industry Revenue Million Forecast, by Country 2019 & 2032
- Table 23: Brazil Persulfates Industry Revenue (Million) Forecast, by Application 2019 & 2032
- Table 24: Argentina Persulfates Industry Revenue (Million) Forecast, by Application 2019 & 2032
- Table 25: Rest of South America Persulfates Industry Revenue (Million) Forecast, by Application 2019 & 2032
- Table 26: Global Persulfates Industry Revenue Million Forecast, by Country 2019 & 2032
- Table 27: Saudi Arabia Persulfates Industry Revenue (Million) Forecast, by Application 2019 & 2032
- Table 28: South Africa Persulfates Industry Revenue (Million) Forecast, by Application 2019 & 2032
- Table 29: Rest of Middle East and Africa Persulfates Industry Revenue (Million) Forecast, by Application 2019 & 2032
- Table 30: Global Persulfates Industry Revenue Million Forecast, by Type 2019 & 2032
- Table 31: Global Persulfates Industry Revenue Million Forecast, by Application 2019 & 2032
- Table 32: Global Persulfates Industry Revenue Million Forecast, by End-user Industry 2019 & 2032
- Table 33: Global Persulfates Industry Revenue Million Forecast, by Country 2019 & 2032
- Table 34: China Persulfates Industry Revenue (Million) Forecast, by Application 2019 & 2032
- Table 35: India Persulfates Industry Revenue (Million) Forecast, by Application 2019 & 2032
- Table 36: Japan Persulfates Industry Revenue (Million) Forecast, by Application 2019 & 2032
- Table 37: South Korea Persulfates Industry Revenue (Million) Forecast, by Application 2019 & 2032
- Table 38: Rest of Asia Pacific Persulfates Industry Revenue (Million) Forecast, by Application 2019 & 2032
- Table 39: Global Persulfates Industry Revenue Million Forecast, by Type 2019 & 2032
- Table 40: Global Persulfates Industry Revenue Million Forecast, by Application 2019 & 2032
- Table 41: Global Persulfates Industry Revenue Million Forecast, by End-user Industry 2019 & 2032
- Table 42: Global Persulfates Industry Revenue Million Forecast, by Country 2019 & 2032
- Table 43: United States Persulfates Industry Revenue (Million) Forecast, by Application 2019 & 2032
- Table 44: Canada Persulfates Industry Revenue (Million) Forecast, by Application 2019 & 2032
- Table 45: Mexico Persulfates Industry Revenue (Million) Forecast, by Application 2019 & 2032
- Table 46: Global Persulfates Industry Revenue Million Forecast, by Type 2019 & 2032
- Table 47: Global Persulfates Industry Revenue Million Forecast, by Application 2019 & 2032
- Table 48: Global Persulfates Industry Revenue Million Forecast, by End-user Industry 2019 & 2032
- Table 49: Global Persulfates Industry Revenue Million Forecast, by Country 2019 & 2032
- Table 50: Germany Persulfates Industry Revenue (Million) Forecast, by Application 2019 & 2032
- Table 51: United Kingdom Persulfates Industry Revenue (Million) Forecast, by Application 2019 & 2032
- Table 52: Italy Persulfates Industry Revenue (Million) Forecast, by Application 2019 & 2032
- Table 53: France Persulfates Industry Revenue (Million) Forecast, by Application 2019 & 2032
- Table 54: Rest of Europe Persulfates Industry Revenue (Million) Forecast, by Application 2019 & 2032
- Table 55: Global Persulfates Industry Revenue Million Forecast, by Type 2019 & 2032
- Table 56: Global Persulfates Industry Revenue Million Forecast, by Application 2019 & 2032
- Table 57: Global Persulfates Industry Revenue Million Forecast, by End-user Industry 2019 & 2032
- Table 58: Global Persulfates Industry Revenue Million Forecast, by Country 2019 & 2032
- Table 59: Brazil Persulfates Industry Revenue (Million) Forecast, by Application 2019 & 2032
- Table 60: Argentina Persulfates Industry Revenue (Million) Forecast, by Application 2019 & 2032
- Table 61: Rest of South America Persulfates Industry Revenue (Million) Forecast, by Application 2019 & 2032
- Table 62: Global Persulfates Industry Revenue Million Forecast, by Type 2019 & 2032
- Table 63: Global Persulfates Industry Revenue Million Forecast, by Application 2019 & 2032
- Table 64: Global Persulfates Industry Revenue Million Forecast, by End-user Industry 2019 & 2032
- Table 65: Global Persulfates Industry Revenue Million Forecast, by Country 2019 & 2032
- Table 66: Saudi Arabia Persulfates Industry Revenue (Million) Forecast, by Application 2019 & 2032
- Table 67: South Africa Persulfates Industry Revenue (Million) Forecast, by Application 2019 & 2032
- Table 68: Rest of Middle East and Africa Persulfates Industry Revenue (Million) Forecast, by Application 2019 & 2032
Frequently Asked Questions
1. What is the projected Compound Annual Growth Rate (CAGR) of the Persulfates Industry?
The projected CAGR is approximately > 3.00%.
2. Which companies are prominent players in the Persulfates Industry?
Key companies in the market include CHEMetrics Inc, PeroxyChem (Evonik Industries AG), United Initiators, Adeka Corporation, Fujian ZhanHua Chemical Co Ltd, Akkim Kimya, Shaanxi Baohua Technologies Co Ltd, Shanghai Ansin Chemical Co Ltd, LANXESS, Stars Chemical (YongAn) Co Ltd, Mitsubishi Gas Chemical Company Inc, Yatai Electrochemistry Co Ltd*List Not Exhaustive, Powder Pack Chem, VR Persulfates Pvt Ltd, ABC Chemicals (Shanghai) Co Ltd.
3. What are the main segments of the Persulfates Industry?
The market segments include Type, Application, End-user Industry.
4. Can you provide details about the market size?
The market size is estimated to be USD XX Million as of 2022.
5. What are some drivers contributing to market growth?
Increasing Demand for Persulfates in the Electronics Industry; Growing Demand in the Paper. Pulp. and Textile Industry.
6. What are the notable trends driving market growth?
Increasing Demand from the Electronics Segment.
7. Are there any restraints impacting market growth?
Issues Related to Storage and Transportation of Persulfates; Negative Impact of the COVID-19 Pandemic.
8. Can you provide examples of recent developments in the market?
N/A
9. What pricing options are available for accessing the report?
Pricing options include single-user, multi-user, and enterprise licenses priced at USD 4750, USD 5250, and USD 8750 respectively.
10. Is the market size provided in terms of value or volume?
The market size is provided in terms of value, measured in Million.
11. Are there any specific market keywords associated with the report?
Yes, the market keyword associated with the report is "Persulfates Industry," which aids in identifying and referencing the specific market segment covered.
12. How do I determine which pricing option suits my needs best?
The pricing options vary based on user requirements and access needs. Individual users may opt for single-user licenses, while businesses requiring broader access may choose multi-user or enterprise licenses for cost-effective access to the report.
13. Are there any additional resources or data provided in the Persulfates Industry report?
While the report offers comprehensive insights, it's advisable to review the specific contents or supplementary materials provided to ascertain if additional resources or data are available.
14. How can I stay updated on further developments or reports in the Persulfates Industry?
To stay informed about further developments, trends, and reports in the Persulfates Industry, consider subscribing to industry newsletters, following relevant companies and organizations, or regularly checking reputable industry news sources and publications.
Methodology
Step 1 - Identification of Relevant Samples Size from Population Database


Step 2 - Approaches for Defining Global Market Size (Value, Volume* & Price*)

Note*: In applicable scenarios
Step 3 - Data Sources
Primary Research
- Web Analytics
- Survey Reports
- Research Institute
- Latest Research Reports
- Opinion Leaders
Secondary Research
- Annual Reports
- White Paper
- Latest Press Release
- Industry Association
- Paid Database
- Investor Presentations

Step 4 - Data Triangulation
Involves using different sources of information in order to increase the validity of a study
These sources are likely to be stakeholders in a program - participants, other researchers, program staff, other community members, and so on.
Then we put all data in single framework & apply various statistical tools to find out the dynamic on the market.
During the analysis stage, feedback from the stakeholder groups would be compared to determine areas of agreement as well as areas of divergence


