
Key Insights
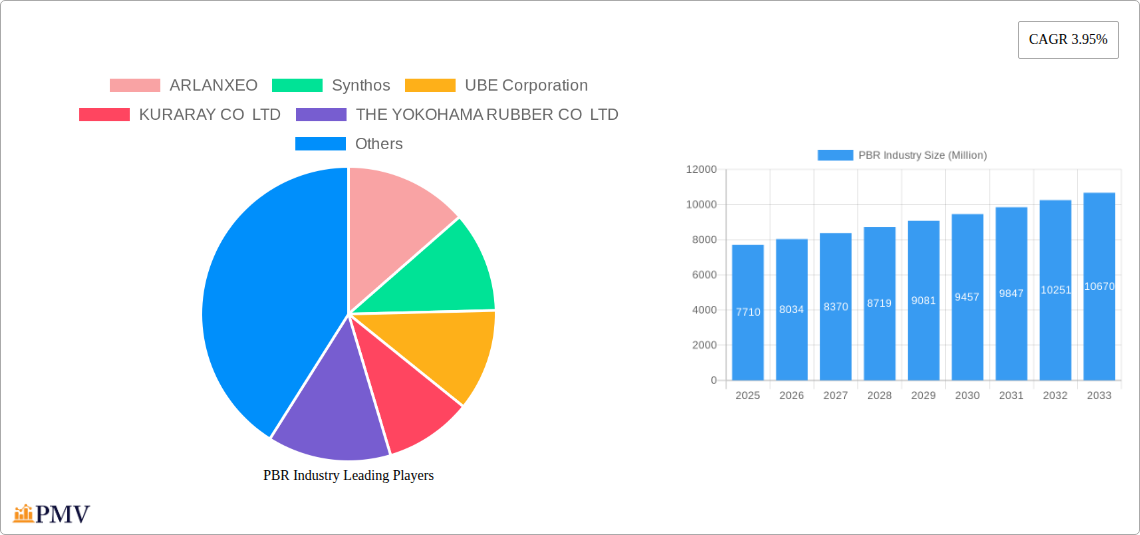
The Polybutadiene Rubber (PBR) market, valued at $7.71 billion in 2025, is projected to experience steady growth, driven primarily by the expanding tire manufacturing industry, particularly in the Asia-Pacific region. The increasing demand for high-performance tires in passenger vehicles and commercial trucks fuels this growth. Furthermore, the burgeoning sports and footwear sectors contribute significantly to PBR consumption, as its elasticity and durability make it an ideal material for shoe soles, athletic equipment, and other sports accessories. Technological advancements leading to improved PBR formulations with enhanced properties such as better abrasion resistance and flexibility are also bolstering market expansion. While fluctuating raw material prices and economic uncertainties pose potential restraints, the overall outlook for the PBR market remains positive, with a projected Compound Annual Growth Rate (CAGR) of 3.95% from 2025 to 2033. Growth will likely be concentrated in emerging economies experiencing rapid industrialization and infrastructural development. Major players like ARLANXEO, Synthos, and others are investing in research and development to enhance product offerings and expand their market presence, further driving competition and innovation within the industry.
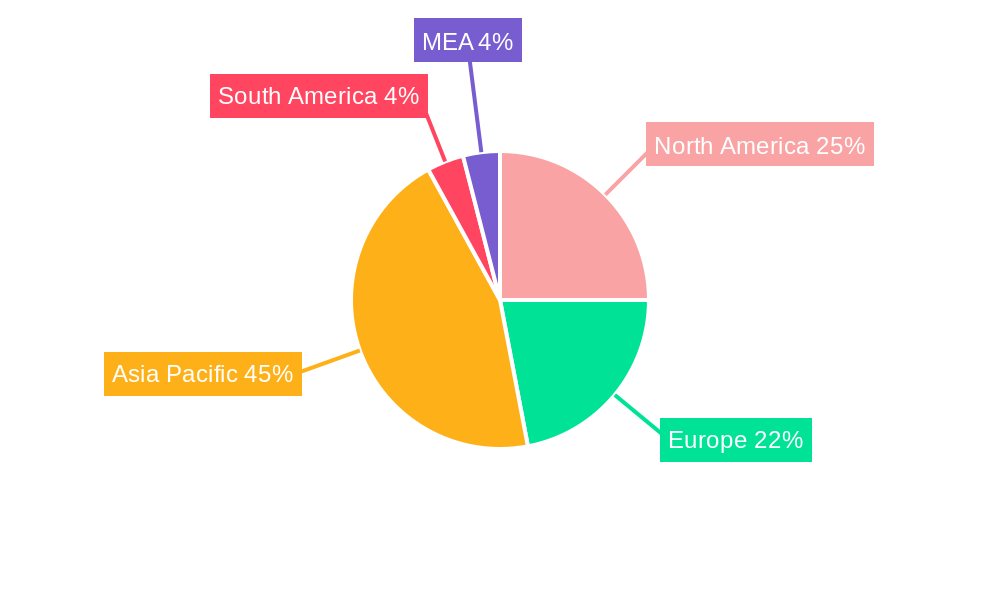
The competitive landscape is characterized by a mix of large multinational corporations and regional players. While established companies benefit from economies of scale and well-established distribution networks, smaller companies are focusing on niche applications and specialized product development to carve out market share. The geographic distribution of PBR production and consumption is skewed towards Asia-Pacific, driven by the high concentration of tire manufacturing and other key industries in countries like China, Japan, and India. However, North America and Europe also represent significant markets, contributing substantially to overall demand. Future market growth will depend on several factors including the global economic climate, advancements in tire technology, and the evolving demand for PBR in diverse applications beyond the traditional sectors. Sustainable production practices and environmentally friendly PBR alternatives are also expected to gain traction in the coming years, influencing industry dynamics.
This comprehensive report delivers an in-depth analysis of the global polybutadiene rubber (PBR) industry, providing invaluable insights for businesses, investors, and researchers seeking to navigate this dynamic market. With a study period spanning 2019-2033, a base year of 2025, and a forecast period of 2025-2033, this report offers a holistic view of past performance, current trends, and future projections. The report covers key market segments, competitive landscapes, and growth drivers, with a specific focus on Million-dollar values for comprehensive market sizing.
PBR Industry Market Structure & Competitive Dynamics
This section analyzes the competitive landscape of the PBR industry, evaluating market concentration, innovation, regulatory frameworks, substitutes, end-user trends, and mergers & acquisitions (M&A) activity. The global PBR market is moderately concentrated, with several major players holding significant market share. However, the presence of numerous smaller players indicates a competitive environment.
Market Concentration: The top five players collectively hold an estimated xx% market share in 2025, indicating moderate concentration. This is expected to slightly decrease to xx% by 2033 due to increased competition.
Innovation Ecosystems: Significant investments in R&D are driving innovation in PBR production and applications, particularly in sustainable and high-performance materials.
Regulatory Frameworks: Environmental regulations, particularly concerning emissions and waste management, significantly impact PBR production and necessitate continuous improvement in manufacturing processes.
Product Substitutes: The main substitutes for PBR include styrene-butadiene rubber (SBR) and natural rubber. However, PBR retains advantages in specific applications due to its superior properties.
End-User Trends: The growing demand for high-performance tires and specialized footwear fuels the growth of the PBR market. Increasing demand from the automotive industry and the expansion of the sports goods industry are also major factors.
M&A Activities: The PBR industry has witnessed several M&A activities in recent years, with deal values reaching hundreds of millions of USD. These activities have led to increased market consolidation and enhanced competitive dynamics. For example, a significant acquisition in 2024 resulted in a xx Million USD deal value, further shaping market dynamics.
PBR Industry Industry Trends & Insights
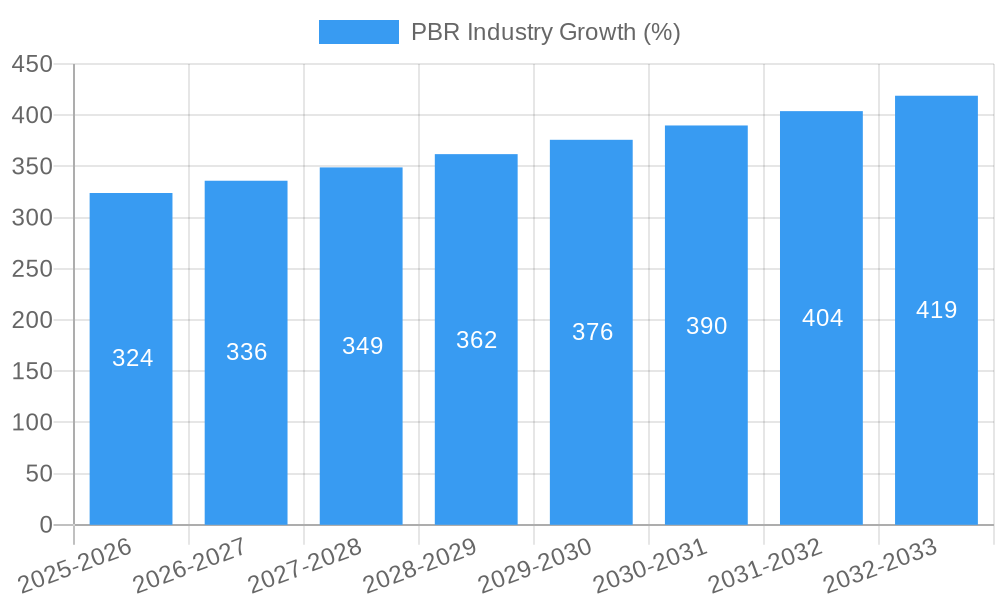
This section explores key trends and insights shaping the PBR industry, including market growth drivers, technological advancements, consumer preferences, and competitive dynamics. The global PBR market exhibits a robust growth trajectory, driven by factors such as increased automotive production, expanding construction sectors, and a rising demand for high-performance materials in various end-use applications. The market is projected to experience a Compound Annual Growth Rate (CAGR) of xx% from 2025 to 2033, reaching a value of xx Million USD by 2033. This growth is further driven by increasing investments in R&D leading to innovative product development and improved process efficiency, resulting in xx% market penetration by 2033. Technological disruptions, including the development of bio-based PBR and advanced polymerization techniques, further contribute to this growth. Consumer preferences for sustainable and high-performance products are also influencing the market. Furthermore, the ever-evolving competitive landscape with new entrants and strategic partnerships presents both opportunities and challenges for existing players.
Dominant Markets & Segments in PBR Industry
This section identifies the leading regions, countries, and application segments within the PBR market. The tire manufacturing segment is currently the dominant application for PBR, accounting for approximately xx% of total consumption.
Tire Manufacturing: The dominance of the tire manufacturing segment is driven by the increasing demand for automobiles globally, particularly in developing economies. Key drivers include expanding automotive industries and supportive government policies that promote road infrastructure development. This segment is expected to continue its dominance, exhibiting steady growth throughout the forecast period.
Footwear: This segment benefits from the increasing demand for athletic footwear and specialized sports shoes. Growth is supported by rising disposable incomes and increased focus on fitness and sporting activities.
Sports Accessories: The sports accessories segment shows modest growth, primarily driven by the increasing popularity of team sports and outdoor activities.
Other Applications: This segment encompasses various applications of PBR in chemicals, polymer modification, and other industries, contributing to steady but moderate market growth.
Asia Pacific is expected to remain the leading region for PBR consumption, driven by strong economic growth and expanding automotive production in countries such as China and India. The region’s well-established industrial base and supportive government policies contribute to its dominance.
PBR Industry Product Innovations
Recent product innovations in the PBR industry focus on developing high-performance grades with improved properties like enhanced durability, abrasion resistance, and lower rolling resistance. This is achieved through advancements in polymerization techniques and the use of novel additives. These innovations cater to the growing demand for sustainable and high-performance materials in various applications, providing manufacturers with a competitive advantage in the market.
Report Segmentation & Scope
This report segments the PBR market based on applications: Tire Manufacturing, Footwear, Sports Accessories, and Other Applications (Chemicals, Polymer Modification, etc.). Each segment is analyzed based on historical data (2019-2024), current market size (2025), and future projections (2025-2033). The report also includes a competitive landscape analysis for each segment, highlighting key players and their market share. Growth projections vary across segments, with the Tire Manufacturing segment showcasing the most significant growth potential.
Key Drivers of PBR Industry Growth
The PBR industry's growth is primarily driven by several factors: the robust growth of the automotive industry, especially in developing countries, the rising demand for high-performance tires requiring PBR's unique properties, and increased demand for athletic footwear and sports accessories. Furthermore, technological advancements in PBR production, resulting in enhanced properties and cost-effectiveness, contribute to market expansion. Government policies and infrastructure development also play a crucial role in shaping the market's growth trajectory.
Challenges in the PBR Industry Sector
The PBR industry faces challenges such as fluctuating raw material prices (butadiene), stringent environmental regulations impacting production costs, and intense competition from substitute materials. Supply chain disruptions, particularly those experienced in recent years, also pose significant challenges, impacting production and market stability. These factors can lead to price volatility and affect the profitability of PBR producers.
Leading Players in the PBR Industry Market
- ARLANXEO
- Synthos
- UBE Corporation
- KURARAY CO LTD
- THE YOKOHAMA RUBBER CO LTD
- ENEOS Materials Corporation
- Reliance Industries Limited
- ZEON CORPORATION
- KUMHO PETROCHEMICAL
- LANXESS
- SABIC
- Trinseo
- LG Chem
- Versalis S p A
- Indian Oil Corporation Ltd
- SIBUR International GmbH
Key Developments in PBR Industry Sector
- February 2023: Arlanxeo commenced operations at a new 65 ktpa polybutadiene rubber production plant in southern Brazil, strengthening its Latin American presence.
- March 2022: Indian Oil Corporation Limited announced plans to build a 60 ktpa PBR plant in Panipat, India, with a USD 169 Million investment.
Strategic PBR Industry Market Outlook
The future of the PBR industry appears promising, with continued growth driven by the expanding global automotive sector, increasing demand for high-performance materials, and ongoing technological advancements. Strategic opportunities lie in developing sustainable and high-performance PBR grades, optimizing production processes, and exploring new applications in niche markets. The industry will also need to adapt to evolving regulatory landscapes and supply chain complexities to ensure sustained growth and profitability.
PBR Industry Segmentation
-
1. Application
- 1.1. Tire Manufacturing
- 1.2. Footwear
- 1.3. Sports Accessories
- 1.4. Other Ap
PBR Industry Segmentation By Geography
-
1. Asia Pacific
- 1.1. China
- 1.2. India
- 1.3. Japan
- 1.4. South Korea
- 1.5. Indonesia
- 1.6. Malaysia
- 1.7. Thailand
- 1.8. Vietnam
- 1.9. Rest of Asia Pacific
-
2. North America
- 2.1. United States
- 2.2. Canada
- 2.3. Mexico
-
3. Europe
- 3.1. Germany
- 3.2. United Kingdom
- 3.3. Italy
- 3.4. France
- 3.5. Spain
- 3.6. Russia
- 3.7. NORDIC Countries
- 3.8. Turkey
- 3.9. Rest of Europe
-
4. South America
- 4.1. Brazil
- 4.2. Argentina
- 4.3. Colombia
- 4.4. Rest of South America
-
5. Middle East and Africa
- 5.1. Saudi Arabia
- 5.2. South Africa
- 5.3. Qatar
- 5.4. UAE
- 5.5. Nigeria
- 5.6. Egypt
- 5.7. Rest of Middle East and Africa
PBR Industry REPORT HIGHLIGHTS
| Aspects | Details |
|---|---|
| Study Period | 2019-2033 |
| Base Year | 2024 |
| Estimated Year | 2025 |
| Forecast Period | 2025-2033 |
| Historical Period | 2019-2024 |
| Growth Rate | CAGR of 3.95% from 2019-2033 |
| Segmentation |
|
Table of Contents
- 1. Introduction
- 1.1. Research Scope
- 1.2. Market Segmentation
- 1.3. Research Methodology
- 1.4. Definitions and Assumptions
- 2. Executive Summary
- 2.1. Introduction
- 3. Market Dynamics
- 3.1. Introduction
- 3.2. Market Drivers
- 3.2.1. Increasing Demand From the Automobile Industry; Growth in the Synthetic Rubber Industry; Other Drivers
- 3.3. Market Restrains
- 3.3.1. Stringent Enviornmental Regulations; Health Concerns Regarding Exposure to Polybutadiene
- 3.4. Market Trends
- 3.4.1. Tire Manufacturing Application Segment to Dominate The Market
- 4. Market Factor Analysis
- 4.1. Porters Five Forces
- 4.2. Supply/Value Chain
- 4.3. PESTEL analysis
- 4.4. Market Entropy
- 4.5. Patent/Trademark Analysis
- 5. Global PBR Industry Analysis, Insights and Forecast, 2019-2031
- 5.1. Market Analysis, Insights and Forecast - by Application
- 5.1.1. Tire Manufacturing
- 5.1.2. Footwear
- 5.1.3. Sports Accessories
- 5.1.4. Other Ap
- 5.2. Market Analysis, Insights and Forecast - by Region
- 5.2.1. Asia Pacific
- 5.2.2. North America
- 5.2.3. Europe
- 5.2.4. South America
- 5.2.5. Middle East and Africa
- 5.1. Market Analysis, Insights and Forecast - by Application
- 6. Asia Pacific PBR Industry Analysis, Insights and Forecast, 2019-2031
- 6.1. Market Analysis, Insights and Forecast - by Application
- 6.1.1. Tire Manufacturing
- 6.1.2. Footwear
- 6.1.3. Sports Accessories
- 6.1.4. Other Ap
- 6.1. Market Analysis, Insights and Forecast - by Application
- 7. North America PBR Industry Analysis, Insights and Forecast, 2019-2031
- 7.1. Market Analysis, Insights and Forecast - by Application
- 7.1.1. Tire Manufacturing
- 7.1.2. Footwear
- 7.1.3. Sports Accessories
- 7.1.4. Other Ap
- 7.1. Market Analysis, Insights and Forecast - by Application
- 8. Europe PBR Industry Analysis, Insights and Forecast, 2019-2031
- 8.1. Market Analysis, Insights and Forecast - by Application
- 8.1.1. Tire Manufacturing
- 8.1.2. Footwear
- 8.1.3. Sports Accessories
- 8.1.4. Other Ap
- 8.1. Market Analysis, Insights and Forecast - by Application
- 9. South America PBR Industry Analysis, Insights and Forecast, 2019-2031
- 9.1. Market Analysis, Insights and Forecast - by Application
- 9.1.1. Tire Manufacturing
- 9.1.2. Footwear
- 9.1.3. Sports Accessories
- 9.1.4. Other Ap
- 9.1. Market Analysis, Insights and Forecast - by Application
- 10. Middle East and Africa PBR Industry Analysis, Insights and Forecast, 2019-2031
- 10.1. Market Analysis, Insights and Forecast - by Application
- 10.1.1. Tire Manufacturing
- 10.1.2. Footwear
- 10.1.3. Sports Accessories
- 10.1.4. Other Ap
- 10.1. Market Analysis, Insights and Forecast - by Application
- 11. Europe PBR Industry Analysis, Insights and Forecast, 2019-2031
- 11.1. Market Analysis, Insights and Forecast - By Country/Sub-region
- 11.1.1 Germany
- 11.1.2 United Kingdom
- 11.1.3 France
- 11.1.4 Spain
- 11.1.5 Italy
- 11.1.6 Spain
- 11.1.7 Belgium
- 11.1.8 Netherland
- 11.1.9 Nordics
- 11.1.10 Rest of Europe
- 12. Asia Pacific PBR Industry Analysis, Insights and Forecast, 2019-2031
- 12.1. Market Analysis, Insights and Forecast - By Country/Sub-region
- 12.1.1 China
- 12.1.2 Japan
- 12.1.3 India
- 12.1.4 South Korea
- 12.1.5 Southeast Asia
- 12.1.6 Australia
- 12.1.7 Indonesia
- 12.1.8 Phillipes
- 12.1.9 Singapore
- 12.1.10 Thailandc
- 12.1.11 Rest of Asia Pacific
- 13. South America PBR Industry Analysis, Insights and Forecast, 2019-2031
- 13.1. Market Analysis, Insights and Forecast - By Country/Sub-region
- 13.1.1 Brazil
- 13.1.2 Argentina
- 13.1.3 Peru
- 13.1.4 Chile
- 13.1.5 Colombia
- 13.1.6 Ecuador
- 13.1.7 Venezuela
- 13.1.8 Rest of South America
- 14. North America PBR Industry Analysis, Insights and Forecast, 2019-2031
- 14.1. Market Analysis, Insights and Forecast - By Country/Sub-region
- 14.1.1 United States
- 14.1.2 Canada
- 14.1.3 Mexico
- 15. MEA PBR Industry Analysis, Insights and Forecast, 2019-2031
- 15.1. Market Analysis, Insights and Forecast - By Country/Sub-region
- 15.1.1 United Arab Emirates
- 15.1.2 Saudi Arabia
- 15.1.3 South Africa
- 15.1.4 Rest of Middle East and Africa
- 16. Competitive Analysis
- 16.1. Global Market Share Analysis 2024
- 16.2. Company Profiles
- 16.2.1 ARLANXEO
- 16.2.1.1. Overview
- 16.2.1.2. Products
- 16.2.1.3. SWOT Analysis
- 16.2.1.4. Recent Developments
- 16.2.1.5. Financials (Based on Availability)
- 16.2.2 Synthos
- 16.2.2.1. Overview
- 16.2.2.2. Products
- 16.2.2.3. SWOT Analysis
- 16.2.2.4. Recent Developments
- 16.2.2.5. Financials (Based on Availability)
- 16.2.3 UBE Corporation
- 16.2.3.1. Overview
- 16.2.3.2. Products
- 16.2.3.3. SWOT Analysis
- 16.2.3.4. Recent Developments
- 16.2.3.5. Financials (Based on Availability)
- 16.2.4 KURARAY CO LTD
- 16.2.4.1. Overview
- 16.2.4.2. Products
- 16.2.4.3. SWOT Analysis
- 16.2.4.4. Recent Developments
- 16.2.4.5. Financials (Based on Availability)
- 16.2.5 THE YOKOHAMA RUBBER CO LTD
- 16.2.5.1. Overview
- 16.2.5.2. Products
- 16.2.5.3. SWOT Analysis
- 16.2.5.4. Recent Developments
- 16.2.5.5. Financials (Based on Availability)
- 16.2.6 ENEOS Materials Corporation
- 16.2.6.1. Overview
- 16.2.6.2. Products
- 16.2.6.3. SWOT Analysis
- 16.2.6.4. Recent Developments
- 16.2.6.5. Financials (Based on Availability)
- 16.2.7 Reliance Industries Limited
- 16.2.7.1. Overview
- 16.2.7.2. Products
- 16.2.7.3. SWOT Analysis
- 16.2.7.4. Recent Developments
- 16.2.7.5. Financials (Based on Availability)
- 16.2.8 ZEON CORPORATION
- 16.2.8.1. Overview
- 16.2.8.2. Products
- 16.2.8.3. SWOT Analysis
- 16.2.8.4. Recent Developments
- 16.2.8.5. Financials (Based on Availability)
- 16.2.9 KUMHO PETROCHEMICAL
- 16.2.9.1. Overview
- 16.2.9.2. Products
- 16.2.9.3. SWOT Analysis
- 16.2.9.4. Recent Developments
- 16.2.9.5. Financials (Based on Availability)
- 16.2.10 LANXESS
- 16.2.10.1. Overview
- 16.2.10.2. Products
- 16.2.10.3. SWOT Analysis
- 16.2.10.4. Recent Developments
- 16.2.10.5. Financials (Based on Availability)
- 16.2.11 SABIC
- 16.2.11.1. Overview
- 16.2.11.2. Products
- 16.2.11.3. SWOT Analysis
- 16.2.11.4. Recent Developments
- 16.2.11.5. Financials (Based on Availability)
- 16.2.12 Trinseo
- 16.2.12.1. Overview
- 16.2.12.2. Products
- 16.2.12.3. SWOT Analysis
- 16.2.12.4. Recent Developments
- 16.2.12.5. Financials (Based on Availability)
- 16.2.13 LG Chem
- 16.2.13.1. Overview
- 16.2.13.2. Products
- 16.2.13.3. SWOT Analysis
- 16.2.13.4. Recent Developments
- 16.2.13.5. Financials (Based on Availability)
- 16.2.14 Versalis S p A *List Not Exhaustive
- 16.2.14.1. Overview
- 16.2.14.2. Products
- 16.2.14.3. SWOT Analysis
- 16.2.14.4. Recent Developments
- 16.2.14.5. Financials (Based on Availability)
- 16.2.15 Indian Oil Corporation Ltd
- 16.2.15.1. Overview
- 16.2.15.2. Products
- 16.2.15.3. SWOT Analysis
- 16.2.15.4. Recent Developments
- 16.2.15.5. Financials (Based on Availability)
- 16.2.16 SIBUR International GmbH
- 16.2.16.1. Overview
- 16.2.16.2. Products
- 16.2.16.3. SWOT Analysis
- 16.2.16.4. Recent Developments
- 16.2.16.5. Financials (Based on Availability)
- 16.2.1 ARLANXEO
List of Figures
- Figure 1: Global PBR Industry Revenue Breakdown (Million, %) by Region 2024 & 2032
- Figure 2: Europe PBR Industry Revenue (Million), by Country 2024 & 2032
- Figure 3: Europe PBR Industry Revenue Share (%), by Country 2024 & 2032
- Figure 4: Asia Pacific PBR Industry Revenue (Million), by Country 2024 & 2032
- Figure 5: Asia Pacific PBR Industry Revenue Share (%), by Country 2024 & 2032
- Figure 6: South America PBR Industry Revenue (Million), by Country 2024 & 2032
- Figure 7: South America PBR Industry Revenue Share (%), by Country 2024 & 2032
- Figure 8: North America PBR Industry Revenue (Million), by Country 2024 & 2032
- Figure 9: North America PBR Industry Revenue Share (%), by Country 2024 & 2032
- Figure 10: MEA PBR Industry Revenue (Million), by Country 2024 & 2032
- Figure 11: MEA PBR Industry Revenue Share (%), by Country 2024 & 2032
- Figure 12: Asia Pacific PBR Industry Revenue (Million), by Application 2024 & 2032
- Figure 13: Asia Pacific PBR Industry Revenue Share (%), by Application 2024 & 2032
- Figure 14: Asia Pacific PBR Industry Revenue (Million), by Country 2024 & 2032
- Figure 15: Asia Pacific PBR Industry Revenue Share (%), by Country 2024 & 2032
- Figure 16: North America PBR Industry Revenue (Million), by Application 2024 & 2032
- Figure 17: North America PBR Industry Revenue Share (%), by Application 2024 & 2032
- Figure 18: North America PBR Industry Revenue (Million), by Country 2024 & 2032
- Figure 19: North America PBR Industry Revenue Share (%), by Country 2024 & 2032
- Figure 20: Europe PBR Industry Revenue (Million), by Application 2024 & 2032
- Figure 21: Europe PBR Industry Revenue Share (%), by Application 2024 & 2032
- Figure 22: Europe PBR Industry Revenue (Million), by Country 2024 & 2032
- Figure 23: Europe PBR Industry Revenue Share (%), by Country 2024 & 2032
- Figure 24: South America PBR Industry Revenue (Million), by Application 2024 & 2032
- Figure 25: South America PBR Industry Revenue Share (%), by Application 2024 & 2032
- Figure 26: South America PBR Industry Revenue (Million), by Country 2024 & 2032
- Figure 27: South America PBR Industry Revenue Share (%), by Country 2024 & 2032
- Figure 28: Middle East and Africa PBR Industry Revenue (Million), by Application 2024 & 2032
- Figure 29: Middle East and Africa PBR Industry Revenue Share (%), by Application 2024 & 2032
- Figure 30: Middle East and Africa PBR Industry Revenue (Million), by Country 2024 & 2032
- Figure 31: Middle East and Africa PBR Industry Revenue Share (%), by Country 2024 & 2032
List of Tables
- Table 1: Global PBR Industry Revenue Million Forecast, by Region 2019 & 2032
- Table 2: Global PBR Industry Revenue Million Forecast, by Application 2019 & 2032
- Table 3: Global PBR Industry Revenue Million Forecast, by Region 2019 & 2032
- Table 4: Global PBR Industry Revenue Million Forecast, by Country 2019 & 2032
- Table 5: Germany PBR Industry Revenue (Million) Forecast, by Application 2019 & 2032
- Table 6: United Kingdom PBR Industry Revenue (Million) Forecast, by Application 2019 & 2032
- Table 7: France PBR Industry Revenue (Million) Forecast, by Application 2019 & 2032
- Table 8: Spain PBR Industry Revenue (Million) Forecast, by Application 2019 & 2032
- Table 9: Italy PBR Industry Revenue (Million) Forecast, by Application 2019 & 2032
- Table 10: Spain PBR Industry Revenue (Million) Forecast, by Application 2019 & 2032
- Table 11: Belgium PBR Industry Revenue (Million) Forecast, by Application 2019 & 2032
- Table 12: Netherland PBR Industry Revenue (Million) Forecast, by Application 2019 & 2032
- Table 13: Nordics PBR Industry Revenue (Million) Forecast, by Application 2019 & 2032
- Table 14: Rest of Europe PBR Industry Revenue (Million) Forecast, by Application 2019 & 2032
- Table 15: Global PBR Industry Revenue Million Forecast, by Country 2019 & 2032
- Table 16: China PBR Industry Revenue (Million) Forecast, by Application 2019 & 2032
- Table 17: Japan PBR Industry Revenue (Million) Forecast, by Application 2019 & 2032
- Table 18: India PBR Industry Revenue (Million) Forecast, by Application 2019 & 2032
- Table 19: South Korea PBR Industry Revenue (Million) Forecast, by Application 2019 & 2032
- Table 20: Southeast Asia PBR Industry Revenue (Million) Forecast, by Application 2019 & 2032
- Table 21: Australia PBR Industry Revenue (Million) Forecast, by Application 2019 & 2032
- Table 22: Indonesia PBR Industry Revenue (Million) Forecast, by Application 2019 & 2032
- Table 23: Phillipes PBR Industry Revenue (Million) Forecast, by Application 2019 & 2032
- Table 24: Singapore PBR Industry Revenue (Million) Forecast, by Application 2019 & 2032
- Table 25: Thailandc PBR Industry Revenue (Million) Forecast, by Application 2019 & 2032
- Table 26: Rest of Asia Pacific PBR Industry Revenue (Million) Forecast, by Application 2019 & 2032
- Table 27: Global PBR Industry Revenue Million Forecast, by Country 2019 & 2032
- Table 28: Brazil PBR Industry Revenue (Million) Forecast, by Application 2019 & 2032
- Table 29: Argentina PBR Industry Revenue (Million) Forecast, by Application 2019 & 2032
- Table 30: Peru PBR Industry Revenue (Million) Forecast, by Application 2019 & 2032
- Table 31: Chile PBR Industry Revenue (Million) Forecast, by Application 2019 & 2032
- Table 32: Colombia PBR Industry Revenue (Million) Forecast, by Application 2019 & 2032
- Table 33: Ecuador PBR Industry Revenue (Million) Forecast, by Application 2019 & 2032
- Table 34: Venezuela PBR Industry Revenue (Million) Forecast, by Application 2019 & 2032
- Table 35: Rest of South America PBR Industry Revenue (Million) Forecast, by Application 2019 & 2032
- Table 36: Global PBR Industry Revenue Million Forecast, by Country 2019 & 2032
- Table 37: United States PBR Industry Revenue (Million) Forecast, by Application 2019 & 2032
- Table 38: Canada PBR Industry Revenue (Million) Forecast, by Application 2019 & 2032
- Table 39: Mexico PBR Industry Revenue (Million) Forecast, by Application 2019 & 2032
- Table 40: Global PBR Industry Revenue Million Forecast, by Country 2019 & 2032
- Table 41: United Arab Emirates PBR Industry Revenue (Million) Forecast, by Application 2019 & 2032
- Table 42: Saudi Arabia PBR Industry Revenue (Million) Forecast, by Application 2019 & 2032
- Table 43: South Africa PBR Industry Revenue (Million) Forecast, by Application 2019 & 2032
- Table 44: Rest of Middle East and Africa PBR Industry Revenue (Million) Forecast, by Application 2019 & 2032
- Table 45: Global PBR Industry Revenue Million Forecast, by Application 2019 & 2032
- Table 46: Global PBR Industry Revenue Million Forecast, by Country 2019 & 2032
- Table 47: China PBR Industry Revenue (Million) Forecast, by Application 2019 & 2032
- Table 48: India PBR Industry Revenue (Million) Forecast, by Application 2019 & 2032
- Table 49: Japan PBR Industry Revenue (Million) Forecast, by Application 2019 & 2032
- Table 50: South Korea PBR Industry Revenue (Million) Forecast, by Application 2019 & 2032
- Table 51: Indonesia PBR Industry Revenue (Million) Forecast, by Application 2019 & 2032
- Table 52: Malaysia PBR Industry Revenue (Million) Forecast, by Application 2019 & 2032
- Table 53: Thailand PBR Industry Revenue (Million) Forecast, by Application 2019 & 2032
- Table 54: Vietnam PBR Industry Revenue (Million) Forecast, by Application 2019 & 2032
- Table 55: Rest of Asia Pacific PBR Industry Revenue (Million) Forecast, by Application 2019 & 2032
- Table 56: Global PBR Industry Revenue Million Forecast, by Application 2019 & 2032
- Table 57: Global PBR Industry Revenue Million Forecast, by Country 2019 & 2032
- Table 58: United States PBR Industry Revenue (Million) Forecast, by Application 2019 & 2032
- Table 59: Canada PBR Industry Revenue (Million) Forecast, by Application 2019 & 2032
- Table 60: Mexico PBR Industry Revenue (Million) Forecast, by Application 2019 & 2032
- Table 61: Global PBR Industry Revenue Million Forecast, by Application 2019 & 2032
- Table 62: Global PBR Industry Revenue Million Forecast, by Country 2019 & 2032
- Table 63: Germany PBR Industry Revenue (Million) Forecast, by Application 2019 & 2032
- Table 64: United Kingdom PBR Industry Revenue (Million) Forecast, by Application 2019 & 2032
- Table 65: Italy PBR Industry Revenue (Million) Forecast, by Application 2019 & 2032
- Table 66: France PBR Industry Revenue (Million) Forecast, by Application 2019 & 2032
- Table 67: Spain PBR Industry Revenue (Million) Forecast, by Application 2019 & 2032
- Table 68: Russia PBR Industry Revenue (Million) Forecast, by Application 2019 & 2032
- Table 69: NORDIC Countries PBR Industry Revenue (Million) Forecast, by Application 2019 & 2032
- Table 70: Turkey PBR Industry Revenue (Million) Forecast, by Application 2019 & 2032
- Table 71: Rest of Europe PBR Industry Revenue (Million) Forecast, by Application 2019 & 2032
- Table 72: Global PBR Industry Revenue Million Forecast, by Application 2019 & 2032
- Table 73: Global PBR Industry Revenue Million Forecast, by Country 2019 & 2032
- Table 74: Brazil PBR Industry Revenue (Million) Forecast, by Application 2019 & 2032
- Table 75: Argentina PBR Industry Revenue (Million) Forecast, by Application 2019 & 2032
- Table 76: Colombia PBR Industry Revenue (Million) Forecast, by Application 2019 & 2032
- Table 77: Rest of South America PBR Industry Revenue (Million) Forecast, by Application 2019 & 2032
- Table 78: Global PBR Industry Revenue Million Forecast, by Application 2019 & 2032
- Table 79: Global PBR Industry Revenue Million Forecast, by Country 2019 & 2032
- Table 80: Saudi Arabia PBR Industry Revenue (Million) Forecast, by Application 2019 & 2032
- Table 81: South Africa PBR Industry Revenue (Million) Forecast, by Application 2019 & 2032
- Table 82: Qatar PBR Industry Revenue (Million) Forecast, by Application 2019 & 2032
- Table 83: UAE PBR Industry Revenue (Million) Forecast, by Application 2019 & 2032
- Table 84: Nigeria PBR Industry Revenue (Million) Forecast, by Application 2019 & 2032
- Table 85: Egypt PBR Industry Revenue (Million) Forecast, by Application 2019 & 2032
- Table 86: Rest of Middle East and Africa PBR Industry Revenue (Million) Forecast, by Application 2019 & 2032
Frequently Asked Questions
1. What is the projected Compound Annual Growth Rate (CAGR) of the PBR Industry?
The projected CAGR is approximately 3.95%.
2. Which companies are prominent players in the PBR Industry?
Key companies in the market include ARLANXEO, Synthos, UBE Corporation, KURARAY CO LTD, THE YOKOHAMA RUBBER CO LTD, ENEOS Materials Corporation, Reliance Industries Limited, ZEON CORPORATION, KUMHO PETROCHEMICAL, LANXESS, SABIC, Trinseo, LG Chem, Versalis S p A *List Not Exhaustive, Indian Oil Corporation Ltd, SIBUR International GmbH.
3. What are the main segments of the PBR Industry?
The market segments include Application.
4. Can you provide details about the market size?
The market size is estimated to be USD 7.71 Million as of 2022.
5. What are some drivers contributing to market growth?
Increasing Demand From the Automobile Industry; Growth in the Synthetic Rubber Industry; Other Drivers.
6. What are the notable trends driving market growth?
Tire Manufacturing Application Segment to Dominate The Market.
7. Are there any restraints impacting market growth?
Stringent Enviornmental Regulations; Health Concerns Regarding Exposure to Polybutadiene.
8. Can you provide examples of recent developments in the market?
February 2023:Arlanxeo revealed the commencement of a 65 ktpa polybutadiene rubber production plant in southern Brazil. This new facility, situated in the Triunfo petrochemical complex in Rio Grande do Sul, underlines the company's dedication to strengthening its presence in Latin America.
9. What pricing options are available for accessing the report?
Pricing options include single-user, multi-user, and enterprise licenses priced at USD 4750, USD 5250, and USD 8750 respectively.
10. Is the market size provided in terms of value or volume?
The market size is provided in terms of value, measured in Million.
11. Are there any specific market keywords associated with the report?
Yes, the market keyword associated with the report is "PBR Industry," which aids in identifying and referencing the specific market segment covered.
12. How do I determine which pricing option suits my needs best?
The pricing options vary based on user requirements and access needs. Individual users may opt for single-user licenses, while businesses requiring broader access may choose multi-user or enterprise licenses for cost-effective access to the report.
13. Are there any additional resources or data provided in the PBR Industry report?
While the report offers comprehensive insights, it's advisable to review the specific contents or supplementary materials provided to ascertain if additional resources or data are available.
14. How can I stay updated on further developments or reports in the PBR Industry?
To stay informed about further developments, trends, and reports in the PBR Industry, consider subscribing to industry newsletters, following relevant companies and organizations, or regularly checking reputable industry news sources and publications.
Methodology
Step 1 - Identification of Relevant Samples Size from Population Database


Step 2 - Approaches for Defining Global Market Size (Value, Volume* & Price*)

Note*: In applicable scenarios
Step 3 - Data Sources
Primary Research
- Web Analytics
- Survey Reports
- Research Institute
- Latest Research Reports
- Opinion Leaders
Secondary Research
- Annual Reports
- White Paper
- Latest Press Release
- Industry Association
- Paid Database
- Investor Presentations

Step 4 - Data Triangulation
Involves using different sources of information in order to increase the validity of a study
These sources are likely to be stakeholders in a program - participants, other researchers, program staff, other community members, and so on.
Then we put all data in single framework & apply various statistical tools to find out the dynamic on the market.
During the analysis stage, feedback from the stakeholder groups would be compared to determine areas of agreement as well as areas of divergence


