Key Insights
The global Paper Carrier Tape for Electronic Components market is experiencing significant expansion, propelled by the escalating demand for compact and advanced electronic devices. The widespread adoption of Surface Mount Technology (SMT) across diverse sectors such as consumer electronics, automotive, and healthcare is a primary growth driver. Paper carrier tape's inherent advantages, including its cost-efficiency, superior environmental profile compared to plastic alternatives, and optimal performance in high-speed automated assembly, are significantly contributing to its market adoption. The market is projected to reach $3.5 billion by 2024, with a Compound Annual Growth Rate (CAGR) of 6.1% from 2024 to 2033. This growth is further supported by ongoing innovations in tape materials and manufacturing, leading to enhanced dimensional stability and reduced dust generation. Key challenges include fluctuating raw material costs and competition from alternative packaging solutions.
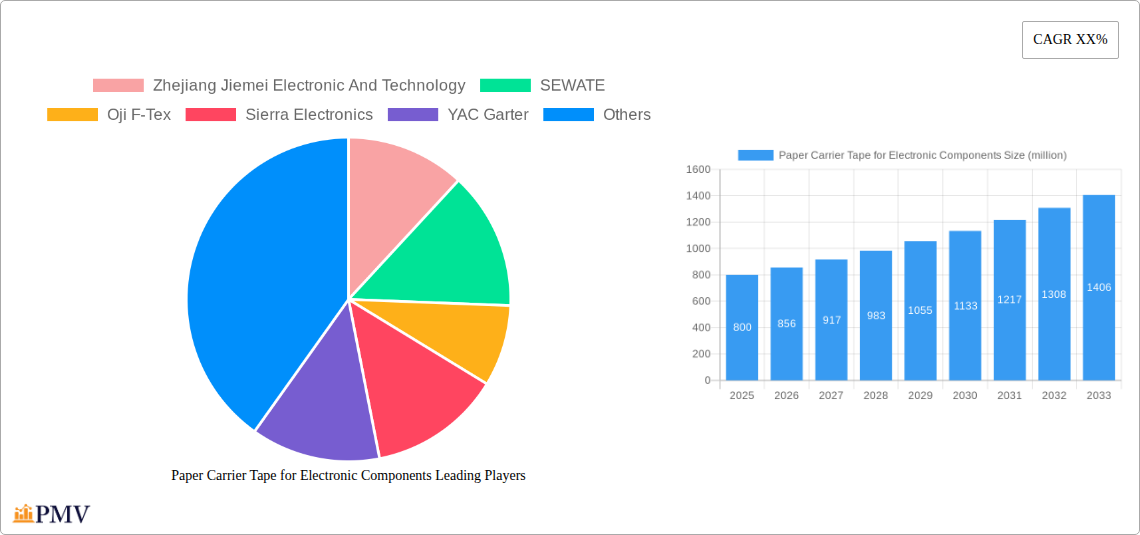
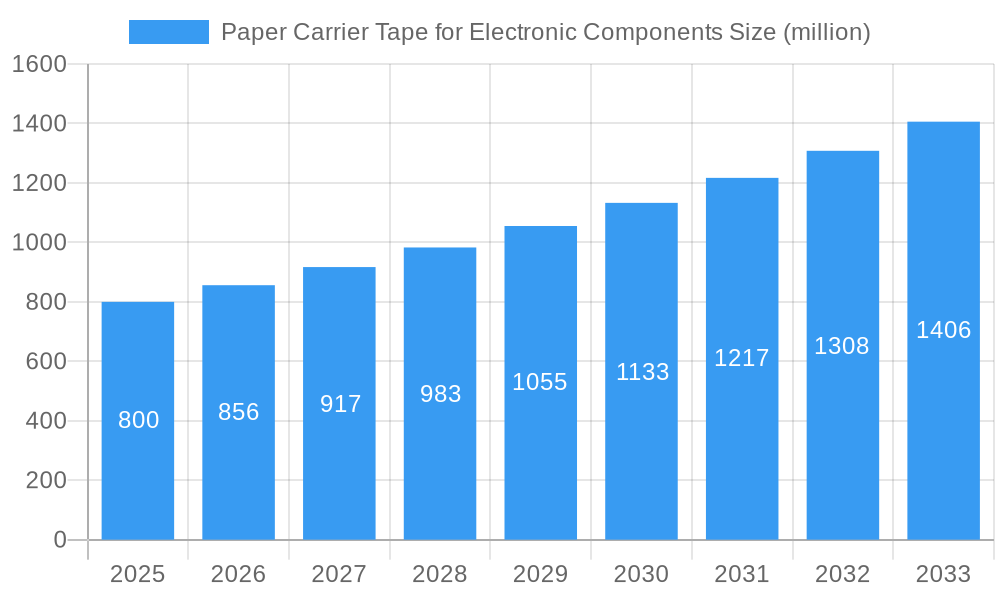
Paper Carrier Tape for Electronic Components Market Size (In Billion)
The market is segmented by tape type (standard, anti-static, conductive), application (integrated circuits, resistors, capacitors), and region. Major market participants include Zhejiang Jiemei Electronic And Technology, SEWATE, Oji F-Tex, Sierra Electronics, YAC Garter, Lasertek, Daio Paper, Hansol Korea, and Mavat, who are primarily competing on price, quality, and technological innovation.
Paper Carrier Tape for Electronic Components Company Market Share
The forecast period (2024-2033) offers substantial opportunities for market growth, particularly in emerging economies characterized by rapid industrialization and expanding electronics manufacturing capabilities. Strategic alliances and collaborations between manufacturers and component suppliers are expected to foster technological advancements and market consolidation. A growing emphasis on sustainability is driving the development of eco-friendly paper carrier tape options utilizing recycled materials. Despite potential risks from economic volatility and geopolitical uncertainties, the paper carrier tape market's outlook remains positive, underpinned by the continuous expansion of the electronics industry and the intrinsic benefits of this packaging solution.
Paper Carrier Tape for Electronic Components Market Report: 2019-2033
This comprehensive report provides a detailed analysis of the global Paper Carrier Tape for Electronic Components market, offering invaluable insights for stakeholders across the industry value chain. The study covers the period 2019-2033, with 2025 as the base year and estimated year, and a forecast period spanning 2025-2033. The historical period analyzed is 2019-2024. Millions of units are used for all values. This report is crucial for understanding market dynamics, identifying growth opportunities, and navigating the competitive landscape.
Paper Carrier Tape for Electronic Components Market Structure & Competitive Dynamics
The global paper carrier tape for electronic components market exhibits a moderately concentrated structure, with a few major players holding significant market share. Zhejiang Jiemei Electronic And Technology, SEWATE, Oji F-Tex, and Daio Paper collectively account for approximately xx million units of market share in 2025. Innovation ecosystems are largely driven by advancements in materials science and automation technologies, focused on enhancing tape performance, efficiency, and compatibility with automated assembly processes. Regulatory frameworks, particularly concerning environmental sustainability and material safety, influence product development and manufacturing processes. The market witnesses limited product substitution, primarily from alternative carrier materials like plastic reels, which, however, face growing pressure due to environmental concerns. End-user trends indicate a strong preference for high-precision, high-throughput tapes catering to the increasing demand for miniaturization and automation in electronics manufacturing.
M&A activities within the industry have been relatively modest in recent years, with the total value of deals estimated at xx million USD in the period 2019-2024. However, increased consolidation is anticipated as companies strive to expand their market reach and technological capabilities.
- Market Concentration: Moderately Concentrated
- Key Players Market Share (2025): Zhejiang Jiemei Electronic And Technology (xx%), SEWATE (xx%), Oji F-Tex (xx%), Daio Paper (xx%), Others (xx%)
- M&A Deal Value (2019-2024): xx million USD
Paper Carrier Tape for Electronic Components Industry Trends & Insights
The paper carrier tape for electronic components market is experiencing robust growth, driven by the booming electronics industry and the increasing demand for automated assembly processes. The market is expected to witness a CAGR of xx% during the forecast period (2025-2033), reaching a market size of xx million units by 2033. Technological disruptions, including the development of novel adhesive materials and improved dispensing technologies, are enhancing tape performance and efficiency. Consumer preferences are shifting towards eco-friendly and sustainable options, leading to increased demand for tapes made from recycled or biodegradable materials. Competitive dynamics are shaping the market with companies focused on innovation, cost optimization, and strategic partnerships to gain a competitive edge. Market penetration of automated assembly lines in electronics manufacturing is a key driver, pushing demand for specialized carrier tapes.
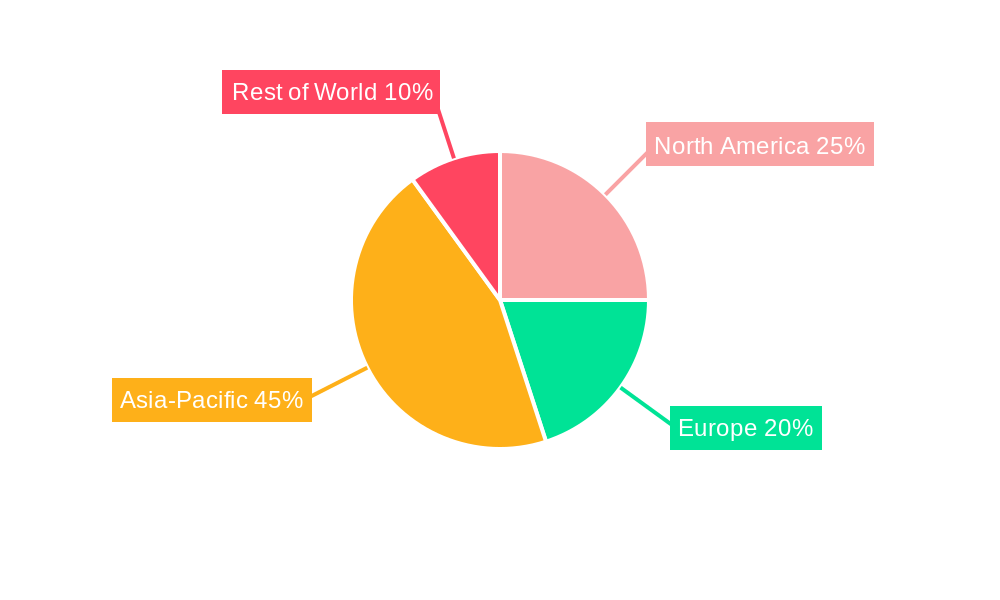
Dominant Markets & Segments in Paper Carrier Tape for Electronic Components
The Asia-Pacific region, particularly China, Japan, and South Korea, dominates the paper carrier tape for electronic components market, accounting for approximately xx million units of global demand in 2025. This dominance is attributed to:
- High Concentration of Electronics Manufacturing: The region houses a large number of electronics manufacturing facilities.
- Favorable Economic Policies: Government initiatives promoting technological advancements and infrastructure development.
- Robust Supply Chain Infrastructure: Well-established supply chains supporting the electronics industry.
- Growing Domestic Demand: Increasing domestic consumption of electronic devices fuels demand for components and related materials.
North America and Europe also represent significant markets, though with lower market shares compared to Asia-Pacific. The market is further segmented by tape type (e.g., standard, high-precision, anti-static), material (e.g., paper, paper-plastic composite), and application (e.g., surface mount technology (SMT), through-hole technology (THT)).
Paper Carrier Tape for Electronic Components Product Innovations
Recent innovations in paper carrier tape focus on enhancing precision, reducing waste, and improving compatibility with high-speed assembly equipment. This includes developing advanced adhesive formulations, employing specialized coatings for improved static control and moisture resistance, and incorporating functionalities like integrated RFID tags for improved traceability. These innovations are tailored to meet the evolving needs of the electronics industry, driving adoption and market growth. The development of biodegradable and recyclable paper tapes aligns with growing environmental concerns and regulatory pressures.
Report Segmentation & Scope
This report segments the paper carrier tape for electronic components market based on several factors:
- By Tape Type: Standard, High-Precision, Anti-static, others. Growth projections vary depending on application needs and technological advancements. High-precision tapes are expected to see faster growth.
- By Material: Paper, Paper-Plastic Composite, others. Environmental concerns are driving interest in recyclable paper-based solutions.
- By Application: SMT, THT, others. The SMT segment is experiencing higher growth due to the increasing adoption of surface mount technology in electronics manufacturing.
- By Region: North America, Europe, Asia-Pacific, Rest of the World. Asia-Pacific holds the largest market share.
Key Drivers of Paper Carrier Tape for Electronic Components Growth
The growth of the paper carrier tape market is primarily driven by the expansion of the electronics industry, the increasing demand for automated assembly in electronics manufacturing, and the development of advanced electronic components that require precise and efficient handling. The rising adoption of surface mount technology (SMT) directly fuels demand for specialized carrier tapes. Government initiatives promoting technological advancements in electronics manufacturing further accelerate market growth. Stringent environmental regulations are driving the adoption of eco-friendly materials in tape manufacturing.
Challenges in the Paper Carrier Tape for Electronic Components Sector
The paper carrier tape market faces challenges stemming from fluctuating raw material prices, supply chain disruptions, and intense competition among manufacturers. Environmental regulations concerning material sourcing and waste management represent significant operational challenges. Technological advancements necessitate continuous innovation and investment in R&D to maintain competitiveness. Price sensitivity in certain market segments can also impact profit margins. These factors collectively contribute to the complexities faced by industry players.
Leading Players in the Paper Carrier Tape for Electronic Components Market
- Zhejiang Jiemei Electronic And Technology
- SEWATE
- Oji F-Tex
- Sierra Electronics
- YAC Garter
- Lasertek
- Daio Paper
- Hansol Korea
- Mavat
Key Developments in Paper Carrier Tape for Electronic Components Sector
- 2022 Q4: Launch of a new high-precision paper carrier tape with improved adhesive strength by Zhejiang Jiemei Electronic And Technology.
- 2023 Q1: SEWATE announced a strategic partnership to expand its distribution network in North America.
- 2023 Q3: Daio Paper unveiled a new line of eco-friendly paper carrier tapes made from recycled materials.
- 2024 Q2: Oji F-Tex acquired a smaller competitor, expanding its market share.
Strategic Paper Carrier Tape for Electronic Components Market Outlook
The future of the paper carrier tape for electronic components market is promising, with sustained growth projected driven by continuous innovation, the expansion of the electronics industry, and increasing automation in manufacturing. Strategic opportunities lie in developing specialized tapes for emerging applications, investing in sustainable materials, and leveraging technological advancements to enhance performance and efficiency. Companies focusing on sustainability and providing customized solutions will be well-positioned to capitalize on future market opportunities.
Paper Carrier Tape for Electronic Components Segmentation
-
1. Application
- 1.1. Capacitor
- 1.2. Resistor
- 1.3. Inductors
- 1.4. Other
-
2. Types
- 2.1. Slitting Paper Carrier Tape
- 2.2. Punched Paper Carrier Tape
- 2.3. Embossed Paper Carrier Tape
Paper Carrier Tape for Electronic Components Segmentation By Geography
-
1. North America
- 1.1. United States
- 1.2. Canada
- 1.3. Mexico
-
2. South America
- 2.1. Brazil
- 2.2. Argentina
- 2.3. Rest of South America
-
3. Europe
- 3.1. United Kingdom
- 3.2. Germany
- 3.3. France
- 3.4. Italy
- 3.5. Spain
- 3.6. Russia
- 3.7. Benelux
- 3.8. Nordics
- 3.9. Rest of Europe
-
4. Middle East & Africa
- 4.1. Turkey
- 4.2. Israel
- 4.3. GCC
- 4.4. North Africa
- 4.5. South Africa
- 4.6. Rest of Middle East & Africa
-
5. Asia Pacific
- 5.1. China
- 5.2. India
- 5.3. Japan
- 5.4. South Korea
- 5.5. ASEAN
- 5.6. Oceania
- 5.7. Rest of Asia Pacific
Paper Carrier Tape for Electronic Components Regional Market Share
Geographic Coverage of Paper Carrier Tape for Electronic Components
Paper Carrier Tape for Electronic Components REPORT HIGHLIGHTS
| Aspects | Details |
|---|---|
| Study Period | 2020-2034 |
| Base Year | 2025 |
| Estimated Year | 2026 |
| Forecast Period | 2026-2034 |
| Historical Period | 2020-2025 |
| Growth Rate | CAGR of 6.1% from 2020-2034 |
| Segmentation |
|
Table of Contents
- 1. Introduction
- 1.1. Research Scope
- 1.2. Market Segmentation
- 1.3. Research Objective
- 1.4. Definitions and Assumptions
- 2. Executive Summary
- 2.1. Market Snapshot
- 3. Market Dynamics
- 3.1. Market Drivers
- 3.2. Market Restrains
- 3.3. Market Trends
- 3.4. Market Opportunities
- 4. Market Factor Analysis
- 4.1. Porters Five Forces
- 4.1.1. Bargaining Power of Suppliers
- 4.1.2. Bargaining Power of Buyers
- 4.1.3. Threat of New Entrants
- 4.1.4. Threat of Substitutes
- 4.1.5. Competitive Rivalry
- 4.2. PESTEL analysis
- 4.3. BCG Analysis
- 4.3.1. Stars (High Growth, High Market Share)
- 4.3.2. Cash Cows (Low Growth, High Market Share)
- 4.3.3. Question Mark (High Growth, Low Market Share)
- 4.3.4. Dogs (Low Growth, Low Market Share)
- 4.4. Ansoff Matrix Analysis
- 4.5. Supply Chain Analysis
- 4.6. Regulatory Landscape
- 4.7. Current Market Potential and Opportunity Assessment (TAM–SAM–SOM Framework)
- 4.8. PMV Analyst Note
- 4.1. Porters Five Forces
- 5. Market Analysis, Insights and Forecast 2021-2033
- 5.1. Market Analysis, Insights and Forecast - by Application
- 5.1.1. Capacitor
- 5.1.2. Resistor
- 5.1.3. Inductors
- 5.1.4. Other
- 5.2. Market Analysis, Insights and Forecast - by Types
- 5.2.1. Slitting Paper Carrier Tape
- 5.2.2. Punched Paper Carrier Tape
- 5.2.3. Embossed Paper Carrier Tape
- 5.3. Market Analysis, Insights and Forecast - by Region
- 5.3.1. North America
- 5.3.2. South America
- 5.3.3. Europe
- 5.3.4. Middle East & Africa
- 5.3.5. Asia Pacific
- 5.1. Market Analysis, Insights and Forecast - by Application
- 6. Global Paper Carrier Tape for Electronic Components Analysis, Insights and Forecast, 2021-2033
- 6.1. Market Analysis, Insights and Forecast - by Application
- 6.1.1. Capacitor
- 6.1.2. Resistor
- 6.1.3. Inductors
- 6.1.4. Other
- 6.2. Market Analysis, Insights and Forecast - by Types
- 6.2.1. Slitting Paper Carrier Tape
- 6.2.2. Punched Paper Carrier Tape
- 6.2.3. Embossed Paper Carrier Tape
- 6.1. Market Analysis, Insights and Forecast - by Application
- 7. North America Paper Carrier Tape for Electronic Components Analysis, Insights and Forecast, 2020-2032
- 7.1. Market Analysis, Insights and Forecast - by Application
- 7.1.1. Capacitor
- 7.1.2. Resistor
- 7.1.3. Inductors
- 7.1.4. Other
- 7.2. Market Analysis, Insights and Forecast - by Types
- 7.2.1. Slitting Paper Carrier Tape
- 7.2.2. Punched Paper Carrier Tape
- 7.2.3. Embossed Paper Carrier Tape
- 7.1. Market Analysis, Insights and Forecast - by Application
- 8. South America Paper Carrier Tape for Electronic Components Analysis, Insights and Forecast, 2020-2032
- 8.1. Market Analysis, Insights and Forecast - by Application
- 8.1.1. Capacitor
- 8.1.2. Resistor
- 8.1.3. Inductors
- 8.1.4. Other
- 8.2. Market Analysis, Insights and Forecast - by Types
- 8.2.1. Slitting Paper Carrier Tape
- 8.2.2. Punched Paper Carrier Tape
- 8.2.3. Embossed Paper Carrier Tape
- 8.1. Market Analysis, Insights and Forecast - by Application
- 9. Europe Paper Carrier Tape for Electronic Components Analysis, Insights and Forecast, 2020-2032
- 9.1. Market Analysis, Insights and Forecast - by Application
- 9.1.1. Capacitor
- 9.1.2. Resistor
- 9.1.3. Inductors
- 9.1.4. Other
- 9.2. Market Analysis, Insights and Forecast - by Types
- 9.2.1. Slitting Paper Carrier Tape
- 9.2.2. Punched Paper Carrier Tape
- 9.2.3. Embossed Paper Carrier Tape
- 9.1. Market Analysis, Insights and Forecast - by Application
- 10. Middle East & Africa Paper Carrier Tape for Electronic Components Analysis, Insights and Forecast, 2020-2032
- 10.1. Market Analysis, Insights and Forecast - by Application
- 10.1.1. Capacitor
- 10.1.2. Resistor
- 10.1.3. Inductors
- 10.1.4. Other
- 10.2. Market Analysis, Insights and Forecast - by Types
- 10.2.1. Slitting Paper Carrier Tape
- 10.2.2. Punched Paper Carrier Tape
- 10.2.3. Embossed Paper Carrier Tape
- 10.1. Market Analysis, Insights and Forecast - by Application
- 11. Asia Pacific Paper Carrier Tape for Electronic Components Analysis, Insights and Forecast, 2020-2032
- 11.1. Market Analysis, Insights and Forecast - by Application
- 11.1.1. Capacitor
- 11.1.2. Resistor
- 11.1.3. Inductors
- 11.1.4. Other
- 11.2. Market Analysis, Insights and Forecast - by Types
- 11.2.1. Slitting Paper Carrier Tape
- 11.2.2. Punched Paper Carrier Tape
- 11.2.3. Embossed Paper Carrier Tape
- 11.1. Market Analysis, Insights and Forecast - by Application
- 12. Competitive Analysis
- 12.1. Company Profiles
- 12.1.1 Zhejiang Jiemei Electronic And Technology
- 12.1.1.1. Company Overview
- 12.1.1.2. Products
- 12.1.1.3. Company Financials
- 12.1.1.4. SWOT Analysis
- 12.1.2 SEWATE
- 12.1.2.1. Company Overview
- 12.1.2.2. Products
- 12.1.2.3. Company Financials
- 12.1.2.4. SWOT Analysis
- 12.1.3 Oji F-Tex
- 12.1.3.1. Company Overview
- 12.1.3.2. Products
- 12.1.3.3. Company Financials
- 12.1.3.4. SWOT Analysis
- 12.1.4 Sierra Electronics
- 12.1.4.1. Company Overview
- 12.1.4.2. Products
- 12.1.4.3. Company Financials
- 12.1.4.4. SWOT Analysis
- 12.1.5 YAC Garter
- 12.1.5.1. Company Overview
- 12.1.5.2. Products
- 12.1.5.3. Company Financials
- 12.1.5.4. SWOT Analysis
- 12.1.6 Lasertek
- 12.1.6.1. Company Overview
- 12.1.6.2. Products
- 12.1.6.3. Company Financials
- 12.1.6.4. SWOT Analysis
- 12.1.7 Daio Paper
- 12.1.7.1. Company Overview
- 12.1.7.2. Products
- 12.1.7.3. Company Financials
- 12.1.7.4. SWOT Analysis
- 12.1.8 Hansol Korea
- 12.1.8.1. Company Overview
- 12.1.8.2. Products
- 12.1.8.3. Company Financials
- 12.1.8.4. SWOT Analysis
- 12.1.9 Mavat
- 12.1.9.1. Company Overview
- 12.1.9.2. Products
- 12.1.9.3. Company Financials
- 12.1.9.4. SWOT Analysis
- 12.1.1 Zhejiang Jiemei Electronic And Technology
- 12.2. Market Entropy
- 12.2.1 Company's Key Areas Served
- 12.2.2 Recent Developments
- 12.3. Company Market Share Analysis 2025
- 12.3.1 Top 5 Companies Market Share Analysis
- 12.3.2 Top 3 Companies Market Share Analysis
- 12.4. List of Potential Customers
- 13. Research Methodology
List of Figures
- Figure 1: Global Paper Carrier Tape for Electronic Components Revenue Breakdown (billion, %) by Region 2025 & 2033
- Figure 2: North America Paper Carrier Tape for Electronic Components Revenue (billion), by Application 2025 & 2033
- Figure 3: North America Paper Carrier Tape for Electronic Components Revenue Share (%), by Application 2025 & 2033
- Figure 4: North America Paper Carrier Tape for Electronic Components Revenue (billion), by Types 2025 & 2033
- Figure 5: North America Paper Carrier Tape for Electronic Components Revenue Share (%), by Types 2025 & 2033
- Figure 6: North America Paper Carrier Tape for Electronic Components Revenue (billion), by Country 2025 & 2033
- Figure 7: North America Paper Carrier Tape for Electronic Components Revenue Share (%), by Country 2025 & 2033
- Figure 8: South America Paper Carrier Tape for Electronic Components Revenue (billion), by Application 2025 & 2033
- Figure 9: South America Paper Carrier Tape for Electronic Components Revenue Share (%), by Application 2025 & 2033
- Figure 10: South America Paper Carrier Tape for Electronic Components Revenue (billion), by Types 2025 & 2033
- Figure 11: South America Paper Carrier Tape for Electronic Components Revenue Share (%), by Types 2025 & 2033
- Figure 12: South America Paper Carrier Tape for Electronic Components Revenue (billion), by Country 2025 & 2033
- Figure 13: South America Paper Carrier Tape for Electronic Components Revenue Share (%), by Country 2025 & 2033
- Figure 14: Europe Paper Carrier Tape for Electronic Components Revenue (billion), by Application 2025 & 2033
- Figure 15: Europe Paper Carrier Tape for Electronic Components Revenue Share (%), by Application 2025 & 2033
- Figure 16: Europe Paper Carrier Tape for Electronic Components Revenue (billion), by Types 2025 & 2033
- Figure 17: Europe Paper Carrier Tape for Electronic Components Revenue Share (%), by Types 2025 & 2033
- Figure 18: Europe Paper Carrier Tape for Electronic Components Revenue (billion), by Country 2025 & 2033
- Figure 19: Europe Paper Carrier Tape for Electronic Components Revenue Share (%), by Country 2025 & 2033
- Figure 20: Middle East & Africa Paper Carrier Tape for Electronic Components Revenue (billion), by Application 2025 & 2033
- Figure 21: Middle East & Africa Paper Carrier Tape for Electronic Components Revenue Share (%), by Application 2025 & 2033
- Figure 22: Middle East & Africa Paper Carrier Tape for Electronic Components Revenue (billion), by Types 2025 & 2033
- Figure 23: Middle East & Africa Paper Carrier Tape for Electronic Components Revenue Share (%), by Types 2025 & 2033
- Figure 24: Middle East & Africa Paper Carrier Tape for Electronic Components Revenue (billion), by Country 2025 & 2033
- Figure 25: Middle East & Africa Paper Carrier Tape for Electronic Components Revenue Share (%), by Country 2025 & 2033
- Figure 26: Asia Pacific Paper Carrier Tape for Electronic Components Revenue (billion), by Application 2025 & 2033
- Figure 27: Asia Pacific Paper Carrier Tape for Electronic Components Revenue Share (%), by Application 2025 & 2033
- Figure 28: Asia Pacific Paper Carrier Tape for Electronic Components Revenue (billion), by Types 2025 & 2033
- Figure 29: Asia Pacific Paper Carrier Tape for Electronic Components Revenue Share (%), by Types 2025 & 2033
- Figure 30: Asia Pacific Paper Carrier Tape for Electronic Components Revenue (billion), by Country 2025 & 2033
- Figure 31: Asia Pacific Paper Carrier Tape for Electronic Components Revenue Share (%), by Country 2025 & 2033
List of Tables
- Table 1: Global Paper Carrier Tape for Electronic Components Revenue billion Forecast, by Application 2020 & 2033
- Table 2: Global Paper Carrier Tape for Electronic Components Revenue billion Forecast, by Types 2020 & 2033
- Table 3: Global Paper Carrier Tape for Electronic Components Revenue billion Forecast, by Region 2020 & 2033
- Table 4: Global Paper Carrier Tape for Electronic Components Revenue billion Forecast, by Application 2020 & 2033
- Table 5: Global Paper Carrier Tape for Electronic Components Revenue billion Forecast, by Types 2020 & 2033
- Table 6: Global Paper Carrier Tape for Electronic Components Revenue billion Forecast, by Country 2020 & 2033
- Table 7: United States Paper Carrier Tape for Electronic Components Revenue (billion) Forecast, by Application 2020 & 2033
- Table 8: Canada Paper Carrier Tape for Electronic Components Revenue (billion) Forecast, by Application 2020 & 2033
- Table 9: Mexico Paper Carrier Tape for Electronic Components Revenue (billion) Forecast, by Application 2020 & 2033
- Table 10: Global Paper Carrier Tape for Electronic Components Revenue billion Forecast, by Application 2020 & 2033
- Table 11: Global Paper Carrier Tape for Electronic Components Revenue billion Forecast, by Types 2020 & 2033
- Table 12: Global Paper Carrier Tape for Electronic Components Revenue billion Forecast, by Country 2020 & 2033
- Table 13: Brazil Paper Carrier Tape for Electronic Components Revenue (billion) Forecast, by Application 2020 & 2033
- Table 14: Argentina Paper Carrier Tape for Electronic Components Revenue (billion) Forecast, by Application 2020 & 2033
- Table 15: Rest of South America Paper Carrier Tape for Electronic Components Revenue (billion) Forecast, by Application 2020 & 2033
- Table 16: Global Paper Carrier Tape for Electronic Components Revenue billion Forecast, by Application 2020 & 2033
- Table 17: Global Paper Carrier Tape for Electronic Components Revenue billion Forecast, by Types 2020 & 2033
- Table 18: Global Paper Carrier Tape for Electronic Components Revenue billion Forecast, by Country 2020 & 2033
- Table 19: United Kingdom Paper Carrier Tape for Electronic Components Revenue (billion) Forecast, by Application 2020 & 2033
- Table 20: Germany Paper Carrier Tape for Electronic Components Revenue (billion) Forecast, by Application 2020 & 2033
- Table 21: France Paper Carrier Tape for Electronic Components Revenue (billion) Forecast, by Application 2020 & 2033
- Table 22: Italy Paper Carrier Tape for Electronic Components Revenue (billion) Forecast, by Application 2020 & 2033
- Table 23: Spain Paper Carrier Tape for Electronic Components Revenue (billion) Forecast, by Application 2020 & 2033
- Table 24: Russia Paper Carrier Tape for Electronic Components Revenue (billion) Forecast, by Application 2020 & 2033
- Table 25: Benelux Paper Carrier Tape for Electronic Components Revenue (billion) Forecast, by Application 2020 & 2033
- Table 26: Nordics Paper Carrier Tape for Electronic Components Revenue (billion) Forecast, by Application 2020 & 2033
- Table 27: Rest of Europe Paper Carrier Tape for Electronic Components Revenue (billion) Forecast, by Application 2020 & 2033
- Table 28: Global Paper Carrier Tape for Electronic Components Revenue billion Forecast, by Application 2020 & 2033
- Table 29: Global Paper Carrier Tape for Electronic Components Revenue billion Forecast, by Types 2020 & 2033
- Table 30: Global Paper Carrier Tape for Electronic Components Revenue billion Forecast, by Country 2020 & 2033
- Table 31: Turkey Paper Carrier Tape for Electronic Components Revenue (billion) Forecast, by Application 2020 & 2033
- Table 32: Israel Paper Carrier Tape for Electronic Components Revenue (billion) Forecast, by Application 2020 & 2033
- Table 33: GCC Paper Carrier Tape for Electronic Components Revenue (billion) Forecast, by Application 2020 & 2033
- Table 34: North Africa Paper Carrier Tape for Electronic Components Revenue (billion) Forecast, by Application 2020 & 2033
- Table 35: South Africa Paper Carrier Tape for Electronic Components Revenue (billion) Forecast, by Application 2020 & 2033
- Table 36: Rest of Middle East & Africa Paper Carrier Tape for Electronic Components Revenue (billion) Forecast, by Application 2020 & 2033
- Table 37: Global Paper Carrier Tape for Electronic Components Revenue billion Forecast, by Application 2020 & 2033
- Table 38: Global Paper Carrier Tape for Electronic Components Revenue billion Forecast, by Types 2020 & 2033
- Table 39: Global Paper Carrier Tape for Electronic Components Revenue billion Forecast, by Country 2020 & 2033
- Table 40: China Paper Carrier Tape for Electronic Components Revenue (billion) Forecast, by Application 2020 & 2033
- Table 41: India Paper Carrier Tape for Electronic Components Revenue (billion) Forecast, by Application 2020 & 2033
- Table 42: Japan Paper Carrier Tape for Electronic Components Revenue (billion) Forecast, by Application 2020 & 2033
- Table 43: South Korea Paper Carrier Tape for Electronic Components Revenue (billion) Forecast, by Application 2020 & 2033
- Table 44: ASEAN Paper Carrier Tape for Electronic Components Revenue (billion) Forecast, by Application 2020 & 2033
- Table 45: Oceania Paper Carrier Tape for Electronic Components Revenue (billion) Forecast, by Application 2020 & 2033
- Table 46: Rest of Asia Pacific Paper Carrier Tape for Electronic Components Revenue (billion) Forecast, by Application 2020 & 2033
Frequently Asked Questions
1. What is the projected Compound Annual Growth Rate (CAGR) of the Paper Carrier Tape for Electronic Components?
The projected CAGR is approximately 6.1%.
2. Which companies are prominent players in the Paper Carrier Tape for Electronic Components?
Key companies in the market include Zhejiang Jiemei Electronic And Technology, SEWATE, Oji F-Tex, Sierra Electronics, YAC Garter, Lasertek, Daio Paper, Hansol Korea, Mavat.
3. What are the main segments of the Paper Carrier Tape for Electronic Components?
The market segments include Application, Types.
4. Can you provide details about the market size?
The market size is estimated to be USD 3.5 billion as of 2022.
5. What are some drivers contributing to market growth?
N/A
6. What are the notable trends driving market growth?
N/A
7. Are there any restraints impacting market growth?
N/A
8. Can you provide examples of recent developments in the market?
N/A
9. What pricing options are available for accessing the report?
Pricing options include single-user, multi-user, and enterprise licenses priced at USD 2900.00, USD 4350.00, and USD 5800.00 respectively.
10. Is the market size provided in terms of value or volume?
The market size is provided in terms of value, measured in billion.
11. Are there any specific market keywords associated with the report?
Yes, the market keyword associated with the report is "Paper Carrier Tape for Electronic Components," which aids in identifying and referencing the specific market segment covered.
12. How do I determine which pricing option suits my needs best?
The pricing options vary based on user requirements and access needs. Individual users may opt for single-user licenses, while businesses requiring broader access may choose multi-user or enterprise licenses for cost-effective access to the report.
13. Are there any additional resources or data provided in the Paper Carrier Tape for Electronic Components report?
While the report offers comprehensive insights, it's advisable to review the specific contents or supplementary materials provided to ascertain if additional resources or data are available.
14. How can I stay updated on further developments or reports in the Paper Carrier Tape for Electronic Components?
To stay informed about further developments, trends, and reports in the Paper Carrier Tape for Electronic Components, consider subscribing to industry newsletters, following relevant companies and organizations, or regularly checking reputable industry news sources and publications.
Methodology
Step 1 - Identification of Relevant Samples Size from Population Database


Step 2 - Approaches for Defining Global Market Size (Value, Volume* & Price*)

Note*: In applicable scenarios
Step 3 - Data Sources
Primary Research
- Web Analytics
- Survey Reports
- Research Institute
- Latest Research Reports
- Opinion Leaders
Secondary Research
- Annual Reports
- White Paper
- Latest Press Release
- Industry Association
- Paid Database
- Investor Presentations

Step 4 - Data Triangulation
Involves using different sources of information in order to increase the validity of a study
These sources are likely to be stakeholders in a program - participants, other researchers, program staff, other community members, and so on.
Then we put all data in single framework & apply various statistical tools to find out the dynamic on the market.
During the analysis stage, feedback from the stakeholder groups would be compared to determine areas of agreement as well as areas of divergence

