
Key Insights
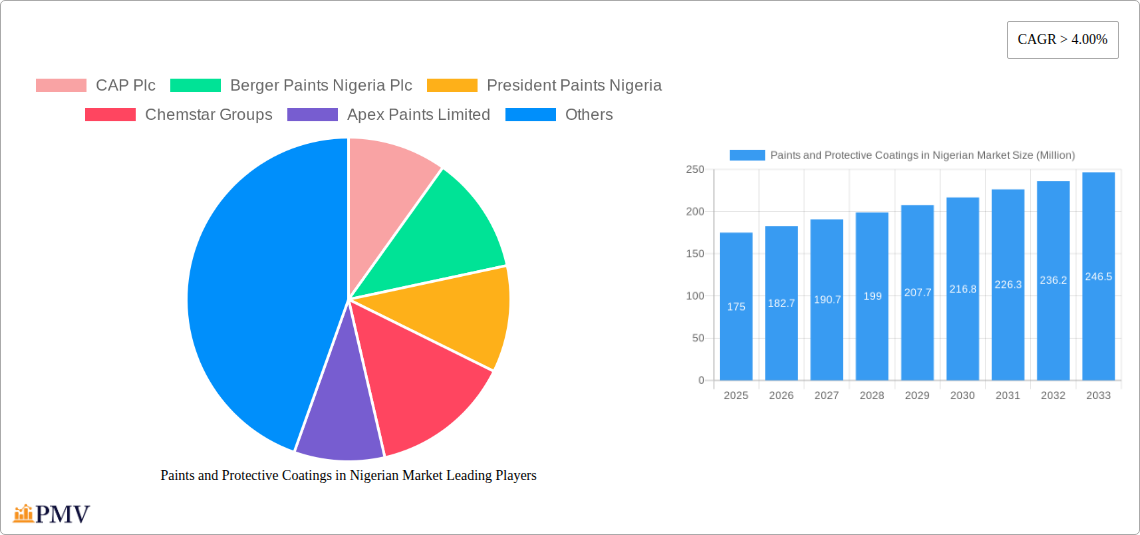
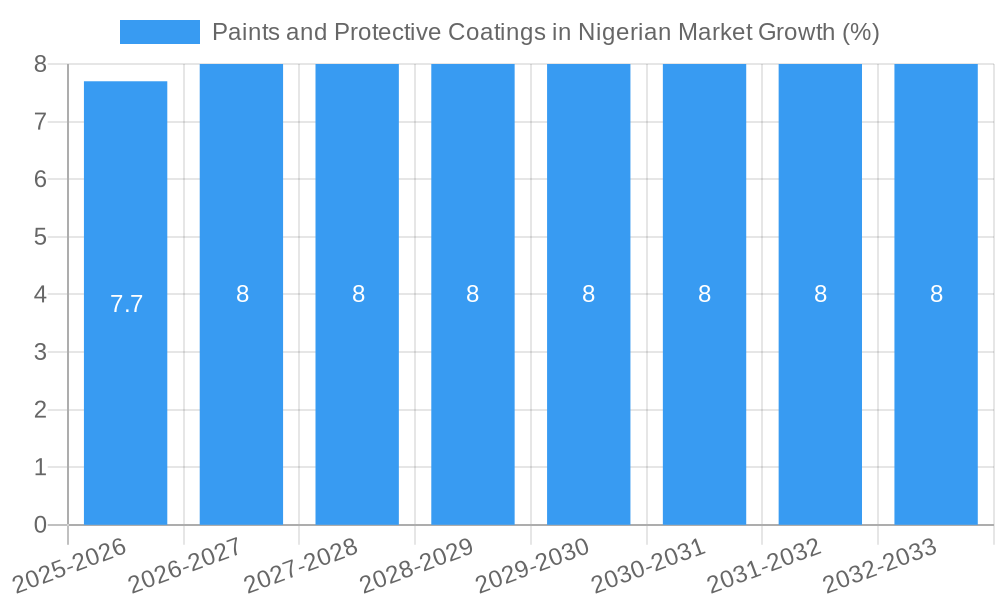
The Nigerian paints and protective coatings market presents a significant growth opportunity, exhibiting a Compound Annual Growth Rate (CAGR) exceeding 4% from 2019 to 2033. Driven by robust infrastructure development, a burgeoning construction sector, and increasing demand from the oil and gas and mining industries, the market is poised for substantial expansion. Key segments contributing to this growth include epoxy, polyurethane, and polyester resins, predominantly utilized in solvent-based applications. The market's growth is further fueled by a rising middle class with increased disposable income, leading to higher spending on home improvement and renovations. However, challenges remain, such as fluctuating raw material prices, economic volatility, and the potential for import competition. While precise market sizing is unavailable, considering the CAGR and growth drivers, a reasonable estimate for the 2025 market value could be in the range of $150-200 million USD, projected to grow substantially by 2033. Major players like Berger Paints Nigeria Plc, Akzo Nobel NV, and PPG Industries are actively competing in this dynamic market. The future success of businesses in this sector will depend on adapting to market trends, effectively managing costs, and investing in innovative and sustainable coating solutions. The shift towards environmentally friendly water-based coatings is also a notable trend that will likely influence future market dynamics.
The segmentation of the Nigerian paints and protective coatings market reveals a diverse landscape. Epoxy, polyurethane, and polyester resins dominate the product type segment, reflecting their widespread use across various applications. Solvent-based technology currently holds a larger market share, but the increasing awareness of environmental concerns is gradually driving a shift towards water-based alternatives. The end-user industry segment showcases strong demand from oil and gas, mining, and infrastructure sectors, with growth projected in other areas like waste treatment and pulp and paper. Further market research will refine these estimates and provide a deeper understanding of specific market segments and their respective growth potentials. The competitive landscape is marked by both local and international players, each with its own strengths and market strategies.
Paints and Protective Coatings in Nigerian Market: A Comprehensive Market Report (2019-2033)
This in-depth report provides a comprehensive analysis of the Nigerian paints and protective coatings market, offering invaluable insights for businesses, investors, and industry stakeholders. Covering the period from 2019 to 2033, with a focus on 2025, this report dissects market dynamics, competitive landscapes, and future growth potential. The study encompasses a detailed segmentation by product type (Epoxy Resin, Polyurethane Resin, Polyester Resin, Vinyl Ester Resin, Other Product Types), technology (Water-based, Solvent-based, Powder-based), and end-user industry (Oil and Gas, Mining, Power, Infrastructure, Other End-user Industries). Key players like CAP Plc, Berger Paints Nigeria Plc, and Akzo Nobel NV are analyzed, offering strategic recommendations for success in this dynamic market. The report projects a market value of xx Million by 2033, presenting a robust forecast for informed decision-making.
Paints and Protective Coatings in Nigerian Market Market Structure & Competitive Dynamics
The Nigerian paints and protective coatings market exhibits a moderately concentrated structure, with a few major players commanding significant market share. CAP Plc and Berger Paints Nigeria Plc are prominent examples, constantly vying for top positions. However, several medium and smaller players contribute significantly, fostering a competitive landscape. The market is characterized by a mix of domestic and multinational companies, with ongoing innovation in product formulations and application technologies. Regulatory frameworks, including environmental regulations and standards, impact product development and market access. Product substitution, primarily driven by cost and performance considerations, is a factor, particularly in the lower-end segments. End-user trends are heavily influenced by infrastructure development, construction activity, and the performance requirements of various industrial sectors.
- Market Concentration: Moderately concentrated, with top 5 players holding approximately xx% market share in 2024.
- Innovation Ecosystems: Growing presence of R&D facilities, partnerships with technology providers, and a focus on sustainable formulations.
- Regulatory Frameworks: Stringent environmental standards driving the adoption of eco-friendly coatings.
- M&A Activities: Significant M&A activity, exemplified by CAP Plc's merger with Portland Paints & Products Nigeria Plc in February 2021. The total deal value for this merger was xx Million. Further, Akzo Nobel's acquisition of Kansai Paint's African operations is expected to significantly reshape the competitive landscape. The estimated value of this deal is xx Million.
Paints and Protective Coatings in Nigerian Market Industry Trends & Insights
The Nigerian paints and protective coatings market is experiencing robust growth, driven by increasing construction activity, infrastructure development, and industrial expansion. The market's compound annual growth rate (CAGR) from 2019 to 2024 was xx%, and is projected to be xx% from 2025 to 2033. This growth is further fueled by rising disposable incomes, urbanization, and government initiatives promoting infrastructure projects. Technological advancements, such as the development of water-based and powder-based coatings, are gaining traction due to their environmental friendliness and superior performance characteristics. Consumer preferences are shifting toward high-performance, durable, and environmentally sustainable coatings. The increased awareness of environmental protection is pushing the demand for eco-friendly coatings. Competitive dynamics are intensifying, with companies focusing on product differentiation, innovation, and strategic partnerships. Market penetration of water-based paints is increasing rapidly, while the solvent-based paints segment is facing pressure due to environmental regulations.
Dominant Markets & Segments in Paints and Protective Coatings in Nigerian Market
The infrastructure sector is a dominant end-user industry for paints and protective coatings in Nigeria. Rapid urbanization and government initiatives to improve infrastructure are key growth drivers. Amongst product types, the demand for epoxy resins is high due to their superior durability and resistance to harsh conditions, particularly in industrial applications. Water-based technology is gaining significant traction due to its environmental benefits and regulatory pressures.
- Key Drivers for Infrastructure Segment:
- Robust government spending on infrastructure projects.
- Increasing urbanization and housing demand.
- Growing industrialization and manufacturing activities.
- Dominance Analysis: The infrastructure segment holds the largest market share, followed by the Oil and Gas sector. Epoxy resins and water-based technologies dominate product type and technology segments.
Paints and Protective Coatings in Nigerian Market Product Innovations
Recent innovations focus on developing high-performance, eco-friendly coatings. Water-based and powder-based coatings are gaining prominence due to their environmental benefits and improved performance. Companies are emphasizing the development of specialized coatings for specific applications, such as corrosion protection in harsh environments. The focus on sustainable and high-performance products is driving innovation and creating new competitive advantages.
Report Segmentation & Scope
This report segments the Nigerian paints and protective coatings market by product type (Epoxy, Polyurethane, Polyester, Vinyl Ester, Others), technology (Water-based, Solvent-based, Powder-based), and end-user industry (Oil & Gas, Mining, Power, Infrastructure, Others). Each segment's market size, growth projections, and competitive dynamics are analyzed. For instance, the water-based segment is expected to witness significant growth due to environmental regulations, while the infrastructure sector remains a key driver for overall market expansion.
Key Drivers of Paints and Protective Coatings in Nigerian Market Growth
The Nigerian paints and protective coatings market's growth is driven by several factors: a burgeoning construction sector fueled by population growth and urbanization; increasing industrial activity across various sectors; government initiatives to improve infrastructure; and rising disposable incomes leading to higher spending on home improvement and renovation. Technological advancements in coatings formulations, promoting durability and environmental friendliness, also play a significant role.
Challenges in the Paints and Protective Coatings in Nigerian Market Sector
Challenges include volatile raw material prices, import dependence for certain raw materials, and intense competition. Furthermore, regulatory hurdles and infrastructural limitations in the supply chain pose difficulties for companies. The fluctuating exchange rates also contribute to price volatility. These factors create uncertainties in the market and impact the profitability of businesses.
Leading Players in the Paints and Protective Coatings in Nigerian Market Market
- CAP Plc
- Berger Paints Nigeria Plc
- President Paints Nigeria
- Chemstar Groups
- Apex Paints Limited
- Akzo Nobel NV
- PCMN PLC
- Prestige Paints Company Limited
- Eagle Paints
- Meyer Plc
- Premier Paints Plc
- PPG Industries
Key Developments in Paints and Protective Coatings in Nigerian Market Sector
- February 2021: CAP Plc completed its merger with Portland Paints & Products Nigeria Plc, consolidating its position in the market.
- June 2022: AkzoNobel finalized its acquisition of Kansai Paint's African paints and coatings operations, significantly expanding its market presence.
Strategic Paints and Protective Coatings in Nigerian Market Market Outlook
The Nigerian paints and protective coatings market presents significant opportunities for growth. Continued infrastructure development, urbanization, and industrial expansion will drive demand. Companies that focus on innovation, sustainability, and efficient supply chain management are expected to thrive. Strategic partnerships and investments in R&D will be key to securing a competitive edge in this dynamic market.
Paints and Protective Coatings in Nigerian Market Segmentation
-
1. Product Type
- 1.1. Epoxy Resin
- 1.2. Polyurethane Resin
- 1.3. Polyester Resin
- 1.4. Vinyl Ester Resin
- 1.5. Other Product Types (Phenolic, PTFE, Phosphate)
-
2. Technology
- 2.1. Water-based
- 2.2. Solvent-based
- 2.3. Powder-based
-
3. End-user Industry
- 3.1. Oil and Gas
- 3.2. Mining
- 3.3. Power
- 3.4. Infrastructure
- 3.5. Other En
Paints and Protective Coatings in Nigerian Market Segmentation By Geography
-
1. North America
- 1.1. United States
- 1.2. Canada
- 1.3. Mexico
-
2. South America
- 2.1. Brazil
- 2.2. Argentina
- 2.3. Rest of South America
-
3. Europe
- 3.1. United Kingdom
- 3.2. Germany
- 3.3. France
- 3.4. Italy
- 3.5. Spain
- 3.6. Russia
- 3.7. Benelux
- 3.8. Nordics
- 3.9. Rest of Europe
-
4. Middle East & Africa
- 4.1. Turkey
- 4.2. Israel
- 4.3. GCC
- 4.4. North Africa
- 4.5. South Africa
- 4.6. Rest of Middle East & Africa
-
5. Asia Pacific
- 5.1. China
- 5.2. India
- 5.3. Japan
- 5.4. South Korea
- 5.5. ASEAN
- 5.6. Oceania
- 5.7. Rest of Asia Pacific
Paints and Protective Coatings in Nigerian Market REPORT HIGHLIGHTS
| Aspects | Details |
|---|---|
| Study Period | 2019-2033 |
| Base Year | 2024 |
| Estimated Year | 2025 |
| Forecast Period | 2025-2033 |
| Historical Period | 2019-2024 |
| Growth Rate | CAGR of > 4.00% from 2019-2033 |
| Segmentation |
|
Table of Contents
- 1. Introduction
- 1.1. Research Scope
- 1.2. Market Segmentation
- 1.3. Research Methodology
- 1.4. Definitions and Assumptions
- 2. Executive Summary
- 2.1. Introduction
- 3. Market Dynamics
- 3.1. Introduction
- 3.2. Market Drivers
- 3.2.1. Growing Infrastructure Activities with Government Support; Increase in off-shore oil drilling activities
- 3.3. Market Restrains
- 3.3.1. Regulations Related to the VOC Emissions
- 3.4. Market Trends
- 3.4.1. Oil and Gas End-user Industry to dominate the market
- 4. Market Factor Analysis
- 4.1. Porters Five Forces
- 4.2. Supply/Value Chain
- 4.3. PESTEL analysis
- 4.4. Market Entropy
- 4.5. Patent/Trademark Analysis
- 5. Global Paints and Protective Coatings in Nigerian Market Analysis, Insights and Forecast, 2019-2031
- 5.1. Market Analysis, Insights and Forecast - by Product Type
- 5.1.1. Epoxy Resin
- 5.1.2. Polyurethane Resin
- 5.1.3. Polyester Resin
- 5.1.4. Vinyl Ester Resin
- 5.1.5. Other Product Types (Phenolic, PTFE, Phosphate)
- 5.2. Market Analysis, Insights and Forecast - by Technology
- 5.2.1. Water-based
- 5.2.2. Solvent-based
- 5.2.3. Powder-based
- 5.3. Market Analysis, Insights and Forecast - by End-user Industry
- 5.3.1. Oil and Gas
- 5.3.2. Mining
- 5.3.3. Power
- 5.3.4. Infrastructure
- 5.3.5. Other En
- 5.4. Market Analysis, Insights and Forecast - by Region
- 5.4.1. North America
- 5.4.2. South America
- 5.4.3. Europe
- 5.4.4. Middle East & Africa
- 5.4.5. Asia Pacific
- 5.1. Market Analysis, Insights and Forecast - by Product Type
- 6. North America Paints and Protective Coatings in Nigerian Market Analysis, Insights and Forecast, 2019-2031
- 6.1. Market Analysis, Insights and Forecast - by Product Type
- 6.1.1. Epoxy Resin
- 6.1.2. Polyurethane Resin
- 6.1.3. Polyester Resin
- 6.1.4. Vinyl Ester Resin
- 6.1.5. Other Product Types (Phenolic, PTFE, Phosphate)
- 6.2. Market Analysis, Insights and Forecast - by Technology
- 6.2.1. Water-based
- 6.2.2. Solvent-based
- 6.2.3. Powder-based
- 6.3. Market Analysis, Insights and Forecast - by End-user Industry
- 6.3.1. Oil and Gas
- 6.3.2. Mining
- 6.3.3. Power
- 6.3.4. Infrastructure
- 6.3.5. Other En
- 6.1. Market Analysis, Insights and Forecast - by Product Type
- 7. South America Paints and Protective Coatings in Nigerian Market Analysis, Insights and Forecast, 2019-2031
- 7.1. Market Analysis, Insights and Forecast - by Product Type
- 7.1.1. Epoxy Resin
- 7.1.2. Polyurethane Resin
- 7.1.3. Polyester Resin
- 7.1.4. Vinyl Ester Resin
- 7.1.5. Other Product Types (Phenolic, PTFE, Phosphate)
- 7.2. Market Analysis, Insights and Forecast - by Technology
- 7.2.1. Water-based
- 7.2.2. Solvent-based
- 7.2.3. Powder-based
- 7.3. Market Analysis, Insights and Forecast - by End-user Industry
- 7.3.1. Oil and Gas
- 7.3.2. Mining
- 7.3.3. Power
- 7.3.4. Infrastructure
- 7.3.5. Other En
- 7.1. Market Analysis, Insights and Forecast - by Product Type
- 8. Europe Paints and Protective Coatings in Nigerian Market Analysis, Insights and Forecast, 2019-2031
- 8.1. Market Analysis, Insights and Forecast - by Product Type
- 8.1.1. Epoxy Resin
- 8.1.2. Polyurethane Resin
- 8.1.3. Polyester Resin
- 8.1.4. Vinyl Ester Resin
- 8.1.5. Other Product Types (Phenolic, PTFE, Phosphate)
- 8.2. Market Analysis, Insights and Forecast - by Technology
- 8.2.1. Water-based
- 8.2.2. Solvent-based
- 8.2.3. Powder-based
- 8.3. Market Analysis, Insights and Forecast - by End-user Industry
- 8.3.1. Oil and Gas
- 8.3.2. Mining
- 8.3.3. Power
- 8.3.4. Infrastructure
- 8.3.5. Other En
- 8.1. Market Analysis, Insights and Forecast - by Product Type
- 9. Middle East & Africa Paints and Protective Coatings in Nigerian Market Analysis, Insights and Forecast, 2019-2031
- 9.1. Market Analysis, Insights and Forecast - by Product Type
- 9.1.1. Epoxy Resin
- 9.1.2. Polyurethane Resin
- 9.1.3. Polyester Resin
- 9.1.4. Vinyl Ester Resin
- 9.1.5. Other Product Types (Phenolic, PTFE, Phosphate)
- 9.2. Market Analysis, Insights and Forecast - by Technology
- 9.2.1. Water-based
- 9.2.2. Solvent-based
- 9.2.3. Powder-based
- 9.3. Market Analysis, Insights and Forecast - by End-user Industry
- 9.3.1. Oil and Gas
- 9.3.2. Mining
- 9.3.3. Power
- 9.3.4. Infrastructure
- 9.3.5. Other En
- 9.1. Market Analysis, Insights and Forecast - by Product Type
- 10. Asia Pacific Paints and Protective Coatings in Nigerian Market Analysis, Insights and Forecast, 2019-2031
- 10.1. Market Analysis, Insights and Forecast - by Product Type
- 10.1.1. Epoxy Resin
- 10.1.2. Polyurethane Resin
- 10.1.3. Polyester Resin
- 10.1.4. Vinyl Ester Resin
- 10.1.5. Other Product Types (Phenolic, PTFE, Phosphate)
- 10.2. Market Analysis, Insights and Forecast - by Technology
- 10.2.1. Water-based
- 10.2.2. Solvent-based
- 10.2.3. Powder-based
- 10.3. Market Analysis, Insights and Forecast - by End-user Industry
- 10.3.1. Oil and Gas
- 10.3.2. Mining
- 10.3.3. Power
- 10.3.4. Infrastructure
- 10.3.5. Other En
- 10.1. Market Analysis, Insights and Forecast - by Product Type
- 11. Competitive Analysis
- 11.1. Global Market Share Analysis 2024
- 11.2. Company Profiles
- 11.2.1 CAP Plc
- 11.2.1.1. Overview
- 11.2.1.2. Products
- 11.2.1.3. SWOT Analysis
- 11.2.1.4. Recent Developments
- 11.2.1.5. Financials (Based on Availability)
- 11.2.2 Berger Paints Nigeria Plc
- 11.2.2.1. Overview
- 11.2.2.2. Products
- 11.2.2.3. SWOT Analysis
- 11.2.2.4. Recent Developments
- 11.2.2.5. Financials (Based on Availability)
- 11.2.3 President Paints Nigeria
- 11.2.3.1. Overview
- 11.2.3.2. Products
- 11.2.3.3. SWOT Analysis
- 11.2.3.4. Recent Developments
- 11.2.3.5. Financials (Based on Availability)
- 11.2.4 Chemstar Groups
- 11.2.4.1. Overview
- 11.2.4.2. Products
- 11.2.4.3. SWOT Analysis
- 11.2.4.4. Recent Developments
- 11.2.4.5. Financials (Based on Availability)
- 11.2.5 Apex Paints Limited
- 11.2.5.1. Overview
- 11.2.5.2. Products
- 11.2.5.3. SWOT Analysis
- 11.2.5.4. Recent Developments
- 11.2.5.5. Financials (Based on Availability)
- 11.2.6 Akzo Nobel NV
- 11.2.6.1. Overview
- 11.2.6.2. Products
- 11.2.6.3. SWOT Analysis
- 11.2.6.4. Recent Developments
- 11.2.6.5. Financials (Based on Availability)
- 11.2.7 PCMN PLC
- 11.2.7.1. Overview
- 11.2.7.2. Products
- 11.2.7.3. SWOT Analysis
- 11.2.7.4. Recent Developments
- 11.2.7.5. Financials (Based on Availability)
- 11.2.8 Prestige Paints Company Limited*List Not Exhaustive
- 11.2.8.1. Overview
- 11.2.8.2. Products
- 11.2.8.3. SWOT Analysis
- 11.2.8.4. Recent Developments
- 11.2.8.5. Financials (Based on Availability)
- 11.2.9 Eagle Paints
- 11.2.9.1. Overview
- 11.2.9.2. Products
- 11.2.9.3. SWOT Analysis
- 11.2.9.4. Recent Developments
- 11.2.9.5. Financials (Based on Availability)
- 11.2.10 Meyer Plc
- 11.2.10.1. Overview
- 11.2.10.2. Products
- 11.2.10.3. SWOT Analysis
- 11.2.10.4. Recent Developments
- 11.2.10.5. Financials (Based on Availability)
- 11.2.11 Premier Paints Plc
- 11.2.11.1. Overview
- 11.2.11.2. Products
- 11.2.11.3. SWOT Analysis
- 11.2.11.4. Recent Developments
- 11.2.11.5. Financials (Based on Availability)
- 11.2.12 PPG Industries
- 11.2.12.1. Overview
- 11.2.12.2. Products
- 11.2.12.3. SWOT Analysis
- 11.2.12.4. Recent Developments
- 11.2.12.5. Financials (Based on Availability)
- 11.2.1 CAP Plc
List of Figures
- Figure 1: Global Paints and Protective Coatings in Nigerian Market Revenue Breakdown (Million, %) by Region 2024 & 2032
- Figure 2: Global Paints and Protective Coatings in Nigerian Market Volume Breakdown (liter , %) by Region 2024 & 2032
- Figure 3: Nigeria Paints and Protective Coatings in Nigerian Market Revenue (Million), by Country 2024 & 2032
- Figure 4: Nigeria Paints and Protective Coatings in Nigerian Market Volume (liter ), by Country 2024 & 2032
- Figure 5: Nigeria Paints and Protective Coatings in Nigerian Market Revenue Share (%), by Country 2024 & 2032
- Figure 6: Nigeria Paints and Protective Coatings in Nigerian Market Volume Share (%), by Country 2024 & 2032
- Figure 7: North America Paints and Protective Coatings in Nigerian Market Revenue (Million), by Product Type 2024 & 2032
- Figure 8: North America Paints and Protective Coatings in Nigerian Market Volume (liter ), by Product Type 2024 & 2032
- Figure 9: North America Paints and Protective Coatings in Nigerian Market Revenue Share (%), by Product Type 2024 & 2032
- Figure 10: North America Paints and Protective Coatings in Nigerian Market Volume Share (%), by Product Type 2024 & 2032
- Figure 11: North America Paints and Protective Coatings in Nigerian Market Revenue (Million), by Technology 2024 & 2032
- Figure 12: North America Paints and Protective Coatings in Nigerian Market Volume (liter ), by Technology 2024 & 2032
- Figure 13: North America Paints and Protective Coatings in Nigerian Market Revenue Share (%), by Technology 2024 & 2032
- Figure 14: North America Paints and Protective Coatings in Nigerian Market Volume Share (%), by Technology 2024 & 2032
- Figure 15: North America Paints and Protective Coatings in Nigerian Market Revenue (Million), by End-user Industry 2024 & 2032
- Figure 16: North America Paints and Protective Coatings in Nigerian Market Volume (liter ), by End-user Industry 2024 & 2032
- Figure 17: North America Paints and Protective Coatings in Nigerian Market Revenue Share (%), by End-user Industry 2024 & 2032
- Figure 18: North America Paints and Protective Coatings in Nigerian Market Volume Share (%), by End-user Industry 2024 & 2032
- Figure 19: North America Paints and Protective Coatings in Nigerian Market Revenue (Million), by Country 2024 & 2032
- Figure 20: North America Paints and Protective Coatings in Nigerian Market Volume (liter ), by Country 2024 & 2032
- Figure 21: North America Paints and Protective Coatings in Nigerian Market Revenue Share (%), by Country 2024 & 2032
- Figure 22: North America Paints and Protective Coatings in Nigerian Market Volume Share (%), by Country 2024 & 2032
- Figure 23: South America Paints and Protective Coatings in Nigerian Market Revenue (Million), by Product Type 2024 & 2032
- Figure 24: South America Paints and Protective Coatings in Nigerian Market Volume (liter ), by Product Type 2024 & 2032
- Figure 25: South America Paints and Protective Coatings in Nigerian Market Revenue Share (%), by Product Type 2024 & 2032
- Figure 26: South America Paints and Protective Coatings in Nigerian Market Volume Share (%), by Product Type 2024 & 2032
- Figure 27: South America Paints and Protective Coatings in Nigerian Market Revenue (Million), by Technology 2024 & 2032
- Figure 28: South America Paints and Protective Coatings in Nigerian Market Volume (liter ), by Technology 2024 & 2032
- Figure 29: South America Paints and Protective Coatings in Nigerian Market Revenue Share (%), by Technology 2024 & 2032
- Figure 30: South America Paints and Protective Coatings in Nigerian Market Volume Share (%), by Technology 2024 & 2032
- Figure 31: South America Paints and Protective Coatings in Nigerian Market Revenue (Million), by End-user Industry 2024 & 2032
- Figure 32: South America Paints and Protective Coatings in Nigerian Market Volume (liter ), by End-user Industry 2024 & 2032
- Figure 33: South America Paints and Protective Coatings in Nigerian Market Revenue Share (%), by End-user Industry 2024 & 2032
- Figure 34: South America Paints and Protective Coatings in Nigerian Market Volume Share (%), by End-user Industry 2024 & 2032
- Figure 35: South America Paints and Protective Coatings in Nigerian Market Revenue (Million), by Country 2024 & 2032
- Figure 36: South America Paints and Protective Coatings in Nigerian Market Volume (liter ), by Country 2024 & 2032
- Figure 37: South America Paints and Protective Coatings in Nigerian Market Revenue Share (%), by Country 2024 & 2032
- Figure 38: South America Paints and Protective Coatings in Nigerian Market Volume Share (%), by Country 2024 & 2032
- Figure 39: Europe Paints and Protective Coatings in Nigerian Market Revenue (Million), by Product Type 2024 & 2032
- Figure 40: Europe Paints and Protective Coatings in Nigerian Market Volume (liter ), by Product Type 2024 & 2032
- Figure 41: Europe Paints and Protective Coatings in Nigerian Market Revenue Share (%), by Product Type 2024 & 2032
- Figure 42: Europe Paints and Protective Coatings in Nigerian Market Volume Share (%), by Product Type 2024 & 2032
- Figure 43: Europe Paints and Protective Coatings in Nigerian Market Revenue (Million), by Technology 2024 & 2032
- Figure 44: Europe Paints and Protective Coatings in Nigerian Market Volume (liter ), by Technology 2024 & 2032
- Figure 45: Europe Paints and Protective Coatings in Nigerian Market Revenue Share (%), by Technology 2024 & 2032
- Figure 46: Europe Paints and Protective Coatings in Nigerian Market Volume Share (%), by Technology 2024 & 2032
- Figure 47: Europe Paints and Protective Coatings in Nigerian Market Revenue (Million), by End-user Industry 2024 & 2032
- Figure 48: Europe Paints and Protective Coatings in Nigerian Market Volume (liter ), by End-user Industry 2024 & 2032
- Figure 49: Europe Paints and Protective Coatings in Nigerian Market Revenue Share (%), by End-user Industry 2024 & 2032
- Figure 50: Europe Paints and Protective Coatings in Nigerian Market Volume Share (%), by End-user Industry 2024 & 2032
- Figure 51: Europe Paints and Protective Coatings in Nigerian Market Revenue (Million), by Country 2024 & 2032
- Figure 52: Europe Paints and Protective Coatings in Nigerian Market Volume (liter ), by Country 2024 & 2032
- Figure 53: Europe Paints and Protective Coatings in Nigerian Market Revenue Share (%), by Country 2024 & 2032
- Figure 54: Europe Paints and Protective Coatings in Nigerian Market Volume Share (%), by Country 2024 & 2032
- Figure 55: Middle East & Africa Paints and Protective Coatings in Nigerian Market Revenue (Million), by Product Type 2024 & 2032
- Figure 56: Middle East & Africa Paints and Protective Coatings in Nigerian Market Volume (liter ), by Product Type 2024 & 2032
- Figure 57: Middle East & Africa Paints and Protective Coatings in Nigerian Market Revenue Share (%), by Product Type 2024 & 2032
- Figure 58: Middle East & Africa Paints and Protective Coatings in Nigerian Market Volume Share (%), by Product Type 2024 & 2032
- Figure 59: Middle East & Africa Paints and Protective Coatings in Nigerian Market Revenue (Million), by Technology 2024 & 2032
- Figure 60: Middle East & Africa Paints and Protective Coatings in Nigerian Market Volume (liter ), by Technology 2024 & 2032
- Figure 61: Middle East & Africa Paints and Protective Coatings in Nigerian Market Revenue Share (%), by Technology 2024 & 2032
- Figure 62: Middle East & Africa Paints and Protective Coatings in Nigerian Market Volume Share (%), by Technology 2024 & 2032
- Figure 63: Middle East & Africa Paints and Protective Coatings in Nigerian Market Revenue (Million), by End-user Industry 2024 & 2032
- Figure 64: Middle East & Africa Paints and Protective Coatings in Nigerian Market Volume (liter ), by End-user Industry 2024 & 2032
- Figure 65: Middle East & Africa Paints and Protective Coatings in Nigerian Market Revenue Share (%), by End-user Industry 2024 & 2032
- Figure 66: Middle East & Africa Paints and Protective Coatings in Nigerian Market Volume Share (%), by End-user Industry 2024 & 2032
- Figure 67: Middle East & Africa Paints and Protective Coatings in Nigerian Market Revenue (Million), by Country 2024 & 2032
- Figure 68: Middle East & Africa Paints and Protective Coatings in Nigerian Market Volume (liter ), by Country 2024 & 2032
- Figure 69: Middle East & Africa Paints and Protective Coatings in Nigerian Market Revenue Share (%), by Country 2024 & 2032
- Figure 70: Middle East & Africa Paints and Protective Coatings in Nigerian Market Volume Share (%), by Country 2024 & 2032
- Figure 71: Asia Pacific Paints and Protective Coatings in Nigerian Market Revenue (Million), by Product Type 2024 & 2032
- Figure 72: Asia Pacific Paints and Protective Coatings in Nigerian Market Volume (liter ), by Product Type 2024 & 2032
- Figure 73: Asia Pacific Paints and Protective Coatings in Nigerian Market Revenue Share (%), by Product Type 2024 & 2032
- Figure 74: Asia Pacific Paints and Protective Coatings in Nigerian Market Volume Share (%), by Product Type 2024 & 2032
- Figure 75: Asia Pacific Paints and Protective Coatings in Nigerian Market Revenue (Million), by Technology 2024 & 2032
- Figure 76: Asia Pacific Paints and Protective Coatings in Nigerian Market Volume (liter ), by Technology 2024 & 2032
- Figure 77: Asia Pacific Paints and Protective Coatings in Nigerian Market Revenue Share (%), by Technology 2024 & 2032
- Figure 78: Asia Pacific Paints and Protective Coatings in Nigerian Market Volume Share (%), by Technology 2024 & 2032
- Figure 79: Asia Pacific Paints and Protective Coatings in Nigerian Market Revenue (Million), by End-user Industry 2024 & 2032
- Figure 80: Asia Pacific Paints and Protective Coatings in Nigerian Market Volume (liter ), by End-user Industry 2024 & 2032
- Figure 81: Asia Pacific Paints and Protective Coatings in Nigerian Market Revenue Share (%), by End-user Industry 2024 & 2032
- Figure 82: Asia Pacific Paints and Protective Coatings in Nigerian Market Volume Share (%), by End-user Industry 2024 & 2032
- Figure 83: Asia Pacific Paints and Protective Coatings in Nigerian Market Revenue (Million), by Country 2024 & 2032
- Figure 84: Asia Pacific Paints and Protective Coatings in Nigerian Market Volume (liter ), by Country 2024 & 2032
- Figure 85: Asia Pacific Paints and Protective Coatings in Nigerian Market Revenue Share (%), by Country 2024 & 2032
- Figure 86: Asia Pacific Paints and Protective Coatings in Nigerian Market Volume Share (%), by Country 2024 & 2032
List of Tables
- Table 1: Global Paints and Protective Coatings in Nigerian Market Revenue Million Forecast, by Region 2019 & 2032
- Table 2: Global Paints and Protective Coatings in Nigerian Market Volume liter Forecast, by Region 2019 & 2032
- Table 3: Global Paints and Protective Coatings in Nigerian Market Revenue Million Forecast, by Product Type 2019 & 2032
- Table 4: Global Paints and Protective Coatings in Nigerian Market Volume liter Forecast, by Product Type 2019 & 2032
- Table 5: Global Paints and Protective Coatings in Nigerian Market Revenue Million Forecast, by Technology 2019 & 2032
- Table 6: Global Paints and Protective Coatings in Nigerian Market Volume liter Forecast, by Technology 2019 & 2032
- Table 7: Global Paints and Protective Coatings in Nigerian Market Revenue Million Forecast, by End-user Industry 2019 & 2032
- Table 8: Global Paints and Protective Coatings in Nigerian Market Volume liter Forecast, by End-user Industry 2019 & 2032
- Table 9: Global Paints and Protective Coatings in Nigerian Market Revenue Million Forecast, by Region 2019 & 2032
- Table 10: Global Paints and Protective Coatings in Nigerian Market Volume liter Forecast, by Region 2019 & 2032
- Table 11: Global Paints and Protective Coatings in Nigerian Market Revenue Million Forecast, by Country 2019 & 2032
- Table 12: Global Paints and Protective Coatings in Nigerian Market Volume liter Forecast, by Country 2019 & 2032
- Table 13: Global Paints and Protective Coatings in Nigerian Market Revenue Million Forecast, by Product Type 2019 & 2032
- Table 14: Global Paints and Protective Coatings in Nigerian Market Volume liter Forecast, by Product Type 2019 & 2032
- Table 15: Global Paints and Protective Coatings in Nigerian Market Revenue Million Forecast, by Technology 2019 & 2032
- Table 16: Global Paints and Protective Coatings in Nigerian Market Volume liter Forecast, by Technology 2019 & 2032
- Table 17: Global Paints and Protective Coatings in Nigerian Market Revenue Million Forecast, by End-user Industry 2019 & 2032
- Table 18: Global Paints and Protective Coatings in Nigerian Market Volume liter Forecast, by End-user Industry 2019 & 2032
- Table 19: Global Paints and Protective Coatings in Nigerian Market Revenue Million Forecast, by Country 2019 & 2032
- Table 20: Global Paints and Protective Coatings in Nigerian Market Volume liter Forecast, by Country 2019 & 2032
- Table 21: United States Paints and Protective Coatings in Nigerian Market Revenue (Million) Forecast, by Application 2019 & 2032
- Table 22: United States Paints and Protective Coatings in Nigerian Market Volume (liter ) Forecast, by Application 2019 & 2032
- Table 23: Canada Paints and Protective Coatings in Nigerian Market Revenue (Million) Forecast, by Application 2019 & 2032
- Table 24: Canada Paints and Protective Coatings in Nigerian Market Volume (liter ) Forecast, by Application 2019 & 2032
- Table 25: Mexico Paints and Protective Coatings in Nigerian Market Revenue (Million) Forecast, by Application 2019 & 2032
- Table 26: Mexico Paints and Protective Coatings in Nigerian Market Volume (liter ) Forecast, by Application 2019 & 2032
- Table 27: Global Paints and Protective Coatings in Nigerian Market Revenue Million Forecast, by Product Type 2019 & 2032
- Table 28: Global Paints and Protective Coatings in Nigerian Market Volume liter Forecast, by Product Type 2019 & 2032
- Table 29: Global Paints and Protective Coatings in Nigerian Market Revenue Million Forecast, by Technology 2019 & 2032
- Table 30: Global Paints and Protective Coatings in Nigerian Market Volume liter Forecast, by Technology 2019 & 2032
- Table 31: Global Paints and Protective Coatings in Nigerian Market Revenue Million Forecast, by End-user Industry 2019 & 2032
- Table 32: Global Paints and Protective Coatings in Nigerian Market Volume liter Forecast, by End-user Industry 2019 & 2032
- Table 33: Global Paints and Protective Coatings in Nigerian Market Revenue Million Forecast, by Country 2019 & 2032
- Table 34: Global Paints and Protective Coatings in Nigerian Market Volume liter Forecast, by Country 2019 & 2032
- Table 35: Brazil Paints and Protective Coatings in Nigerian Market Revenue (Million) Forecast, by Application 2019 & 2032
- Table 36: Brazil Paints and Protective Coatings in Nigerian Market Volume (liter ) Forecast, by Application 2019 & 2032
- Table 37: Argentina Paints and Protective Coatings in Nigerian Market Revenue (Million) Forecast, by Application 2019 & 2032
- Table 38: Argentina Paints and Protective Coatings in Nigerian Market Volume (liter ) Forecast, by Application 2019 & 2032
- Table 39: Rest of South America Paints and Protective Coatings in Nigerian Market Revenue (Million) Forecast, by Application 2019 & 2032
- Table 40: Rest of South America Paints and Protective Coatings in Nigerian Market Volume (liter ) Forecast, by Application 2019 & 2032
- Table 41: Global Paints and Protective Coatings in Nigerian Market Revenue Million Forecast, by Product Type 2019 & 2032
- Table 42: Global Paints and Protective Coatings in Nigerian Market Volume liter Forecast, by Product Type 2019 & 2032
- Table 43: Global Paints and Protective Coatings in Nigerian Market Revenue Million Forecast, by Technology 2019 & 2032
- Table 44: Global Paints and Protective Coatings in Nigerian Market Volume liter Forecast, by Technology 2019 & 2032
- Table 45: Global Paints and Protective Coatings in Nigerian Market Revenue Million Forecast, by End-user Industry 2019 & 2032
- Table 46: Global Paints and Protective Coatings in Nigerian Market Volume liter Forecast, by End-user Industry 2019 & 2032
- Table 47: Global Paints and Protective Coatings in Nigerian Market Revenue Million Forecast, by Country 2019 & 2032
- Table 48: Global Paints and Protective Coatings in Nigerian Market Volume liter Forecast, by Country 2019 & 2032
- Table 49: United Kingdom Paints and Protective Coatings in Nigerian Market Revenue (Million) Forecast, by Application 2019 & 2032
- Table 50: United Kingdom Paints and Protective Coatings in Nigerian Market Volume (liter ) Forecast, by Application 2019 & 2032
- Table 51: Germany Paints and Protective Coatings in Nigerian Market Revenue (Million) Forecast, by Application 2019 & 2032
- Table 52: Germany Paints and Protective Coatings in Nigerian Market Volume (liter ) Forecast, by Application 2019 & 2032
- Table 53: France Paints and Protective Coatings in Nigerian Market Revenue (Million) Forecast, by Application 2019 & 2032
- Table 54: France Paints and Protective Coatings in Nigerian Market Volume (liter ) Forecast, by Application 2019 & 2032
- Table 55: Italy Paints and Protective Coatings in Nigerian Market Revenue (Million) Forecast, by Application 2019 & 2032
- Table 56: Italy Paints and Protective Coatings in Nigerian Market Volume (liter ) Forecast, by Application 2019 & 2032
- Table 57: Spain Paints and Protective Coatings in Nigerian Market Revenue (Million) Forecast, by Application 2019 & 2032
- Table 58: Spain Paints and Protective Coatings in Nigerian Market Volume (liter ) Forecast, by Application 2019 & 2032
- Table 59: Russia Paints and Protective Coatings in Nigerian Market Revenue (Million) Forecast, by Application 2019 & 2032
- Table 60: Russia Paints and Protective Coatings in Nigerian Market Volume (liter ) Forecast, by Application 2019 & 2032
- Table 61: Benelux Paints and Protective Coatings in Nigerian Market Revenue (Million) Forecast, by Application 2019 & 2032
- Table 62: Benelux Paints and Protective Coatings in Nigerian Market Volume (liter ) Forecast, by Application 2019 & 2032
- Table 63: Nordics Paints and Protective Coatings in Nigerian Market Revenue (Million) Forecast, by Application 2019 & 2032
- Table 64: Nordics Paints and Protective Coatings in Nigerian Market Volume (liter ) Forecast, by Application 2019 & 2032
- Table 65: Rest of Europe Paints and Protective Coatings in Nigerian Market Revenue (Million) Forecast, by Application 2019 & 2032
- Table 66: Rest of Europe Paints and Protective Coatings in Nigerian Market Volume (liter ) Forecast, by Application 2019 & 2032
- Table 67: Global Paints and Protective Coatings in Nigerian Market Revenue Million Forecast, by Product Type 2019 & 2032
- Table 68: Global Paints and Protective Coatings in Nigerian Market Volume liter Forecast, by Product Type 2019 & 2032
- Table 69: Global Paints and Protective Coatings in Nigerian Market Revenue Million Forecast, by Technology 2019 & 2032
- Table 70: Global Paints and Protective Coatings in Nigerian Market Volume liter Forecast, by Technology 2019 & 2032
- Table 71: Global Paints and Protective Coatings in Nigerian Market Revenue Million Forecast, by End-user Industry 2019 & 2032
- Table 72: Global Paints and Protective Coatings in Nigerian Market Volume liter Forecast, by End-user Industry 2019 & 2032
- Table 73: Global Paints and Protective Coatings in Nigerian Market Revenue Million Forecast, by Country 2019 & 2032
- Table 74: Global Paints and Protective Coatings in Nigerian Market Volume liter Forecast, by Country 2019 & 2032
- Table 75: Turkey Paints and Protective Coatings in Nigerian Market Revenue (Million) Forecast, by Application 2019 & 2032
- Table 76: Turkey Paints and Protective Coatings in Nigerian Market Volume (liter ) Forecast, by Application 2019 & 2032
- Table 77: Israel Paints and Protective Coatings in Nigerian Market Revenue (Million) Forecast, by Application 2019 & 2032
- Table 78: Israel Paints and Protective Coatings in Nigerian Market Volume (liter ) Forecast, by Application 2019 & 2032
- Table 79: GCC Paints and Protective Coatings in Nigerian Market Revenue (Million) Forecast, by Application 2019 & 2032
- Table 80: GCC Paints and Protective Coatings in Nigerian Market Volume (liter ) Forecast, by Application 2019 & 2032
- Table 81: North Africa Paints and Protective Coatings in Nigerian Market Revenue (Million) Forecast, by Application 2019 & 2032
- Table 82: North Africa Paints and Protective Coatings in Nigerian Market Volume (liter ) Forecast, by Application 2019 & 2032
- Table 83: South Africa Paints and Protective Coatings in Nigerian Market Revenue (Million) Forecast, by Application 2019 & 2032
- Table 84: South Africa Paints and Protective Coatings in Nigerian Market Volume (liter ) Forecast, by Application 2019 & 2032
- Table 85: Rest of Middle East & Africa Paints and Protective Coatings in Nigerian Market Revenue (Million) Forecast, by Application 2019 & 2032
- Table 86: Rest of Middle East & Africa Paints and Protective Coatings in Nigerian Market Volume (liter ) Forecast, by Application 2019 & 2032
- Table 87: Global Paints and Protective Coatings in Nigerian Market Revenue Million Forecast, by Product Type 2019 & 2032
- Table 88: Global Paints and Protective Coatings in Nigerian Market Volume liter Forecast, by Product Type 2019 & 2032
- Table 89: Global Paints and Protective Coatings in Nigerian Market Revenue Million Forecast, by Technology 2019 & 2032
- Table 90: Global Paints and Protective Coatings in Nigerian Market Volume liter Forecast, by Technology 2019 & 2032
- Table 91: Global Paints and Protective Coatings in Nigerian Market Revenue Million Forecast, by End-user Industry 2019 & 2032
- Table 92: Global Paints and Protective Coatings in Nigerian Market Volume liter Forecast, by End-user Industry 2019 & 2032
- Table 93: Global Paints and Protective Coatings in Nigerian Market Revenue Million Forecast, by Country 2019 & 2032
- Table 94: Global Paints and Protective Coatings in Nigerian Market Volume liter Forecast, by Country 2019 & 2032
- Table 95: China Paints and Protective Coatings in Nigerian Market Revenue (Million) Forecast, by Application 2019 & 2032
- Table 96: China Paints and Protective Coatings in Nigerian Market Volume (liter ) Forecast, by Application 2019 & 2032
- Table 97: India Paints and Protective Coatings in Nigerian Market Revenue (Million) Forecast, by Application 2019 & 2032
- Table 98: India Paints and Protective Coatings in Nigerian Market Volume (liter ) Forecast, by Application 2019 & 2032
- Table 99: Japan Paints and Protective Coatings in Nigerian Market Revenue (Million) Forecast, by Application 2019 & 2032
- Table 100: Japan Paints and Protective Coatings in Nigerian Market Volume (liter ) Forecast, by Application 2019 & 2032
- Table 101: South Korea Paints and Protective Coatings in Nigerian Market Revenue (Million) Forecast, by Application 2019 & 2032
- Table 102: South Korea Paints and Protective Coatings in Nigerian Market Volume (liter ) Forecast, by Application 2019 & 2032
- Table 103: ASEAN Paints and Protective Coatings in Nigerian Market Revenue (Million) Forecast, by Application 2019 & 2032
- Table 104: ASEAN Paints and Protective Coatings in Nigerian Market Volume (liter ) Forecast, by Application 2019 & 2032
- Table 105: Oceania Paints and Protective Coatings in Nigerian Market Revenue (Million) Forecast, by Application 2019 & 2032
- Table 106: Oceania Paints and Protective Coatings in Nigerian Market Volume (liter ) Forecast, by Application 2019 & 2032
- Table 107: Rest of Asia Pacific Paints and Protective Coatings in Nigerian Market Revenue (Million) Forecast, by Application 2019 & 2032
- Table 108: Rest of Asia Pacific Paints and Protective Coatings in Nigerian Market Volume (liter ) Forecast, by Application 2019 & 2032
Frequently Asked Questions
1. What is the projected Compound Annual Growth Rate (CAGR) of the Paints and Protective Coatings in Nigerian Market?
The projected CAGR is approximately > 4.00%.
2. Which companies are prominent players in the Paints and Protective Coatings in Nigerian Market?
Key companies in the market include CAP Plc, Berger Paints Nigeria Plc, President Paints Nigeria, Chemstar Groups, Apex Paints Limited, Akzo Nobel NV, PCMN PLC, Prestige Paints Company Limited*List Not Exhaustive, Eagle Paints, Meyer Plc, Premier Paints Plc, PPG Industries.
3. What are the main segments of the Paints and Protective Coatings in Nigerian Market?
The market segments include Product Type, Technology, End-user Industry.
4. Can you provide details about the market size?
The market size is estimated to be USD XX Million as of 2022.
5. What are some drivers contributing to market growth?
Growing Infrastructure Activities with Government Support; Increase in off-shore oil drilling activities.
6. What are the notable trends driving market growth?
Oil and Gas End-user Industry to dominate the market.
7. Are there any restraints impacting market growth?
Regulations Related to the VOC Emissions.
8. Can you provide examples of recent developments in the market?
June 2022: AkzoNobel completed the agreement to acquire all paints and coatings activities of Kansai Paint in Africa. This acquisition is expected to be completed by 2023. After this acquisition, AkzoNobel will strengthen its footprint in the African region.
9. What pricing options are available for accessing the report?
Pricing options include single-user, multi-user, and enterprise licenses priced at USD 3800, USD 4500, and USD 5800 respectively.
10. Is the market size provided in terms of value or volume?
The market size is provided in terms of value, measured in Million and volume, measured in liter .
11. Are there any specific market keywords associated with the report?
Yes, the market keyword associated with the report is "Paints and Protective Coatings in Nigerian Market," which aids in identifying and referencing the specific market segment covered.
12. How do I determine which pricing option suits my needs best?
The pricing options vary based on user requirements and access needs. Individual users may opt for single-user licenses, while businesses requiring broader access may choose multi-user or enterprise licenses for cost-effective access to the report.
13. Are there any additional resources or data provided in the Paints and Protective Coatings in Nigerian Market report?
While the report offers comprehensive insights, it's advisable to review the specific contents or supplementary materials provided to ascertain if additional resources or data are available.
14. How can I stay updated on further developments or reports in the Paints and Protective Coatings in Nigerian Market?
To stay informed about further developments, trends, and reports in the Paints and Protective Coatings in Nigerian Market, consider subscribing to industry newsletters, following relevant companies and organizations, or regularly checking reputable industry news sources and publications.
Methodology
Step 1 - Identification of Relevant Samples Size from Population Database


Step 2 - Approaches for Defining Global Market Size (Value, Volume* & Price*)

Note*: In applicable scenarios
Step 3 - Data Sources
Primary Research
- Web Analytics
- Survey Reports
- Research Institute
- Latest Research Reports
- Opinion Leaders
Secondary Research
- Annual Reports
- White Paper
- Latest Press Release
- Industry Association
- Paid Database
- Investor Presentations

Step 4 - Data Triangulation
Involves using different sources of information in order to increase the validity of a study
These sources are likely to be stakeholders in a program - participants, other researchers, program staff, other community members, and so on.
Then we put all data in single framework & apply various statistical tools to find out the dynamic on the market.
During the analysis stage, feedback from the stakeholder groups would be compared to determine areas of agreement as well as areas of divergence


