

Key Insights
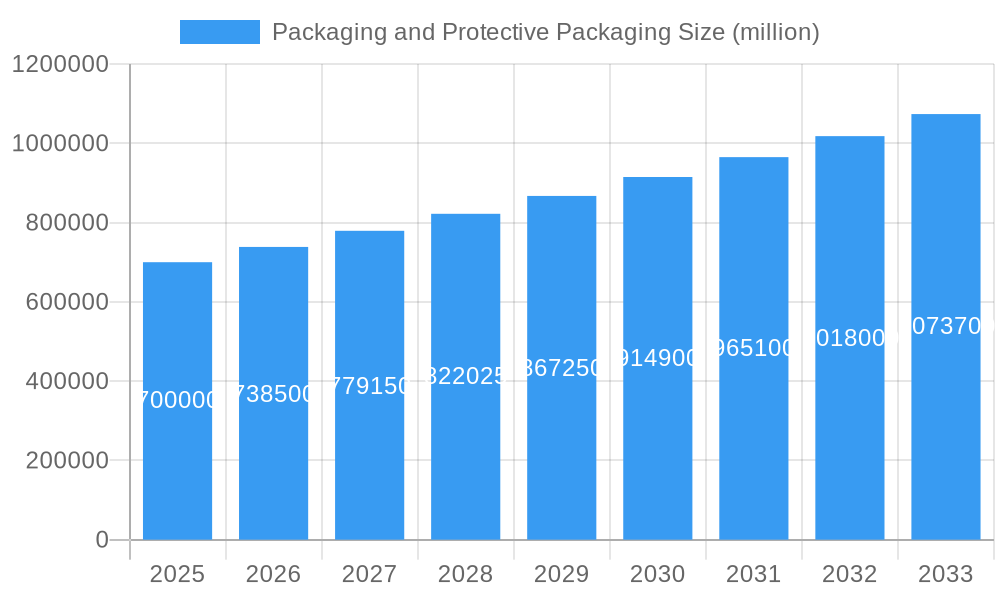
The global packaging and protective packaging market is set for substantial expansion, projected to reach an estimated USD 700 billion by 2025. The market anticipates a robust Compound Annual Growth Rate (CAGR) of approximately 4.6% throughout the forecast period of 2025-2033. Key growth drivers include the escalating demand from e-commerce, requiring secure and efficient shipping, and a growing consumer preference for sustainable and eco-friendly packaging materials. Innovations in biodegradable and recyclable alternatives are further stimulating market adoption. The healthcare sector's persistent need for sterile packaging for pharmaceuticals and medical devices, alongside the food and beverage industry's focus on shelf-life extension and product integrity, also significantly contribute to market growth. Emerging economies, particularly in the Asia Pacific region, present considerable potential due to rapid industrialization and an expanding middle class.
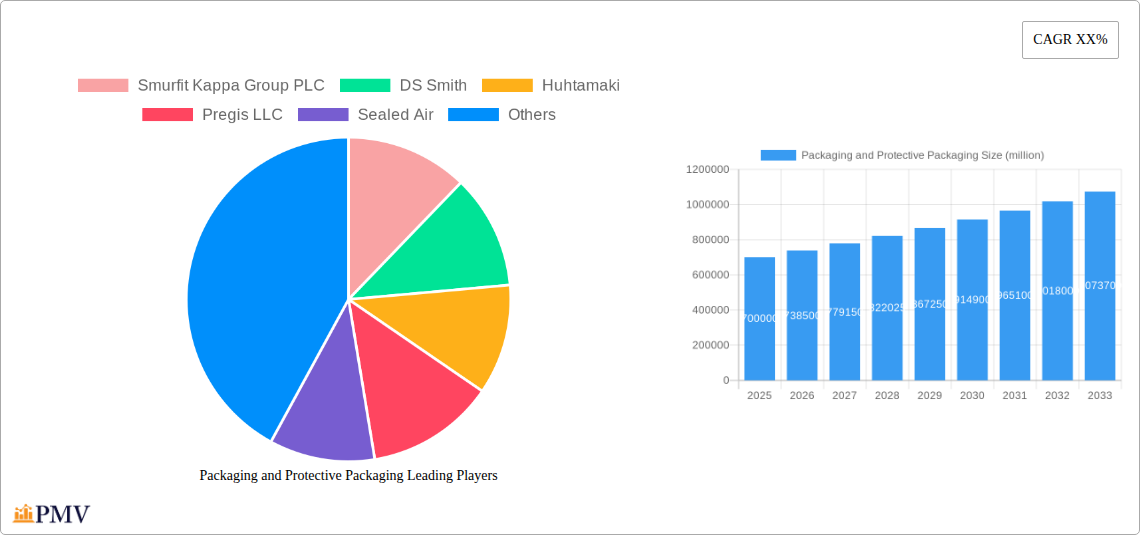
Packaging and Protective Packaging Market Size (In Billion)
Despite the positive outlook, the market faces challenges. Fluctuations in raw material prices, such as those for plastics and paper pulp, can impact profitability. Stringent regulations regarding packaging waste and recyclability, while promoting sustainability, may introduce compliance complexities and increase operational costs. High initial investment for advanced automated packaging machinery can also pose a barrier for smaller enterprises. However, the increasing demand for customized and specialized packaging solutions, coupled with advancements in smart packaging technologies for enhanced traceability, are expected to counterbalance these restraints, sustaining the market's upward trajectory. Leading companies like Amcor PLC, Smurfit Kappa Group PLC, and DS Smith are actively investing in research and development and strategic acquisitions to leverage these evolving market dynamics.
Packaging and Protective Packaging Company Market Share
This comprehensive market research report provides a definitive analysis of the global Packaging and Protective Packaging Market. It covers historical trends, current dynamics, and future projections, with a base year of 2025 and a forecast period from 2025 to 2033. The report offers critical insights for industry stakeholders navigating the evolving landscape of sustainable packaging solutions, e-commerce packaging, industrial protective packaging, and consumer goods packaging. The market size is estimated at 33.92 billion.
Packaging and Protective Packaging Market Structure & Competitive Dynamics
The global Packaging and Protective Packaging Market exhibits a moderately concentrated structure, with a few major players like Smurfit Kappa Group PLC, DS Smith, Huhtamaki, Pregis LLC, Sealed Air, Sonoco Products Company, Amcor PLC, Pro-Pac Packaging Limited, Storopack Hans Reichenecker, and International Paper holding significant market share. Innovation ecosystems are robust, driven by a demand for eco-friendly packaging, biodegradable packaging, and recyclable packaging materials. Regulatory frameworks worldwide are increasingly prioritizing sustainability, influencing material choices and design mandates. Product substitutes are emerging rapidly, particularly in the form of bio-based and compostable alternatives to traditional plastics. End-user trends are heavily influenced by the growth of e-commerce, leading to a surge in demand for optimized shipping packaging and transit packaging. Mergers and acquisitions (M&A) activities are prevalent, with an estimated M&A deal value exceeding one million in several instances, aimed at expanding geographical reach, enhancing technological capabilities, and consolidating market presence.
- Market Concentration: Dominated by a mix of large multinational corporations and specialized regional players.
- Innovation Ecosystems: Fueled by R&D in sustainable materials, smart packaging, and optimized designs.
- Regulatory Frameworks: Stringent environmental regulations are reshaping material choices and production processes.
- Product Substitutes: Growing availability of bio-plastics, compostable materials, and paper-based alternatives.
- End-User Trends: E-commerce boom driving demand for resilient and efficient packaging for direct-to-consumer shipments.
- M&A Activities: Strategic acquisitions to gain market share, access new technologies, and expand product portfolios.
Packaging and Protective Packaging Industry Trends & Insights
The Packaging and Protective Packaging Industry is experiencing robust growth, projected at a Compound Annual Growth Rate (CAGR) of approximately 6.5% during the forecast period. This expansion is primarily driven by the burgeoning global population, increasing disposable incomes, and the resultant surge in demand across various end-use industries, including food packaging, beverage packaging, healthcare packaging, and cosmetics packaging. The rapid adoption of e-commerce platforms has significantly amplified the need for reliable and cost-effective shipping and logistics packaging. Technological disruptions, such as the development of advanced cushioning materials, intelligent packaging systems, and automation in packaging processes, are revolutionizing operational efficiencies and product protection. Consumer preferences are shifting towards sustainable and ethical packaging, with a strong inclination towards brands that demonstrate environmental responsibility. This trend is compelling manufacturers to invest in recycled content packaging, minimalist packaging designs, and returnable packaging solutions. The competitive dynamics are intensifying, with companies differentiating themselves through innovation, sustainability initiatives, and supply chain resilience. Market penetration of specialized protective packaging solutions is increasing, particularly in sectors with fragile or high-value products. The ongoing shift towards custom packaging solutions to meet specific product needs and enhance brand appeal is a notable trend.
Dominant Markets & Segments in Packaging and Protective Packaging
The Paper and Paperboard segment is anticipated to continue its dominance in the Packaging and Protective Packaging Market, driven by its inherent recyclability, biodegradability, and versatility. Key drivers for this segment include increasing environmental consciousness, supportive government policies promoting paper-based products, and the growing demand for corrugated boxes and cardboard packaging in the e-commerce sector. The Food and Beverage application segment remains the largest consumer of packaging solutions, owing to the sheer volume of goods produced and distributed globally. The Healthcare sector presents a significant growth opportunity, fueled by the increasing demand for sterile, tamper-evident, and specialized packaging for pharmaceuticals and medical devices.
In terms of geographical dominance, Asia Pacific is projected to lead the market, propelled by rapid industrialization, a growing middle class, and expanding manufacturing bases in countries like China and India.
- Dominant Type: Paper and Paperboard, favored for its sustainability and versatility.
- Key Drivers: Environmental regulations, e-commerce growth, cost-effectiveness.
- Dominant Application: Food and Beverage, due to high consumption volumes and the need for product preservation.
- Key Drivers: Population growth, rising disposable incomes, evolving dietary habits.
- Dominant Region: Asia Pacific, driven by economic growth and manufacturing prowess.
- Key Drivers: Favorable economic policies, robust infrastructure development, expanding consumer base.
- Leading Segments in Protective Packaging:
- Foam Packaging: Essential for high-impact protection of electronics and fragile goods.
- Air Pillows and Bubble Wrap: Cost-effective and versatile solutions for void fill and cushioning.
- Emerging Segments: Biodegradable and compostable packaging materials are gaining traction across all application and type segments.
Packaging and Protective Packaging Product Innovations
Product innovations in the Packaging and Protective Packaging Market are largely centered on enhancing sustainability, functionality, and cost-efficiency. Companies are actively developing lightweight yet durable packaging materials, reducing material usage and transportation emissions. Advancements in bio-based polymers and compostable alternatives are providing viable substitutes for conventional plastics, addressing growing consumer and regulatory pressure. Smart packaging technologies, incorporating features like temperature monitoring, freshness indicators, and anti-counterfeiting measures, are gaining traction, particularly in the Healthcare and Food sectors. The development of customizable protective packaging solutions tailored to specific product dimensions and fragility is also a key trend, optimizing protection and minimizing waste.
Report Segmentation & Scope
This report segments the Packaging and Protective Packaging Market based on the following key criteria:
- Application:
- Food: High demand for preservation, barrier properties, and shelf-life extension. Projected market size exceeding 150,000 million by 2033.
- Beverage: Emphasis on structural integrity, spill prevention, and branding. Projected market size exceeding 90,000 million by 2033.
- Healthcare: Critical need for sterility, tamper-evidence, and protection for sensitive medical products. Projected market size exceeding 80,000 million by 2033.
- Cosmetics: Focus on aesthetics, product integrity, and brand appeal. Projected market size exceeding 50,000 million by 2033.
- Industrial: Requirement for robust protection of heavy-duty goods during transit and storage. Projected market size exceeding 120,000 million by 2033.
- Others: Encompassing a wide range of applications including electronics, textiles, and general retail.
- Types:
- Paper and Paperboard: Dominant segment driven by sustainability. Projected market size exceeding 200,000 million by 2033.
- Rigid Plastics: Used for durable goods and high-barrier applications. Projected market size exceeding 100,000 million by 2033.
- Flexible Packaging: Versatile for various consumer goods. Projected market size exceeding 130,000 million by 2033.
- Metal: Primarily for beverages and certain industrial applications.
- Glass: Used for premium food and beverage products.
- Others: Including innovative and emerging material types.
Key Drivers of Packaging and Protective Packaging Growth
The Packaging and Protective Packaging Market is propelled by several key drivers. The exponential growth of the e-commerce sector necessitates robust, efficient, and cost-effective shipping solutions. Increasing global population and rising disposable incomes translate to higher consumption of packaged goods across all sectors. A significant driver is the growing consumer and regulatory demand for sustainable packaging, leading to increased adoption of recycled, recyclable, and biodegradable materials. Technological advancements in material science and manufacturing processes enable the development of enhanced protective features and optimized packaging designs, reducing product damage and waste. Government initiatives promoting circular economy principles and imposing stricter regulations on single-use plastics further accelerate the shift towards eco-friendly packaging alternatives.
Challenges in the Packaging and Protective Packaging Sector
Despite robust growth, the Packaging and Protective Packaging Sector faces several challenges. Stringent and evolving environmental regulations can lead to increased compliance costs and the need for rapid adaptation of materials and processes. Volatility in raw material prices, particularly for paper pulp and polymers, can impact profitability. Supply chain disruptions, as witnessed in recent years, can affect the availability and timely delivery of packaging materials, leading to production delays. Intense competitive pressures and the need for continuous innovation to meet evolving customer demands and sustainability expectations can strain research and development budgets. The cost of transitioning to new sustainable materials and technologies can also be a significant barrier for some manufacturers.
Leading Players in the Packaging and Protective Packaging Market
- Smurfit Kappa Group PLC
- DS Smith
- Huhtamaki
- Pregis LLC
- Sealed Air
- Sonoco Products Company
- Amcor PLC
- Pro-Pac Packaging Limited
- Storopack Hans Reichenecker
- International Paper
Key Developments in Packaging and Protective Packaging Sector
- 2023/01: Smurfit Kappa Group PLC announces strategic investment in advanced recycling technology to enhance its sustainable packaging offerings.
- 2023/03: DS Smith launches a new range of innovative e-commerce packaging solutions designed for optimal product protection and reduced material usage.
- 2023/05: Pregis LLC acquires a leading manufacturer of biodegradable protective packaging, expanding its portfolio of eco-friendly options.
- 2023/07: Sealed Air introduces a new intelligent packaging system for healthcare applications, offering real-time temperature monitoring and data logging.
- 2024/01: Amcor PLC announces its commitment to achieving 100% recyclable or reusable packaging by 2025, driving innovation in flexible packaging.
- 2024/03: Sonoco Products Company expands its industrial protective packaging capacity to meet growing demand from the manufacturing sector.
Strategic Packaging and Protective Packaging Market Outlook
The Strategic Packaging and Protective Packaging Market Outlook is highly promising, driven by the sustained growth in e-commerce, increasing global demand for consumer goods, and a fundamental shift towards sustainable and circular economy principles. The market will witness continued innovation in material science, with an emphasis on bio-based, compostable, and easily recyclable materials. Companies that invest in developing and scaling these eco-friendly packaging solutions will gain a significant competitive advantage. The integration of smart technologies into packaging for enhanced traceability, product integrity, and consumer engagement will also be a key growth accelerator. Strategic partnerships and acquisitions will remain crucial for market players looking to expand their geographical footprint, enhance their product portfolios, and secure their supply chains in this dynamic and evolving industry. The increasing focus on waste reduction and responsible packaging will present substantial opportunities for agile and forward-thinking companies.
Packaging and Protective Packaging Segmentation
-
1. Application
- 1.1. Food
- 1.2. Beverage
- 1.3. Healthcare
- 1.4. Cosmetics
- 1.5. Industrial
- 1.6. Others
-
2. Types
- 2.1. Paper and Paperboard
- 2.2. Rigid Plastics
- 2.3. Flexible
- 2.4. Metal
- 2.5. Glass
- 2.6. Others
Packaging and Protective Packaging Segmentation By Geography
-
1. North America
- 1.1. United States
- 1.2. Canada
- 1.3. Mexico
-
2. South America
- 2.1. Brazil
- 2.2. Argentina
- 2.3. Rest of South America
-
3. Europe
- 3.1. United Kingdom
- 3.2. Germany
- 3.3. France
- 3.4. Italy
- 3.5. Spain
- 3.6. Russia
- 3.7. Benelux
- 3.8. Nordics
- 3.9. Rest of Europe
-
4. Middle East & Africa
- 4.1. Turkey
- 4.2. Israel
- 4.3. GCC
- 4.4. North Africa
- 4.5. South Africa
- 4.6. Rest of Middle East & Africa
-
5. Asia Pacific
- 5.1. China
- 5.2. India
- 5.3. Japan
- 5.4. South Korea
- 5.5. ASEAN
- 5.6. Oceania
- 5.7. Rest of Asia Pacific
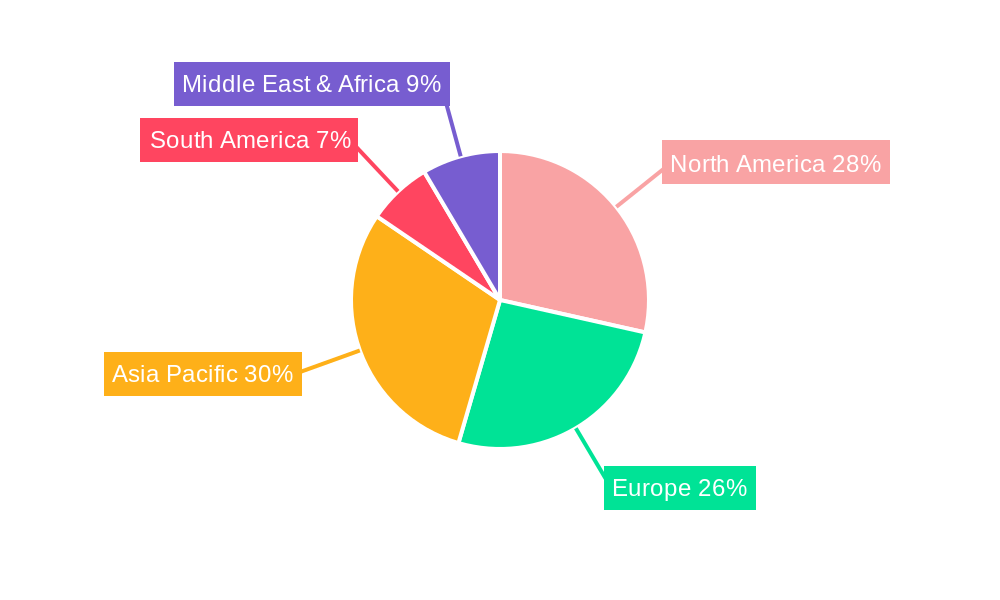
Packaging and Protective Packaging Regional Market Share
Geographic Coverage of Packaging and Protective Packaging
Packaging and Protective Packaging REPORT HIGHLIGHTS
| Aspects | Details |
|---|---|
| Study Period | 2020-2034 |
| Base Year | 2025 |
| Estimated Year | 2026 |
| Forecast Period | 2026-2034 |
| Historical Period | 2020-2025 |
| Growth Rate | CAGR of 4.6% from 2020-2034 |
| Segmentation |
|
Table of Contents
- 1. Introduction
- 1.1. Research Scope
- 1.2. Market Segmentation
- 1.3. Research Methodology
- 1.4. Definitions and Assumptions
- 2. Executive Summary
- 2.1. Introduction
- 3. Market Dynamics
- 3.1. Introduction
- 3.2. Market Drivers
- 3.3. Market Restrains
- 3.4. Market Trends
- 4. Market Factor Analysis
- 4.1. Porters Five Forces
- 4.2. Supply/Value Chain
- 4.3. PESTEL analysis
- 4.4. Market Entropy
- 4.5. Patent/Trademark Analysis
- 5. Global Packaging and Protective Packaging Analysis, Insights and Forecast, 2020-2032
- 5.1. Market Analysis, Insights and Forecast - by Application
- 5.1.1. Food
- 5.1.2. Beverage
- 5.1.3. Healthcare
- 5.1.4. Cosmetics
- 5.1.5. Industrial
- 5.1.6. Others
- 5.2. Market Analysis, Insights and Forecast - by Types
- 5.2.1. Paper and Paperboard
- 5.2.2. Rigid Plastics
- 5.2.3. Flexible
- 5.2.4. Metal
- 5.2.5. Glass
- 5.2.6. Others
- 5.3. Market Analysis, Insights and Forecast - by Region
- 5.3.1. North America
- 5.3.2. South America
- 5.3.3. Europe
- 5.3.4. Middle East & Africa
- 5.3.5. Asia Pacific
- 5.1. Market Analysis, Insights and Forecast - by Application
- 6. North America Packaging and Protective Packaging Analysis, Insights and Forecast, 2020-2032
- 6.1. Market Analysis, Insights and Forecast - by Application
- 6.1.1. Food
- 6.1.2. Beverage
- 6.1.3. Healthcare
- 6.1.4. Cosmetics
- 6.1.5. Industrial
- 6.1.6. Others
- 6.2. Market Analysis, Insights and Forecast - by Types
- 6.2.1. Paper and Paperboard
- 6.2.2. Rigid Plastics
- 6.2.3. Flexible
- 6.2.4. Metal
- 6.2.5. Glass
- 6.2.6. Others
- 6.1. Market Analysis, Insights and Forecast - by Application
- 7. South America Packaging and Protective Packaging Analysis, Insights and Forecast, 2020-2032
- 7.1. Market Analysis, Insights and Forecast - by Application
- 7.1.1. Food
- 7.1.2. Beverage
- 7.1.3. Healthcare
- 7.1.4. Cosmetics
- 7.1.5. Industrial
- 7.1.6. Others
- 7.2. Market Analysis, Insights and Forecast - by Types
- 7.2.1. Paper and Paperboard
- 7.2.2. Rigid Plastics
- 7.2.3. Flexible
- 7.2.4. Metal
- 7.2.5. Glass
- 7.2.6. Others
- 7.1. Market Analysis, Insights and Forecast - by Application
- 8. Europe Packaging and Protective Packaging Analysis, Insights and Forecast, 2020-2032
- 8.1. Market Analysis, Insights and Forecast - by Application
- 8.1.1. Food
- 8.1.2. Beverage
- 8.1.3. Healthcare
- 8.1.4. Cosmetics
- 8.1.5. Industrial
- 8.1.6. Others
- 8.2. Market Analysis, Insights and Forecast - by Types
- 8.2.1. Paper and Paperboard
- 8.2.2. Rigid Plastics
- 8.2.3. Flexible
- 8.2.4. Metal
- 8.2.5. Glass
- 8.2.6. Others
- 8.1. Market Analysis, Insights and Forecast - by Application
- 9. Middle East & Africa Packaging and Protective Packaging Analysis, Insights and Forecast, 2020-2032
- 9.1. Market Analysis, Insights and Forecast - by Application
- 9.1.1. Food
- 9.1.2. Beverage
- 9.1.3. Healthcare
- 9.1.4. Cosmetics
- 9.1.5. Industrial
- 9.1.6. Others
- 9.2. Market Analysis, Insights and Forecast - by Types
- 9.2.1. Paper and Paperboard
- 9.2.2. Rigid Plastics
- 9.2.3. Flexible
- 9.2.4. Metal
- 9.2.5. Glass
- 9.2.6. Others
- 9.1. Market Analysis, Insights and Forecast - by Application
- 10. Asia Pacific Packaging and Protective Packaging Analysis, Insights and Forecast, 2020-2032
- 10.1. Market Analysis, Insights and Forecast - by Application
- 10.1.1. Food
- 10.1.2. Beverage
- 10.1.3. Healthcare
- 10.1.4. Cosmetics
- 10.1.5. Industrial
- 10.1.6. Others
- 10.2. Market Analysis, Insights and Forecast - by Types
- 10.2.1. Paper and Paperboard
- 10.2.2. Rigid Plastics
- 10.2.3. Flexible
- 10.2.4. Metal
- 10.2.5. Glass
- 10.2.6. Others
- 10.1. Market Analysis, Insights and Forecast - by Application
- 11. Competitive Analysis
- 11.1. Global Market Share Analysis 2025
- 11.2. Company Profiles
- 11.2.1 Smurfit Kappa Group PLC
- 11.2.1.1. Overview
- 11.2.1.2. Products
- 11.2.1.3. SWOT Analysis
- 11.2.1.4. Recent Developments
- 11.2.1.5. Financials (Based on Availability)
- 11.2.2 DS Smith
- 11.2.2.1. Overview
- 11.2.2.2. Products
- 11.2.2.3. SWOT Analysis
- 11.2.2.4. Recent Developments
- 11.2.2.5. Financials (Based on Availability)
- 11.2.3 Huhtamaki
- 11.2.3.1. Overview
- 11.2.3.2. Products
- 11.2.3.3. SWOT Analysis
- 11.2.3.4. Recent Developments
- 11.2.3.5. Financials (Based on Availability)
- 11.2.4 Pregis LLC
- 11.2.4.1. Overview
- 11.2.4.2. Products
- 11.2.4.3. SWOT Analysis
- 11.2.4.4. Recent Developments
- 11.2.4.5. Financials (Based on Availability)
- 11.2.5 Sealed Air
- 11.2.5.1. Overview
- 11.2.5.2. Products
- 11.2.5.3. SWOT Analysis
- 11.2.5.4. Recent Developments
- 11.2.5.5. Financials (Based on Availability)
- 11.2.6 Sonoco Products Company
- 11.2.6.1. Overview
- 11.2.6.2. Products
- 11.2.6.3. SWOT Analysis
- 11.2.6.4. Recent Developments
- 11.2.6.5. Financials (Based on Availability)
- 11.2.7 Amcor PLC
- 11.2.7.1. Overview
- 11.2.7.2. Products
- 11.2.7.3. SWOT Analysis
- 11.2.7.4. Recent Developments
- 11.2.7.5. Financials (Based on Availability)
- 11.2.8 Pro-Pac Packaging Limited
- 11.2.8.1. Overview
- 11.2.8.2. Products
- 11.2.8.3. SWOT Analysis
- 11.2.8.4. Recent Developments
- 11.2.8.5. Financials (Based on Availability)
- 11.2.9 Storopack Hans Reichenecker
- 11.2.9.1. Overview
- 11.2.9.2. Products
- 11.2.9.3. SWOT Analysis
- 11.2.9.4. Recent Developments
- 11.2.9.5. Financials (Based on Availability)
- 11.2.10 International Paper
- 11.2.10.1. Overview
- 11.2.10.2. Products
- 11.2.10.3. SWOT Analysis
- 11.2.10.4. Recent Developments
- 11.2.10.5. Financials (Based on Availability)
- 11.2.1 Smurfit Kappa Group PLC
List of Figures
- Figure 1: Global Packaging and Protective Packaging Revenue Breakdown (billion, %) by Region 2025 & 2033
- Figure 2: North America Packaging and Protective Packaging Revenue (billion), by Application 2025 & 2033
- Figure 3: North America Packaging and Protective Packaging Revenue Share (%), by Application 2025 & 2033
- Figure 4: North America Packaging and Protective Packaging Revenue (billion), by Types 2025 & 2033
- Figure 5: North America Packaging and Protective Packaging Revenue Share (%), by Types 2025 & 2033
- Figure 6: North America Packaging and Protective Packaging Revenue (billion), by Country 2025 & 2033
- Figure 7: North America Packaging and Protective Packaging Revenue Share (%), by Country 2025 & 2033
- Figure 8: South America Packaging and Protective Packaging Revenue (billion), by Application 2025 & 2033
- Figure 9: South America Packaging and Protective Packaging Revenue Share (%), by Application 2025 & 2033
- Figure 10: South America Packaging and Protective Packaging Revenue (billion), by Types 2025 & 2033
- Figure 11: South America Packaging and Protective Packaging Revenue Share (%), by Types 2025 & 2033
- Figure 12: South America Packaging and Protective Packaging Revenue (billion), by Country 2025 & 2033
- Figure 13: South America Packaging and Protective Packaging Revenue Share (%), by Country 2025 & 2033
- Figure 14: Europe Packaging and Protective Packaging Revenue (billion), by Application 2025 & 2033
- Figure 15: Europe Packaging and Protective Packaging Revenue Share (%), by Application 2025 & 2033
- Figure 16: Europe Packaging and Protective Packaging Revenue (billion), by Types 2025 & 2033
- Figure 17: Europe Packaging and Protective Packaging Revenue Share (%), by Types 2025 & 2033
- Figure 18: Europe Packaging and Protective Packaging Revenue (billion), by Country 2025 & 2033
- Figure 19: Europe Packaging and Protective Packaging Revenue Share (%), by Country 2025 & 2033
- Figure 20: Middle East & Africa Packaging and Protective Packaging Revenue (billion), by Application 2025 & 2033
- Figure 21: Middle East & Africa Packaging and Protective Packaging Revenue Share (%), by Application 2025 & 2033
- Figure 22: Middle East & Africa Packaging and Protective Packaging Revenue (billion), by Types 2025 & 2033
- Figure 23: Middle East & Africa Packaging and Protective Packaging Revenue Share (%), by Types 2025 & 2033
- Figure 24: Middle East & Africa Packaging and Protective Packaging Revenue (billion), by Country 2025 & 2033
- Figure 25: Middle East & Africa Packaging and Protective Packaging Revenue Share (%), by Country 2025 & 2033
- Figure 26: Asia Pacific Packaging and Protective Packaging Revenue (billion), by Application 2025 & 2033
- Figure 27: Asia Pacific Packaging and Protective Packaging Revenue Share (%), by Application 2025 & 2033
- Figure 28: Asia Pacific Packaging and Protective Packaging Revenue (billion), by Types 2025 & 2033
- Figure 29: Asia Pacific Packaging and Protective Packaging Revenue Share (%), by Types 2025 & 2033
- Figure 30: Asia Pacific Packaging and Protective Packaging Revenue (billion), by Country 2025 & 2033
- Figure 31: Asia Pacific Packaging and Protective Packaging Revenue Share (%), by Country 2025 & 2033
List of Tables
- Table 1: Global Packaging and Protective Packaging Revenue billion Forecast, by Application 2020 & 2033
- Table 2: Global Packaging and Protective Packaging Revenue billion Forecast, by Types 2020 & 2033
- Table 3: Global Packaging and Protective Packaging Revenue billion Forecast, by Region 2020 & 2033
- Table 4: Global Packaging and Protective Packaging Revenue billion Forecast, by Application 2020 & 2033
- Table 5: Global Packaging and Protective Packaging Revenue billion Forecast, by Types 2020 & 2033
- Table 6: Global Packaging and Protective Packaging Revenue billion Forecast, by Country 2020 & 2033
- Table 7: United States Packaging and Protective Packaging Revenue (billion) Forecast, by Application 2020 & 2033
- Table 8: Canada Packaging and Protective Packaging Revenue (billion) Forecast, by Application 2020 & 2033
- Table 9: Mexico Packaging and Protective Packaging Revenue (billion) Forecast, by Application 2020 & 2033
- Table 10: Global Packaging and Protective Packaging Revenue billion Forecast, by Application 2020 & 2033
- Table 11: Global Packaging and Protective Packaging Revenue billion Forecast, by Types 2020 & 2033
- Table 12: Global Packaging and Protective Packaging Revenue billion Forecast, by Country 2020 & 2033
- Table 13: Brazil Packaging and Protective Packaging Revenue (billion) Forecast, by Application 2020 & 2033
- Table 14: Argentina Packaging and Protective Packaging Revenue (billion) Forecast, by Application 2020 & 2033
- Table 15: Rest of South America Packaging and Protective Packaging Revenue (billion) Forecast, by Application 2020 & 2033
- Table 16: Global Packaging and Protective Packaging Revenue billion Forecast, by Application 2020 & 2033
- Table 17: Global Packaging and Protective Packaging Revenue billion Forecast, by Types 2020 & 2033
- Table 18: Global Packaging and Protective Packaging Revenue billion Forecast, by Country 2020 & 2033
- Table 19: United Kingdom Packaging and Protective Packaging Revenue (billion) Forecast, by Application 2020 & 2033
- Table 20: Germany Packaging and Protective Packaging Revenue (billion) Forecast, by Application 2020 & 2033
- Table 21: France Packaging and Protective Packaging Revenue (billion) Forecast, by Application 2020 & 2033
- Table 22: Italy Packaging and Protective Packaging Revenue (billion) Forecast, by Application 2020 & 2033
- Table 23: Spain Packaging and Protective Packaging Revenue (billion) Forecast, by Application 2020 & 2033
- Table 24: Russia Packaging and Protective Packaging Revenue (billion) Forecast, by Application 2020 & 2033
- Table 25: Benelux Packaging and Protective Packaging Revenue (billion) Forecast, by Application 2020 & 2033
- Table 26: Nordics Packaging and Protective Packaging Revenue (billion) Forecast, by Application 2020 & 2033
- Table 27: Rest of Europe Packaging and Protective Packaging Revenue (billion) Forecast, by Application 2020 & 2033
- Table 28: Global Packaging and Protective Packaging Revenue billion Forecast, by Application 2020 & 2033
- Table 29: Global Packaging and Protective Packaging Revenue billion Forecast, by Types 2020 & 2033
- Table 30: Global Packaging and Protective Packaging Revenue billion Forecast, by Country 2020 & 2033
- Table 31: Turkey Packaging and Protective Packaging Revenue (billion) Forecast, by Application 2020 & 2033
- Table 32: Israel Packaging and Protective Packaging Revenue (billion) Forecast, by Application 2020 & 2033
- Table 33: GCC Packaging and Protective Packaging Revenue (billion) Forecast, by Application 2020 & 2033
- Table 34: North Africa Packaging and Protective Packaging Revenue (billion) Forecast, by Application 2020 & 2033
- Table 35: South Africa Packaging and Protective Packaging Revenue (billion) Forecast, by Application 2020 & 2033
- Table 36: Rest of Middle East & Africa Packaging and Protective Packaging Revenue (billion) Forecast, by Application 2020 & 2033
- Table 37: Global Packaging and Protective Packaging Revenue billion Forecast, by Application 2020 & 2033
- Table 38: Global Packaging and Protective Packaging Revenue billion Forecast, by Types 2020 & 2033
- Table 39: Global Packaging and Protective Packaging Revenue billion Forecast, by Country 2020 & 2033
- Table 40: China Packaging and Protective Packaging Revenue (billion) Forecast, by Application 2020 & 2033
- Table 41: India Packaging and Protective Packaging Revenue (billion) Forecast, by Application 2020 & 2033
- Table 42: Japan Packaging and Protective Packaging Revenue (billion) Forecast, by Application 2020 & 2033
- Table 43: South Korea Packaging and Protective Packaging Revenue (billion) Forecast, by Application 2020 & 2033
- Table 44: ASEAN Packaging and Protective Packaging Revenue (billion) Forecast, by Application 2020 & 2033
- Table 45: Oceania Packaging and Protective Packaging Revenue (billion) Forecast, by Application 2020 & 2033
- Table 46: Rest of Asia Pacific Packaging and Protective Packaging Revenue (billion) Forecast, by Application 2020 & 2033
Frequently Asked Questions
1. What is the projected Compound Annual Growth Rate (CAGR) of the Packaging and Protective Packaging?
The projected CAGR is approximately 4.6%.
2. Which companies are prominent players in the Packaging and Protective Packaging?
Key companies in the market include Smurfit Kappa Group PLC, DS Smith, Huhtamaki, Pregis LLC, Sealed Air, Sonoco Products Company, Amcor PLC, Pro-Pac Packaging Limited, Storopack Hans Reichenecker, International Paper.
3. What are the main segments of the Packaging and Protective Packaging?
The market segments include Application, Types.
4. Can you provide details about the market size?
The market size is estimated to be USD 33.92 billion as of 2022.
5. What are some drivers contributing to market growth?
N/A
6. What are the notable trends driving market growth?
N/A
7. Are there any restraints impacting market growth?
N/A
8. Can you provide examples of recent developments in the market?
N/A
9. What pricing options are available for accessing the report?
Pricing options include single-user, multi-user, and enterprise licenses priced at USD 2900.00, USD 4350.00, and USD 5800.00 respectively.
10. Is the market size provided in terms of value or volume?
The market size is provided in terms of value, measured in billion.
11. Are there any specific market keywords associated with the report?
Yes, the market keyword associated with the report is "Packaging and Protective Packaging," which aids in identifying and referencing the specific market segment covered.
12. How do I determine which pricing option suits my needs best?
The pricing options vary based on user requirements and access needs. Individual users may opt for single-user licenses, while businesses requiring broader access may choose multi-user or enterprise licenses for cost-effective access to the report.
13. Are there any additional resources or data provided in the Packaging and Protective Packaging report?
While the report offers comprehensive insights, it's advisable to review the specific contents or supplementary materials provided to ascertain if additional resources or data are available.
14. How can I stay updated on further developments or reports in the Packaging and Protective Packaging?
To stay informed about further developments, trends, and reports in the Packaging and Protective Packaging, consider subscribing to industry newsletters, following relevant companies and organizations, or regularly checking reputable industry news sources and publications.
Methodology
Step 1 - Identification of Relevant Samples Size from Population Database


Step 2 - Approaches for Defining Global Market Size (Value, Volume* & Price*)

Note*: In applicable scenarios
Step 3 - Data Sources
Primary Research
- Web Analytics
- Survey Reports
- Research Institute
- Latest Research Reports
- Opinion Leaders
Secondary Research
- Annual Reports
- White Paper
- Latest Press Release
- Industry Association
- Paid Database
- Investor Presentations

Step 4 - Data Triangulation
Involves using different sources of information in order to increase the validity of a study
These sources are likely to be stakeholders in a program - participants, other researchers, program staff, other community members, and so on.
Then we put all data in single framework & apply various statistical tools to find out the dynamic on the market.
During the analysis stage, feedback from the stakeholder groups would be compared to determine areas of agreement as well as areas of divergence