

Key Insights
The organic coffee market, valued at approximately $5.24 billion in 2025, is poised for substantial expansion. Projections indicate a Compound Annual Growth Rate (CAGR) of 8.8% from 2025 to 2033. Key growth drivers include heightened consumer consciousness regarding health, wellness, and ethical sourcing, alongside the escalating popularity of specialty coffee with diverse roast profiles and brewing methods. Demand for organic coffee is further propelled by a preference for pesticide-free and healthier beverage options. Distribution channels are diversifying, with supermarkets and hypermarkets maintaining dominance, while convenience and specialty stores witness increased sales, aligning with evolving consumer habits. Market segmentation by origin, primarily Arabica and Robusta, reflects varied consumer preferences impacting pricing and demand, with Arabica beans generally holding a larger market share due to their superior taste.
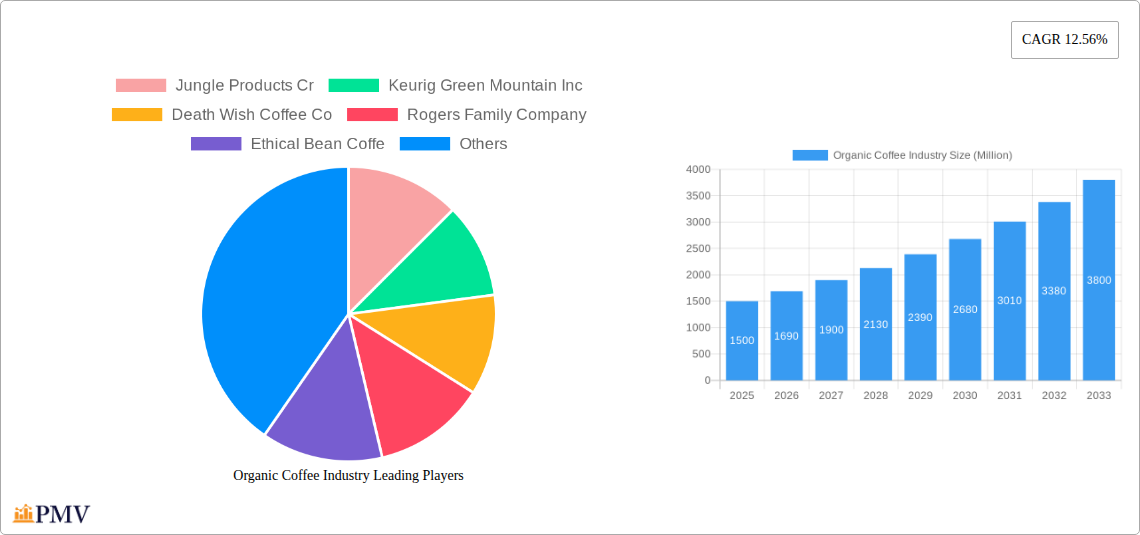
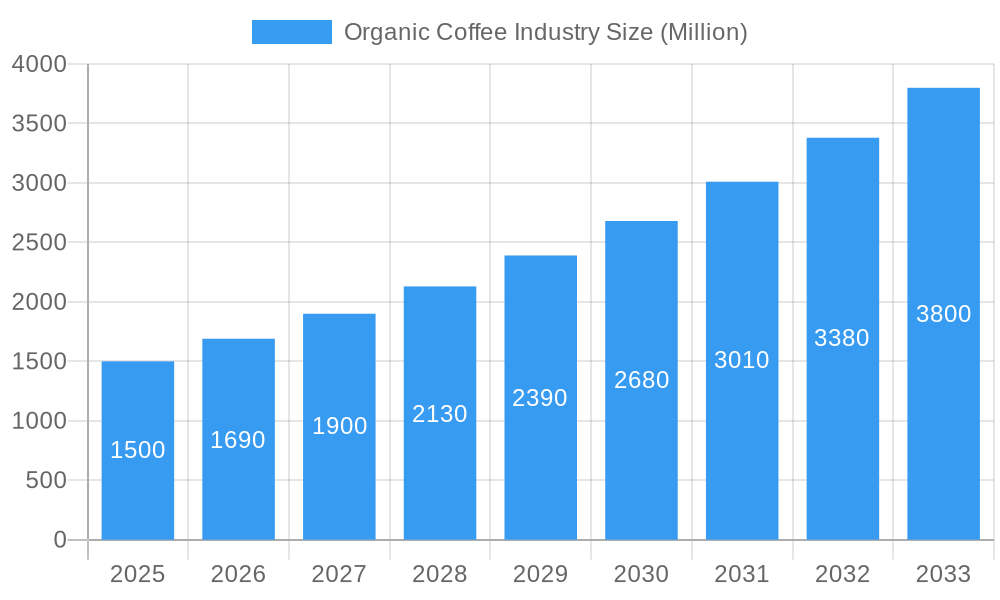
Organic Coffee Industry Market Size (In Billion)
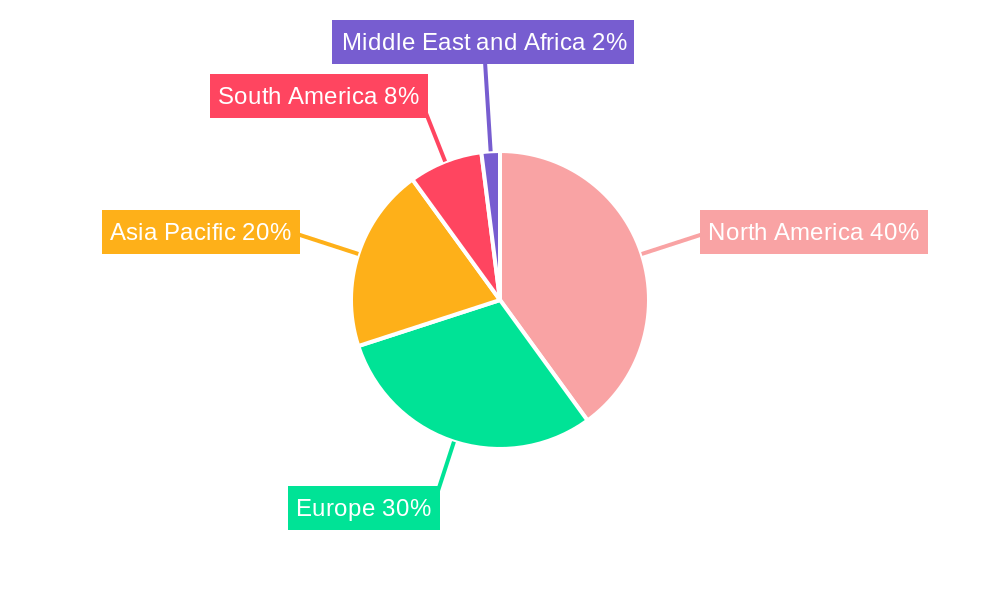
Geographically, North America, Europe, and Asia Pacific represent robust markets. North America, led by the US and Canada, benefits from high disposable incomes and a strong demand for premium coffee. Europe's established coffee culture significantly contributes to market size. The Asia Pacific region presents substantial growth potential, driven by rising middle-class incomes and evolving lifestyles in nations like China and India. South America, a major coffee producer, exhibits a strong domestic market and export capabilities. The competitive landscape is dynamic, featuring established brands and specialized roasters. Future market success will depend on sustained sustainable sourcing, expansion into emerging markets, and innovation in products and brewing technologies to meet evolving consumer demands.
Organic Coffee Industry Company Market Share
Organic Coffee Industry: A Comprehensive Market Report (2019-2033)
This comprehensive report provides an in-depth analysis of the global organic coffee industry, offering valuable insights for businesses, investors, and stakeholders seeking to navigate this dynamic market. The report covers the period from 2019 to 2033, with a focus on the estimated year 2025 and a forecast period spanning 2025-2033. The study delves into market size, segmentation, competitive dynamics, and future growth potential, providing actionable intelligence to drive informed decision-making. The market value is projected to reach xx Million by 2033.
Organic Coffee Industry Market Structure & Competitive Dynamics
This section analyzes the competitive landscape of the organic coffee industry, encompassing market concentration, innovation ecosystems, regulatory frameworks, product substitutes, end-user trends, and mergers and acquisitions (M&A) activities. The industry exhibits a moderately concentrated structure, with key players like Keurig Green Mountain Inc. and others holding significant market shares. However, the presence of numerous smaller, specialized roasters and brands indicates a competitive landscape with opportunities for niche players. Innovation is driven by factors such as sustainable sourcing practices, unique roasting techniques, and the development of innovative product formats (e.g., single-serve pods, ready-to-drink options). Regulatory frameworks, particularly those related to organic certification and labeling, play a crucial role in shaping the market. The increasing popularity of plant-based alternatives and other hot beverages represents a significant competitive pressure. M&A activity in the sector has been moderate, with deal values ranging from xx Million to xx Million in recent years.
- Market Concentration: Moderately concentrated, with leading players holding approximately xx% of market share.
- Innovation Ecosystems: Focused on sustainable sourcing, unique roasting profiles, and convenient packaging formats.
- Regulatory Frameworks: Stringent regulations concerning organic certification and labeling impact market dynamics.
- Product Substitutes: Plant-based beverages and other hot drinks pose a competitive threat.
- M&A Activity: Moderate activity observed, with deal values ranging from xx Million to xx Million.
Organic Coffee Industry Industry Trends & Insights
The organic coffee market is experiencing robust growth, driven by factors such as increasing consumer awareness of health and wellness, a growing preference for ethically sourced products, and rising disposable incomes in developing economies. The industry's Compound Annual Growth Rate (CAGR) during the historical period (2019-2024) was xx%, and is projected to be xx% during the forecast period (2025-2033). Technological advancements, such as improved roasting techniques and automation in production, enhance efficiency and product quality. Consumer preferences are shifting towards single-origin coffees, specialty blends, and convenient packaging options. Competitive dynamics are characterized by both intense competition among established players and the emergence of new, innovative brands. Market penetration of organic coffee is steadily increasing, reaching approximately xx% in 2025, driven by increasing consumer demand.
Dominant Markets & Segments in Organic Coffee Industry
The North American market currently dominates the organic coffee industry, driven by high consumer demand, strong regulatory frameworks supporting organic agriculture, and well-established distribution channels. Within the segment breakdown:
- By Origin: Arabica coffee dominates due to its superior flavor profile and higher market acceptance. Robusta holds a smaller but growing market share, primarily driven by its cost-effectiveness and stronger caffeine content.
- By Distribution Channel: Supermarkets and hypermarkets constitute the largest distribution channel, followed by specialty stores catering to consumers seeking premium organic coffee. Convenience stores represent a growing market segment.
- By Roast: Medium roast remains the most popular among consumers; however, demand for both light and dark roasts is experiencing growth.
Key Drivers of Regional Dominance (North America):
- Strong consumer preference for organic and ethically sourced products.
- High disposable incomes and consumer spending power.
- Well-established distribution networks and retail infrastructure.
- Favorable regulatory environment supporting organic farming.
The dominance of Arabica is due to its superior flavor profile, while the supermarket/hypermarket channel is dominant due to its widespread accessibility.
Organic Coffee Industry Product Innovations
Recent product innovations in the organic coffee industry include single-serve pods designed for convenience, ready-to-drink organic coffee options, and the growing availability of sustainably sourced, direct-trade coffees. Technological advancements in roasting and extraction techniques are improving both flavor and consistency. These innovations cater to the changing consumer preferences and demands for convenience and sustainability, providing key competitive advantages in the market.
Report Segmentation & Scope
This report segments the organic coffee market by:
Origin: Arabica and Robusta, analyzing the market size, growth projections, and competitive dynamics within each segment. Arabica is projected to dominate with xx Million in revenue by 2033, while Robusta is expected to reach xx Million.
Distribution Channel: Supermarkets & Hypermarkets (xx Million in 2033), Convenience Stores (xx Million), Specialty Stores (xx Million), and Other Channels (xx Million), providing insight into the unique characteristics of each channel and their respective growth trajectories.
Roast: Light, Medium, and Dark roasts, analyzing consumer preferences and market trends within each category. Medium roast is projected to maintain its market dominance, followed by dark and light roasts.
Key Drivers of Organic Coffee Industry Growth
The organic coffee industry's growth is propelled by several key factors: increasing health consciousness, growing demand for ethically sourced products, rising disposable incomes, technological advancements in processing and packaging, and supportive government policies promoting sustainable agriculture. The increasing availability of convenient formats, like single-serve pods, further fuels market expansion.
Challenges in the Organic Coffee Industry Sector
Challenges confronting the organic coffee industry include volatile commodity prices, fluctuations in supply due to climatic conditions, stringent organic certification requirements, and intense competition from conventional coffee brands. Maintaining consistent supply chain transparency and addressing consumer concerns about sustainability remain crucial. The increased cost of organic farming compared to conventional methods also presents a challenge.
Leading Players in the Organic Coffee Industry Market
- Keurig Green Mountain Inc.
- Death Wish Coffee Co
- Ethical Bean Coffee
- Allegro Coffee Company
- Jungle Products Cr
- Rogers Family Company
- Camano Island Coffee Roasters Llc
- Dean's Beans Organic Coffee
- Burke Brands Llc
Key Developments in Organic Coffee Industry Sector
- 2022 Q3: Keurig Green Mountain Inc. launched a new line of organic single-serve pods.
- 2023 Q1: Death Wish Coffee Co. partnered with a sustainable farming cooperative in South America.
- 2024 Q4: Allegro Coffee Company secured a large contract with a major supermarket chain.
- (Further key developments will be included in the full report)
Strategic Organic Coffee Industry Market Outlook
The organic coffee market presents significant growth opportunities, driven by evolving consumer preferences and a growing focus on sustainability. Strategic investments in sustainable sourcing practices, product innovation, and effective marketing campaigns will be crucial for success. Expansion into emerging markets and leveraging digital channels will be key to achieving continued growth in the coming years.
Organic Coffee Industry Segmentation
-
1. Roast
- 1.1. Light
- 1.2. Medium
- 1.3. Dark
-
2. Origin
- 2.1. Arabica
- 2.2. Robusta
-
3. Distribution Channel
- 3.1. Supermarkets and Hypermarkets
- 3.2. Convenience Stores
- 3.3. Specialty Stores
- 3.4. Other Channels
Organic Coffee Industry Segmentation By Geography
-
1. North America
- 1.1. United States
- 1.2. Canada
- 1.3. Mexico
- 1.4. Rest of North America
-
2. Europe
- 2.1. Spain
- 2.2. United Kingdom
- 2.3. Germany
- 2.4. France
- 2.5. Italy
- 2.6. Russia
- 2.7. Rest of Europe
-
3. Asia Pacific
- 3.1. China
- 3.2. Japan
- 3.3. India
- 3.4. Australia
- 3.5. Rest of Asia Pacific
-
4. South America
- 4.1. Brazil
- 4.2. Argentina
- 4.3. Rest of South America
-
5. Middle East and Africa
- 5.1. South Africa
- 5.2. Saudi Arabia
- 5.3. Rest of Middle East and Africa
Organic Coffee Industry Regional Market Share
Geographic Coverage of Organic Coffee Industry
Organic Coffee Industry REPORT HIGHLIGHTS
| Aspects | Details |
|---|---|
| Study Period | 2020-2034 |
| Base Year | 2025 |
| Estimated Year | 2026 |
| Forecast Period | 2026-2034 |
| Historical Period | 2020-2025 |
| Growth Rate | CAGR of 8.8% from 2020-2034 |
| Segmentation |
|
Table of Contents
- 1. Introduction
- 1.1. Research Scope
- 1.2. Market Segmentation
- 1.3. Research Objective
- 1.4. Definitions and Assumptions
- 2. Executive Summary
- 2.1. Market Snapshot
- 3. Market Dynamics
- 3.1. Market Drivers
- 3.2. Market Restrains
- 3.3. Market Trends
- 3.4. Market Opportunities
- 4. Market Factor Analysis
- 4.1. Porters Five Forces
- 4.1.1. Bargaining Power of Suppliers
- 4.1.2. Bargaining Power of Buyers
- 4.1.3. Threat of New Entrants
- 4.1.4. Threat of Substitutes
- 4.1.5. Competitive Rivalry
- 4.2. PESTEL analysis
- 4.3. BCG Analysis
- 4.3.1. Stars (High Growth, High Market Share)
- 4.3.2. Cash Cows (Low Growth, High Market Share)
- 4.3.3. Question Mark (High Growth, Low Market Share)
- 4.3.4. Dogs (Low Growth, Low Market Share)
- 4.4. Ansoff Matrix Analysis
- 4.5. Supply Chain Analysis
- 4.6. Regulatory Landscape
- 4.7. Current Market Potential and Opportunity Assessment (TAM–SAM–SOM Framework)
- 4.8. PMV Analyst Note
- 4.1. Porters Five Forces
- 5. Market Analysis, Insights and Forecast 2021-2033
- 5.1. Market Analysis, Insights and Forecast - by Roast
- 5.1.1. Light
- 5.1.2. Medium
- 5.1.3. Dark
- 5.2. Market Analysis, Insights and Forecast - by Origin
- 5.2.1. Arabica
- 5.2.2. Robusta
- 5.3. Market Analysis, Insights and Forecast - by Distribution Channel
- 5.3.1. Supermarkets and Hypermarkets
- 5.3.2. Convenience Stores
- 5.3.3. Specialty Stores
- 5.3.4. Other Channels
- 5.4. Market Analysis, Insights and Forecast - by Region
- 5.4.1. North America
- 5.4.2. Europe
- 5.4.3. Asia Pacific
- 5.4.4. South America
- 5.4.5. Middle East and Africa
- 5.1. Market Analysis, Insights and Forecast - by Roast
- 6. Global Organic Coffee Industry Analysis, Insights and Forecast, 2021-2033
- 6.1. Market Analysis, Insights and Forecast - by Roast
- 6.1.1. Light
- 6.1.2. Medium
- 6.1.3. Dark
- 6.2. Market Analysis, Insights and Forecast - by Origin
- 6.2.1. Arabica
- 6.2.2. Robusta
- 6.3. Market Analysis, Insights and Forecast - by Distribution Channel
- 6.3.1. Supermarkets and Hypermarkets
- 6.3.2. Convenience Stores
- 6.3.3. Specialty Stores
- 6.3.4. Other Channels
- 6.1. Market Analysis, Insights and Forecast - by Roast
- 7. North America Organic Coffee Industry Analysis, Insights and Forecast, 2020-2032
- 7.1. Market Analysis, Insights and Forecast - by Roast
- 7.1.1. Light
- 7.1.2. Medium
- 7.1.3. Dark
- 7.2. Market Analysis, Insights and Forecast - by Origin
- 7.2.1. Arabica
- 7.2.2. Robusta
- 7.3. Market Analysis, Insights and Forecast - by Distribution Channel
- 7.3.1. Supermarkets and Hypermarkets
- 7.3.2. Convenience Stores
- 7.3.3. Specialty Stores
- 7.3.4. Other Channels
- 7.1. Market Analysis, Insights and Forecast - by Roast
- 8. Europe Organic Coffee Industry Analysis, Insights and Forecast, 2020-2032
- 8.1. Market Analysis, Insights and Forecast - by Roast
- 8.1.1. Light
- 8.1.2. Medium
- 8.1.3. Dark
- 8.2. Market Analysis, Insights and Forecast - by Origin
- 8.2.1. Arabica
- 8.2.2. Robusta
- 8.3. Market Analysis, Insights and Forecast - by Distribution Channel
- 8.3.1. Supermarkets and Hypermarkets
- 8.3.2. Convenience Stores
- 8.3.3. Specialty Stores
- 8.3.4. Other Channels
- 8.1. Market Analysis, Insights and Forecast - by Roast
- 9. Asia Pacific Organic Coffee Industry Analysis, Insights and Forecast, 2020-2032
- 9.1. Market Analysis, Insights and Forecast - by Roast
- 9.1.1. Light
- 9.1.2. Medium
- 9.1.3. Dark
- 9.2. Market Analysis, Insights and Forecast - by Origin
- 9.2.1. Arabica
- 9.2.2. Robusta
- 9.3. Market Analysis, Insights and Forecast - by Distribution Channel
- 9.3.1. Supermarkets and Hypermarkets
- 9.3.2. Convenience Stores
- 9.3.3. Specialty Stores
- 9.3.4. Other Channels
- 9.1. Market Analysis, Insights and Forecast - by Roast
- 10. South America Organic Coffee Industry Analysis, Insights and Forecast, 2020-2032
- 10.1. Market Analysis, Insights and Forecast - by Roast
- 10.1.1. Light
- 10.1.2. Medium
- 10.1.3. Dark
- 10.2. Market Analysis, Insights and Forecast - by Origin
- 10.2.1. Arabica
- 10.2.2. Robusta
- 10.3. Market Analysis, Insights and Forecast - by Distribution Channel
- 10.3.1. Supermarkets and Hypermarkets
- 10.3.2. Convenience Stores
- 10.3.3. Specialty Stores
- 10.3.4. Other Channels
- 10.1. Market Analysis, Insights and Forecast - by Roast
- 11. Middle East and Africa Organic Coffee Industry Analysis, Insights and Forecast, 2020-2032
- 11.1. Market Analysis, Insights and Forecast - by Roast
- 11.1.1. Light
- 11.1.2. Medium
- 11.1.3. Dark
- 11.2. Market Analysis, Insights and Forecast - by Origin
- 11.2.1. Arabica
- 11.2.2. Robusta
- 11.3. Market Analysis, Insights and Forecast - by Distribution Channel
- 11.3.1. Supermarkets and Hypermarkets
- 11.3.2. Convenience Stores
- 11.3.3. Specialty Stores
- 11.3.4. Other Channels
- 11.1. Market Analysis, Insights and Forecast - by Roast
- 12. Competitive Analysis
- 12.1. Company Profiles
- 12.1.1 Jungle Products Cr
- 12.1.1.1. Company Overview
- 12.1.1.2. Products
- 12.1.1.3. Company Financials
- 12.1.1.4. SWOT Analysis
- 12.1.2 Keurig Green Mountain Inc
- 12.1.2.1. Company Overview
- 12.1.2.2. Products
- 12.1.2.3. Company Financials
- 12.1.2.4. SWOT Analysis
- 12.1.3 Death Wish Coffee Co
- 12.1.3.1. Company Overview
- 12.1.3.2. Products
- 12.1.3.3. Company Financials
- 12.1.3.4. SWOT Analysis
- 12.1.4 Rogers Family Company
- 12.1.4.1. Company Overview
- 12.1.4.2. Products
- 12.1.4.3. Company Financials
- 12.1.4.4. SWOT Analysis
- 12.1.5 Ethical Bean Coffe
- 12.1.5.1. Company Overview
- 12.1.5.2. Products
- 12.1.5.3. Company Financials
- 12.1.5.4. SWOT Analysis
- 12.1.6 Allegro Coffee Company
- 12.1.6.1. Company Overview
- 12.1.6.2. Products
- 12.1.6.3. Company Financials
- 12.1.6.4. SWOT Analysis
- 12.1.7 Camano Island Coffee Roasters Llc
- 12.1.7.1. Company Overview
- 12.1.7.2. Products
- 12.1.7.3. Company Financials
- 12.1.7.4. SWOT Analysis
- 12.1.8 Dean's Beans Organic Coffee
- 12.1.8.1. Company Overview
- 12.1.8.2. Products
- 12.1.8.3. Company Financials
- 12.1.8.4. SWOT Analysis
- 12.1.9 Burke Brands Llc
- 12.1.9.1. Company Overview
- 12.1.9.2. Products
- 12.1.9.3. Company Financials
- 12.1.9.4. SWOT Analysis
- 12.1.1 Jungle Products Cr
- 12.2. Market Entropy
- 12.2.1 Company's Key Areas Served
- 12.2.2 Recent Developments
- 12.3. Company Market Share Analysis 2025
- 12.3.1 Top 5 Companies Market Share Analysis
- 12.3.2 Top 3 Companies Market Share Analysis
- 12.4. List of Potential Customers
- 13. Research Methodology
List of Figures
- Figure 1: Global Organic Coffee Industry Revenue Breakdown (billion, %) by Region 2025 & 2033
- Figure 2: North America Organic Coffee Industry Revenue (billion), by Roast 2025 & 2033
- Figure 3: North America Organic Coffee Industry Revenue Share (%), by Roast 2025 & 2033
- Figure 4: North America Organic Coffee Industry Revenue (billion), by Origin 2025 & 2033
- Figure 5: North America Organic Coffee Industry Revenue Share (%), by Origin 2025 & 2033
- Figure 6: North America Organic Coffee Industry Revenue (billion), by Distribution Channel 2025 & 2033
- Figure 7: North America Organic Coffee Industry Revenue Share (%), by Distribution Channel 2025 & 2033
- Figure 8: North America Organic Coffee Industry Revenue (billion), by Country 2025 & 2033
- Figure 9: North America Organic Coffee Industry Revenue Share (%), by Country 2025 & 2033
- Figure 10: Europe Organic Coffee Industry Revenue (billion), by Roast 2025 & 2033
- Figure 11: Europe Organic Coffee Industry Revenue Share (%), by Roast 2025 & 2033
- Figure 12: Europe Organic Coffee Industry Revenue (billion), by Origin 2025 & 2033
- Figure 13: Europe Organic Coffee Industry Revenue Share (%), by Origin 2025 & 2033
- Figure 14: Europe Organic Coffee Industry Revenue (billion), by Distribution Channel 2025 & 2033
- Figure 15: Europe Organic Coffee Industry Revenue Share (%), by Distribution Channel 2025 & 2033
- Figure 16: Europe Organic Coffee Industry Revenue (billion), by Country 2025 & 2033
- Figure 17: Europe Organic Coffee Industry Revenue Share (%), by Country 2025 & 2033
- Figure 18: Asia Pacific Organic Coffee Industry Revenue (billion), by Roast 2025 & 2033
- Figure 19: Asia Pacific Organic Coffee Industry Revenue Share (%), by Roast 2025 & 2033
- Figure 20: Asia Pacific Organic Coffee Industry Revenue (billion), by Origin 2025 & 2033
- Figure 21: Asia Pacific Organic Coffee Industry Revenue Share (%), by Origin 2025 & 2033
- Figure 22: Asia Pacific Organic Coffee Industry Revenue (billion), by Distribution Channel 2025 & 2033
- Figure 23: Asia Pacific Organic Coffee Industry Revenue Share (%), by Distribution Channel 2025 & 2033
- Figure 24: Asia Pacific Organic Coffee Industry Revenue (billion), by Country 2025 & 2033
- Figure 25: Asia Pacific Organic Coffee Industry Revenue Share (%), by Country 2025 & 2033
- Figure 26: South America Organic Coffee Industry Revenue (billion), by Roast 2025 & 2033
- Figure 27: South America Organic Coffee Industry Revenue Share (%), by Roast 2025 & 2033
- Figure 28: South America Organic Coffee Industry Revenue (billion), by Origin 2025 & 2033
- Figure 29: South America Organic Coffee Industry Revenue Share (%), by Origin 2025 & 2033
- Figure 30: South America Organic Coffee Industry Revenue (billion), by Distribution Channel 2025 & 2033
- Figure 31: South America Organic Coffee Industry Revenue Share (%), by Distribution Channel 2025 & 2033
- Figure 32: South America Organic Coffee Industry Revenue (billion), by Country 2025 & 2033
- Figure 33: South America Organic Coffee Industry Revenue Share (%), by Country 2025 & 2033
- Figure 34: Middle East and Africa Organic Coffee Industry Revenue (billion), by Roast 2025 & 2033
- Figure 35: Middle East and Africa Organic Coffee Industry Revenue Share (%), by Roast 2025 & 2033
- Figure 36: Middle East and Africa Organic Coffee Industry Revenue (billion), by Origin 2025 & 2033
- Figure 37: Middle East and Africa Organic Coffee Industry Revenue Share (%), by Origin 2025 & 2033
- Figure 38: Middle East and Africa Organic Coffee Industry Revenue (billion), by Distribution Channel 2025 & 2033
- Figure 39: Middle East and Africa Organic Coffee Industry Revenue Share (%), by Distribution Channel 2025 & 2033
- Figure 40: Middle East and Africa Organic Coffee Industry Revenue (billion), by Country 2025 & 2033
- Figure 41: Middle East and Africa Organic Coffee Industry Revenue Share (%), by Country 2025 & 2033
List of Tables
- Table 1: Global Organic Coffee Industry Revenue billion Forecast, by Roast 2020 & 2033
- Table 2: Global Organic Coffee Industry Revenue billion Forecast, by Origin 2020 & 2033
- Table 3: Global Organic Coffee Industry Revenue billion Forecast, by Distribution Channel 2020 & 2033
- Table 4: Global Organic Coffee Industry Revenue billion Forecast, by Region 2020 & 2033
- Table 5: Global Organic Coffee Industry Revenue billion Forecast, by Roast 2020 & 2033
- Table 6: Global Organic Coffee Industry Revenue billion Forecast, by Origin 2020 & 2033
- Table 7: Global Organic Coffee Industry Revenue billion Forecast, by Distribution Channel 2020 & 2033
- Table 8: Global Organic Coffee Industry Revenue billion Forecast, by Country 2020 & 2033
- Table 9: United States Organic Coffee Industry Revenue (billion) Forecast, by Application 2020 & 2033
- Table 10: Canada Organic Coffee Industry Revenue (billion) Forecast, by Application 2020 & 2033
- Table 11: Mexico Organic Coffee Industry Revenue (billion) Forecast, by Application 2020 & 2033
- Table 12: Rest of North America Organic Coffee Industry Revenue (billion) Forecast, by Application 2020 & 2033
- Table 13: Global Organic Coffee Industry Revenue billion Forecast, by Roast 2020 & 2033
- Table 14: Global Organic Coffee Industry Revenue billion Forecast, by Origin 2020 & 2033
- Table 15: Global Organic Coffee Industry Revenue billion Forecast, by Distribution Channel 2020 & 2033
- Table 16: Global Organic Coffee Industry Revenue billion Forecast, by Country 2020 & 2033
- Table 17: Spain Organic Coffee Industry Revenue (billion) Forecast, by Application 2020 & 2033
- Table 18: United Kingdom Organic Coffee Industry Revenue (billion) Forecast, by Application 2020 & 2033
- Table 19: Germany Organic Coffee Industry Revenue (billion) Forecast, by Application 2020 & 2033
- Table 20: France Organic Coffee Industry Revenue (billion) Forecast, by Application 2020 & 2033
- Table 21: Italy Organic Coffee Industry Revenue (billion) Forecast, by Application 2020 & 2033
- Table 22: Russia Organic Coffee Industry Revenue (billion) Forecast, by Application 2020 & 2033
- Table 23: Rest of Europe Organic Coffee Industry Revenue (billion) Forecast, by Application 2020 & 2033
- Table 24: Global Organic Coffee Industry Revenue billion Forecast, by Roast 2020 & 2033
- Table 25: Global Organic Coffee Industry Revenue billion Forecast, by Origin 2020 & 2033
- Table 26: Global Organic Coffee Industry Revenue billion Forecast, by Distribution Channel 2020 & 2033
- Table 27: Global Organic Coffee Industry Revenue billion Forecast, by Country 2020 & 2033
- Table 28: China Organic Coffee Industry Revenue (billion) Forecast, by Application 2020 & 2033
- Table 29: Japan Organic Coffee Industry Revenue (billion) Forecast, by Application 2020 & 2033
- Table 30: India Organic Coffee Industry Revenue (billion) Forecast, by Application 2020 & 2033
- Table 31: Australia Organic Coffee Industry Revenue (billion) Forecast, by Application 2020 & 2033
- Table 32: Rest of Asia Pacific Organic Coffee Industry Revenue (billion) Forecast, by Application 2020 & 2033
- Table 33: Global Organic Coffee Industry Revenue billion Forecast, by Roast 2020 & 2033
- Table 34: Global Organic Coffee Industry Revenue billion Forecast, by Origin 2020 & 2033
- Table 35: Global Organic Coffee Industry Revenue billion Forecast, by Distribution Channel 2020 & 2033
- Table 36: Global Organic Coffee Industry Revenue billion Forecast, by Country 2020 & 2033
- Table 37: Brazil Organic Coffee Industry Revenue (billion) Forecast, by Application 2020 & 2033
- Table 38: Argentina Organic Coffee Industry Revenue (billion) Forecast, by Application 2020 & 2033
- Table 39: Rest of South America Organic Coffee Industry Revenue (billion) Forecast, by Application 2020 & 2033
- Table 40: Global Organic Coffee Industry Revenue billion Forecast, by Roast 2020 & 2033
- Table 41: Global Organic Coffee Industry Revenue billion Forecast, by Origin 2020 & 2033
- Table 42: Global Organic Coffee Industry Revenue billion Forecast, by Distribution Channel 2020 & 2033
- Table 43: Global Organic Coffee Industry Revenue billion Forecast, by Country 2020 & 2033
- Table 44: South Africa Organic Coffee Industry Revenue (billion) Forecast, by Application 2020 & 2033
- Table 45: Saudi Arabia Organic Coffee Industry Revenue (billion) Forecast, by Application 2020 & 2033
- Table 46: Rest of Middle East and Africa Organic Coffee Industry Revenue (billion) Forecast, by Application 2020 & 2033
Frequently Asked Questions
1. What is the projected Compound Annual Growth Rate (CAGR) of the Organic Coffee Industry?
The projected CAGR is approximately 8.8%.
2. Which companies are prominent players in the Organic Coffee Industry?
Key companies in the market include Jungle Products Cr, Keurig Green Mountain Inc, Death Wish Coffee Co, Rogers Family Company, Ethical Bean Coffe, Allegro Coffee Company, Camano Island Coffee Roasters Llc, Dean's Beans Organic Coffee, Burke Brands Llc.
3. What are the main segments of the Organic Coffee Industry?
The market segments include Roast, Origin, Distribution Channel.
4. Can you provide details about the market size?
The market size is estimated to be USD 5.24 billion as of 2022.
5. What are some drivers contributing to market growth?
Growing Demand for Cocoa Butter Equivalents Among Food Manufacturers; Rising Application in Food Industry.
6. What are the notable trends driving market growth?
Organic Coffee Market is Witnessing Increased Export Rates.
7. Are there any restraints impacting market growth?
Health Concerns Pertaining to the Excessive Consumption of Fats and Oils.
8. Can you provide examples of recent developments in the market?
N/A
9. What pricing options are available for accessing the report?
Pricing options include single-user, multi-user, and enterprise licenses priced at USD 4750, USD 5250, and USD 8750 respectively.
10. Is the market size provided in terms of value or volume?
The market size is provided in terms of value, measured in billion.
11. Are there any specific market keywords associated with the report?
Yes, the market keyword associated with the report is "Organic Coffee Industry," which aids in identifying and referencing the specific market segment covered.
12. How do I determine which pricing option suits my needs best?
The pricing options vary based on user requirements and access needs. Individual users may opt for single-user licenses, while businesses requiring broader access may choose multi-user or enterprise licenses for cost-effective access to the report.
13. Are there any additional resources or data provided in the Organic Coffee Industry report?
While the report offers comprehensive insights, it's advisable to review the specific contents or supplementary materials provided to ascertain if additional resources or data are available.
14. How can I stay updated on further developments or reports in the Organic Coffee Industry?
To stay informed about further developments, trends, and reports in the Organic Coffee Industry, consider subscribing to industry newsletters, following relevant companies and organizations, or regularly checking reputable industry news sources and publications.
Methodology
Step 1 - Identification of Relevant Samples Size from Population Database


Step 2 - Approaches for Defining Global Market Size (Value, Volume* & Price*)

Note*: In applicable scenarios
Step 3 - Data Sources
Primary Research
- Web Analytics
- Survey Reports
- Research Institute
- Latest Research Reports
- Opinion Leaders
Secondary Research
- Annual Reports
- White Paper
- Latest Press Release
- Industry Association
- Paid Database
- Investor Presentations

Step 4 - Data Triangulation
Involves using different sources of information in order to increase the validity of a study
These sources are likely to be stakeholders in a program - participants, other researchers, program staff, other community members, and so on.
Then we put all data in single framework & apply various statistical tools to find out the dynamic on the market.
During the analysis stage, feedback from the stakeholder groups would be compared to determine areas of agreement as well as areas of divergence