
Key Insights
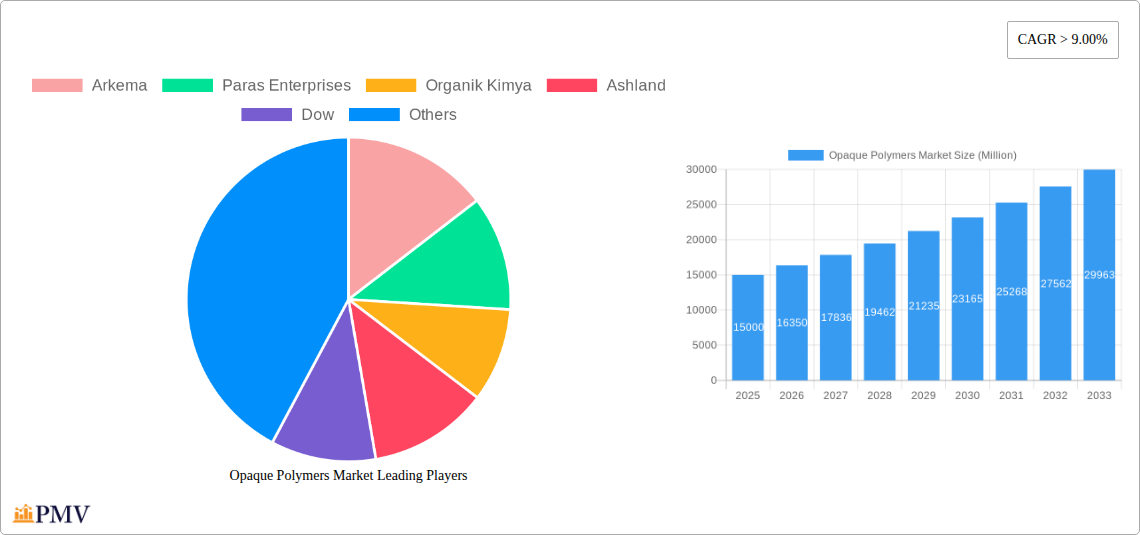
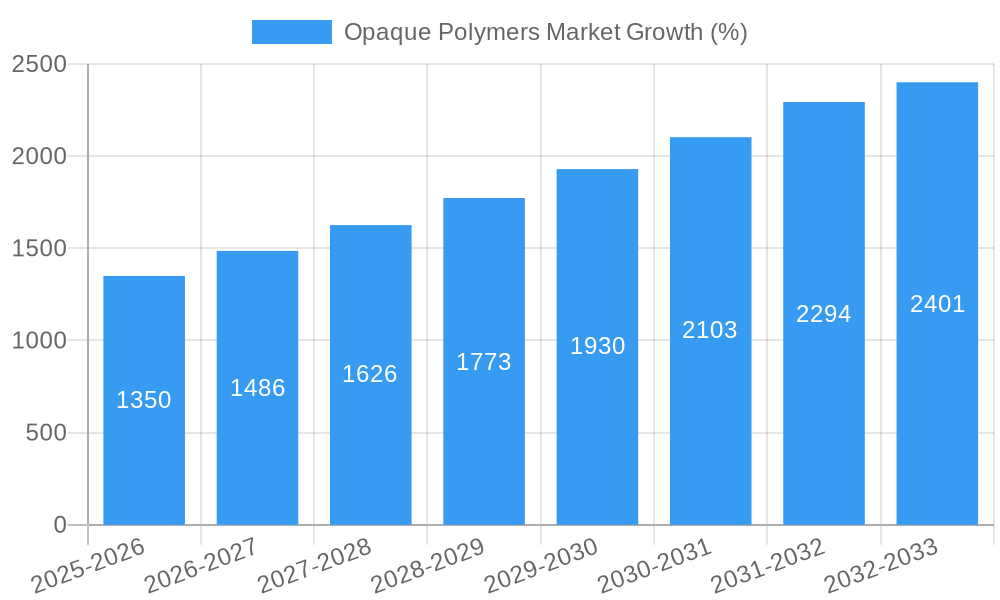
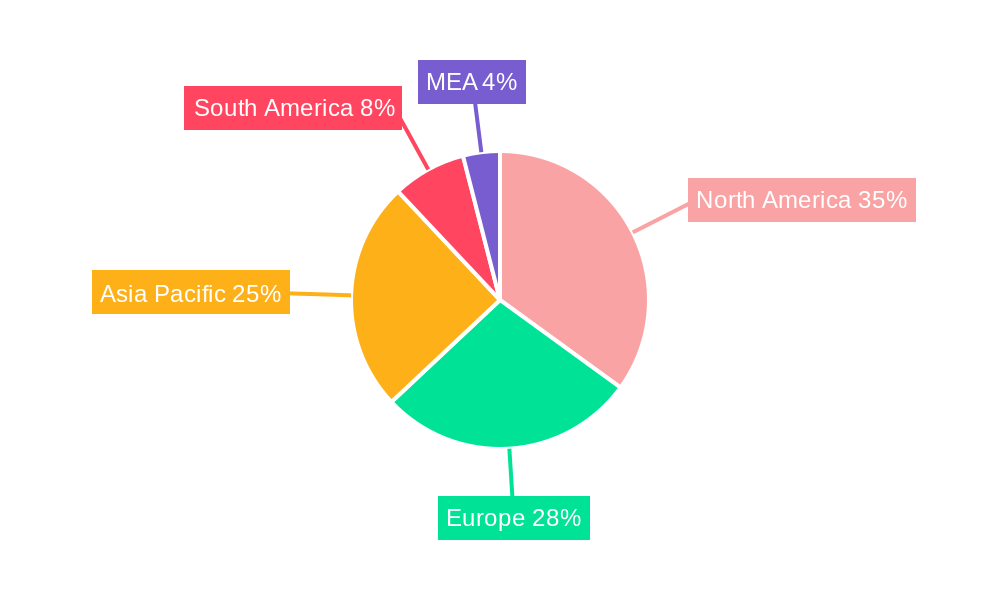
The opaque polymers market is experiencing robust growth, driven by increasing demand across diverse applications. The market's Compound Annual Growth Rate (CAGR) exceeding 9% from 2019 to 2024 indicates significant expansion. Key application segments, including paints & coatings, cosmetics & personal care, and detergents, are major contributors to this growth. The paints & coatings segment, likely the largest, benefits from the rising construction activity globally and the increasing preference for aesthetically pleasing, durable finishes. Cosmetics & personal care leverage opaque polymers for their ability to mask color imperfections and enhance product appeal. Detergents utilize these polymers for improved opacity and enhanced cleaning properties. Geographical analysis reveals strong growth across regions, with North America and Asia-Pacific potentially leading the market due to established industrial infrastructure and increasing consumer spending. However, market expansion is influenced by factors such as fluctuating raw material prices and environmental regulations regarding polymer production and disposal. Major players like Arkema, Ashland, and Dow are driving innovation through advanced polymer formulations, catering to specific application requirements and sustainability concerns. The competitive landscape is characterized by a mix of established multinational corporations and regional players, leading to ongoing innovation and strategic partnerships. Looking ahead, the forecast period (2025-2033) suggests continued market expansion, fueled by technological advancements and the growing demand for specialized opaque polymers in niche applications.
The market's future trajectory will likely be shaped by several factors. Sustainable and bio-based polymer solutions are gaining traction, driven by increasing environmental awareness. Advancements in polymer technology, such as the development of high-performance, eco-friendly opaque polymers, are expected to drive further market growth. However, potential challenges include volatility in raw material costs and stricter environmental regulations. Companies are focusing on optimizing their production processes to mitigate these challenges and maintain their market share. Strategic collaborations and mergers & acquisitions within the industry will continue to reshape the competitive landscape, fostering further innovation and market penetration. The focus on product diversification and catering to regional demands will be crucial for sustained success in this dynamic market. The projected market size for 2025 will serve as a crucial benchmark for future estimations and strategic planning within the industry.
Opaque Polymers Market: A Comprehensive Report (2019-2033)
This in-depth report provides a comprehensive analysis of the global Opaque Polymers market, offering invaluable insights for industry stakeholders seeking to navigate the complexities of this dynamic sector. The study covers the period from 2019 to 2033, with a focus on the forecast period (2025-2033) and a base year of 2025. The report meticulously examines market structure, competitive dynamics, industry trends, dominant segments, product innovations, and key growth drivers, while also highlighting challenges and strategic outlook. With a detailed segmentation by application (Paints & Coatings, Cosmetics & Personal Care, Detergents), this report is a crucial resource for strategic decision-making. The market size in 2025 is estimated at xx Million and is projected to reach xx Million by 2033, exhibiting a CAGR of xx%.
Opaque Polymers Market Market Structure & Competitive Dynamics
The global opaque polymers market exhibits a moderately concentrated structure, with a few major players holding significant market share. The competitive landscape is characterized by intense rivalry driven by product innovation, pricing strategies, and geographic expansion. Arkema, Dow, and Ashland are among the leading players, each commanding a substantial portion of the market (exact figures are detailed in the full report). The innovation ecosystem is vibrant, with continuous development of new polymer types to enhance opacity, durability, and performance characteristics. Regulatory frameworks, particularly those concerning environmental compliance and material safety, significantly influence market dynamics. The presence of substitute materials, such as pigments and fillers, presents a competitive challenge, leading to ongoing R&D efforts to maintain market position. End-user trends towards sustainable and eco-friendly materials are driving demand for biodegradable and recycled opaque polymers. M&A activities have been relatively moderate in recent years, with deal values typically ranging from xx Million to xx Million. Key mergers and acquisitions within the study period are detailed within the full report, providing a deeper understanding of the strategic shifts within the market.
Opaque Polymers Market Industry Trends & Insights
The opaque polymers market is experiencing steady growth fueled by increasing demand from diverse end-use sectors. The Paints & Coatings segment remains the largest application area, driven by the construction and automotive industries. The CAGR for the forecast period is estimated at xx%, reflecting robust growth prospects. Technological advancements, particularly in nano-technology and polymer chemistry, are leading to the development of high-performance opaque polymers with improved properties like UV resistance, weatherability, and enhanced opacity. Consumer preferences for aesthetically pleasing and durable products are influencing product development, pushing manufacturers towards innovations that cater to specific application needs. Competitive dynamics are shaped by factors such as pricing pressures, technological advancements, and the emergence of new players, leading to continuous market evolution. Market penetration of novel opaque polymer formulations is steadily increasing, particularly in niche applications such as specialty coatings and high-end cosmetics. The global market size is projected to surpass xx Million by 2033, driven by these key industry drivers.
Dominant Markets & Segments in Opaque Polymers Market
The Paints & Coatings segment is the dominant application area for opaque polymers, accounting for the largest market share globally. This is primarily driven by the flourishing construction sector, particularly in developing economies, and the growing demand for high-performance coatings in automotive and industrial applications. Within this segment, the Asia-Pacific region exhibits the strongest growth, fueled by robust infrastructure development and expanding industrialization.
- Key Drivers in the Asia-Pacific Region:
- Rapid urbanization and infrastructure development.
- Increasing disposable incomes and rising construction activities.
- Favorable government policies promoting industrial growth.
The Cosmetics & Personal Care segment shows moderate growth, driven by the increasing demand for high-quality cosmetics and personal care products with improved opacity and aesthetic appeal. Detergents represent a smaller but steadily growing market segment for opaque polymers, driven by consumer preference for enhanced product efficacy and aesthetics. The detailed market share breakdown of each application sector is available within the comprehensive report.
Opaque Polymers Market Product Innovations
Recent product innovations focus on enhancing the sustainability and performance of opaque polymers. This includes the development of bio-based polymers, recycled polymer blends, and formulations with improved UV resistance and chemical stability. These innovations are driven by a growing awareness of environmental concerns and the increasing demand for high-performance materials tailored to specific application requirements. The adoption of such products presents significant competitive advantages, allowing manufacturers to cater to the evolving needs of environmentally conscious consumers and industries.
Report Segmentation & Scope
This report segments the opaque polymers market by application:
Paints & Coatings: This segment is analyzed based on sub-types, including architectural coatings, automotive coatings, and industrial coatings. Growth projections, market sizes, and competitive landscapes are detailed for each sub-segment.
Cosmetics & Personal Care: This segment examines the utilization of opaque polymers in various cosmetics, personal care products, and formulations. Growth projections and competitive dynamics are analyzed in detail.
Detergents: This segment focuses on the use of opaque polymers in detergent formulations. Growth projections and market dynamics are detailed in this segment analysis.
The report provides a comprehensive overview of each segment, including market size estimations, growth forecasts, and analysis of the competitive environment.
Key Drivers of Opaque Polymers Market Growth
The opaque polymers market is driven by several key factors: Firstly, the robust growth of the construction industry, particularly in emerging economies, fuels the demand for high-performance coatings. Secondly, increasing consumer preference for aesthetically pleasing and durable products, particularly in the cosmetics and personal care industries, is another key driver. Thirdly, technological advancements, leading to the development of new polymer types with improved properties such as UV resistance and weatherability, further stimulate market growth. Finally, the continuous exploration of novel applications for opaque polymers further contributes to market expansion.
Challenges in the Opaque Polymers Market Sector
The opaque polymers market faces challenges, including fluctuating raw material prices, stringent environmental regulations, and intense competition from substitute materials. Supply chain disruptions can also significantly impact production and market availability. The stringent regulatory framework for chemicals, especially in developed economies, necessitates compliance with rigorous safety and environmental standards, which can increase costs and complexity for manufacturers. Furthermore, the availability of cheaper substitute materials can present significant competitive challenges. These factors pose considerable challenges impacting the overall market growth.
Leading Players in the Opaque Polymers Market Market
- Arkema
- Paras Enterprises
- Organik Kimya
- Ashland
- Dow
- En-Tech Polymer Co Ltd
- Pexi Chem Private Limited
- Visen Industries Limited
- HANKUCK LATICES Co Ltd
- Zschimmer & Schwarz
Key Developments in Opaque Polymers Market Sector
- January 2023: Dow Chemical announced the launch of a new, sustainable opaque polymer for the paints and coatings industry.
- June 2022: Arkema acquired a smaller competitor, expanding its market share in the cosmetics and personal care sector.
- October 2021: Ashland introduced a novel opaque polymer with enhanced UV resistance for outdoor applications.
(Further key developments are detailed within the full report.)
Strategic Opaque Polymers Market Market Outlook
The opaque polymers market presents significant growth opportunities, particularly in developing economies, driven by the expanding construction sector and increasing consumer demand for high-quality products. Strategic initiatives focusing on product innovation, sustainable material development, and expansion into emerging markets are expected to yield substantial returns. The development of bio-based and recycled polymer formulations will be crucial for long-term growth. Companies investing in R&D and strategic partnerships are expected to strengthen their market positions and capture a significant share of future market growth.
Opaque Polymers Market Segmentation
-
1. Application
- 1.1. Paints & Coatings
- 1.2. Cosmetics & Personal Care
- 1.3. Detergents
Opaque Polymers Market Segmentation By Geography
-
1. Asia Pacific
- 1.1. China
- 1.2. India
- 1.3. Japan
- 1.4. South Korea
- 1.5. Rest of Asia Pacific
-
2. North America
- 2.1. United States
- 2.2. Canada
- 2.3. Rest of North America
-
3. Europe
- 3.1. Germany
- 3.2. United Kingdom
- 3.3. Spain
- 3.4. Italy
- 3.5. Rest of Europe
-
4. Rest of the World
- 4.1. South America
- 4.2. Middle East and Africa
Opaque Polymers Market REPORT HIGHLIGHTS
| Aspects | Details |
|---|---|
| Study Period | 2019-2033 |
| Base Year | 2024 |
| Estimated Year | 2025 |
| Forecast Period | 2025-2033 |
| Historical Period | 2019-2024 |
| Growth Rate | CAGR of > 9.00% from 2019-2033 |
| Segmentation |
|
Table of Contents
- 1. Introduction
- 1.1. Research Scope
- 1.2. Market Segmentation
- 1.3. Research Methodology
- 1.4. Definitions and Assumptions
- 2. Executive Summary
- 2.1. Introduction
- 3. Market Dynamics
- 3.1. Introduction
- 3.2. Market Drivers
- 3.2.1. ; High Cost and Increasing Need for Scattering Efficiency in Titanium Dioxide Pigment; Rising Demand for Architectural Paints & Coatings
- 3.3. Market Restrains
- 3.3.1. ; Less Hiding Power than Titanium Dioxide; Other Restraints
- 3.4. Market Trends
- 3.4.1. Growing Demand from Paints & Coatings Segment
- 4. Market Factor Analysis
- 4.1. Porters Five Forces
- 4.2. Supply/Value Chain
- 4.3. PESTEL analysis
- 4.4. Market Entropy
- 4.5. Patent/Trademark Analysis
- 5. Global Opaque Polymers Market Analysis, Insights and Forecast, 2019-2031
- 5.1. Market Analysis, Insights and Forecast - by Application
- 5.1.1. Paints & Coatings
- 5.1.2. Cosmetics & Personal Care
- 5.1.3. Detergents
- 5.2. Market Analysis, Insights and Forecast - by Region
- 5.2.1. Asia Pacific
- 5.2.2. North America
- 5.2.3. Europe
- 5.2.4. Rest of the World
- 5.1. Market Analysis, Insights and Forecast - by Application
- 6. Asia Pacific Opaque Polymers Market Analysis, Insights and Forecast, 2019-2031
- 6.1. Market Analysis, Insights and Forecast - by Application
- 6.1.1. Paints & Coatings
- 6.1.2. Cosmetics & Personal Care
- 6.1.3. Detergents
- 6.1. Market Analysis, Insights and Forecast - by Application
- 7. North America Opaque Polymers Market Analysis, Insights and Forecast, 2019-2031
- 7.1. Market Analysis, Insights and Forecast - by Application
- 7.1.1. Paints & Coatings
- 7.1.2. Cosmetics & Personal Care
- 7.1.3. Detergents
- 7.1. Market Analysis, Insights and Forecast - by Application
- 8. Europe Opaque Polymers Market Analysis, Insights and Forecast, 2019-2031
- 8.1. Market Analysis, Insights and Forecast - by Application
- 8.1.1. Paints & Coatings
- 8.1.2. Cosmetics & Personal Care
- 8.1.3. Detergents
- 8.1. Market Analysis, Insights and Forecast - by Application
- 9. Rest of the World Opaque Polymers Market Analysis, Insights and Forecast, 2019-2031
- 9.1. Market Analysis, Insights and Forecast - by Application
- 9.1.1. Paints & Coatings
- 9.1.2. Cosmetics & Personal Care
- 9.1.3. Detergents
- 9.1. Market Analysis, Insights and Forecast - by Application
- 10. North America Opaque Polymers Market Analysis, Insights and Forecast, 2019-2031
- 10.1. Market Analysis, Insights and Forecast - By Country/Sub-region
- 10.1.1 United States
- 10.1.2 Canada
- 10.1.3 Mexico
- 11. Europe Opaque Polymers Market Analysis, Insights and Forecast, 2019-2031
- 11.1. Market Analysis, Insights and Forecast - By Country/Sub-region
- 11.1.1 Germany
- 11.1.2 France
- 11.1.3 Italy
- 11.1.4 United Kingdom
- 11.1.5 Netherlands
- 11.1.6 Rest of Europe
- 12. Asia Pacific Opaque Polymers Market Analysis, Insights and Forecast, 2019-2031
- 12.1. Market Analysis, Insights and Forecast - By Country/Sub-region
- 12.1.1 China
- 12.1.2 Japan
- 12.1.3 India
- 12.1.4 South Korea
- 12.1.5 Taiwan
- 12.1.6 Australia
- 12.1.7 Rest of Asia-Pacific
- 13. South America Opaque Polymers Market Analysis, Insights and Forecast, 2019-2031
- 13.1. Market Analysis, Insights and Forecast - By Country/Sub-region
- 13.1.1 Brazil
- 13.1.2 Argentina
- 13.1.3 Rest of South America
- 14. MEA Opaque Polymers Market Analysis, Insights and Forecast, 2019-2031
- 14.1. Market Analysis, Insights and Forecast - By Country/Sub-region
- 14.1.1 Middle East
- 14.1.2 Africa
- 15. Competitive Analysis
- 15.1. Global Market Share Analysis 2024
- 15.2. Company Profiles
- 15.2.1 Arkema
- 15.2.1.1. Overview
- 15.2.1.2. Products
- 15.2.1.3. SWOT Analysis
- 15.2.1.4. Recent Developments
- 15.2.1.5. Financials (Based on Availability)
- 15.2.2 Paras Enterprises
- 15.2.2.1. Overview
- 15.2.2.2. Products
- 15.2.2.3. SWOT Analysis
- 15.2.2.4. Recent Developments
- 15.2.2.5. Financials (Based on Availability)
- 15.2.3 Organik Kimya
- 15.2.3.1. Overview
- 15.2.3.2. Products
- 15.2.3.3. SWOT Analysis
- 15.2.3.4. Recent Developments
- 15.2.3.5. Financials (Based on Availability)
- 15.2.4 Ashland
- 15.2.4.1. Overview
- 15.2.4.2. Products
- 15.2.4.3. SWOT Analysis
- 15.2.4.4. Recent Developments
- 15.2.4.5. Financials (Based on Availability)
- 15.2.5 Dow
- 15.2.5.1. Overview
- 15.2.5.2. Products
- 15.2.5.3. SWOT Analysis
- 15.2.5.4. Recent Developments
- 15.2.5.5. Financials (Based on Availability)
- 15.2.6 En-Tech Polymer Co Ltd
- 15.2.6.1. Overview
- 15.2.6.2. Products
- 15.2.6.3. SWOT Analysis
- 15.2.6.4. Recent Developments
- 15.2.6.5. Financials (Based on Availability)
- 15.2.7 Pexi Chem Private Limited
- 15.2.7.1. Overview
- 15.2.7.2. Products
- 15.2.7.3. SWOT Analysis
- 15.2.7.4. Recent Developments
- 15.2.7.5. Financials (Based on Availability)
- 15.2.8 Visen Industries Limited
- 15.2.8.1. Overview
- 15.2.8.2. Products
- 15.2.8.3. SWOT Analysis
- 15.2.8.4. Recent Developments
- 15.2.8.5. Financials (Based on Availability)
- 15.2.9 HANKUCK LATICES Co Ltd
- 15.2.9.1. Overview
- 15.2.9.2. Products
- 15.2.9.3. SWOT Analysis
- 15.2.9.4. Recent Developments
- 15.2.9.5. Financials (Based on Availability)
- 15.2.10 Zschimmer & Schwarz
- 15.2.10.1. Overview
- 15.2.10.2. Products
- 15.2.10.3. SWOT Analysis
- 15.2.10.4. Recent Developments
- 15.2.10.5. Financials (Based on Availability)
- 15.2.1 Arkema
List of Figures
- Figure 1: Global Opaque Polymers Market Revenue Breakdown (Million, %) by Region 2024 & 2032
- Figure 2: Global Opaque Polymers Market Volume Breakdown (K Tons, %) by Region 2024 & 2032
- Figure 3: North America Opaque Polymers Market Revenue (Million), by Country 2024 & 2032
- Figure 4: North America Opaque Polymers Market Volume (K Tons), by Country 2024 & 2032
- Figure 5: North America Opaque Polymers Market Revenue Share (%), by Country 2024 & 2032
- Figure 6: North America Opaque Polymers Market Volume Share (%), by Country 2024 & 2032
- Figure 7: Europe Opaque Polymers Market Revenue (Million), by Country 2024 & 2032
- Figure 8: Europe Opaque Polymers Market Volume (K Tons), by Country 2024 & 2032
- Figure 9: Europe Opaque Polymers Market Revenue Share (%), by Country 2024 & 2032
- Figure 10: Europe Opaque Polymers Market Volume Share (%), by Country 2024 & 2032
- Figure 11: Asia Pacific Opaque Polymers Market Revenue (Million), by Country 2024 & 2032
- Figure 12: Asia Pacific Opaque Polymers Market Volume (K Tons), by Country 2024 & 2032
- Figure 13: Asia Pacific Opaque Polymers Market Revenue Share (%), by Country 2024 & 2032
- Figure 14: Asia Pacific Opaque Polymers Market Volume Share (%), by Country 2024 & 2032
- Figure 15: South America Opaque Polymers Market Revenue (Million), by Country 2024 & 2032
- Figure 16: South America Opaque Polymers Market Volume (K Tons), by Country 2024 & 2032
- Figure 17: South America Opaque Polymers Market Revenue Share (%), by Country 2024 & 2032
- Figure 18: South America Opaque Polymers Market Volume Share (%), by Country 2024 & 2032
- Figure 19: MEA Opaque Polymers Market Revenue (Million), by Country 2024 & 2032
- Figure 20: MEA Opaque Polymers Market Volume (K Tons), by Country 2024 & 2032
- Figure 21: MEA Opaque Polymers Market Revenue Share (%), by Country 2024 & 2032
- Figure 22: MEA Opaque Polymers Market Volume Share (%), by Country 2024 & 2032
- Figure 23: Asia Pacific Opaque Polymers Market Revenue (Million), by Application 2024 & 2032
- Figure 24: Asia Pacific Opaque Polymers Market Volume (K Tons), by Application 2024 & 2032
- Figure 25: Asia Pacific Opaque Polymers Market Revenue Share (%), by Application 2024 & 2032
- Figure 26: Asia Pacific Opaque Polymers Market Volume Share (%), by Application 2024 & 2032
- Figure 27: Asia Pacific Opaque Polymers Market Revenue (Million), by Country 2024 & 2032
- Figure 28: Asia Pacific Opaque Polymers Market Volume (K Tons), by Country 2024 & 2032
- Figure 29: Asia Pacific Opaque Polymers Market Revenue Share (%), by Country 2024 & 2032
- Figure 30: Asia Pacific Opaque Polymers Market Volume Share (%), by Country 2024 & 2032
- Figure 31: North America Opaque Polymers Market Revenue (Million), by Application 2024 & 2032
- Figure 32: North America Opaque Polymers Market Volume (K Tons), by Application 2024 & 2032
- Figure 33: North America Opaque Polymers Market Revenue Share (%), by Application 2024 & 2032
- Figure 34: North America Opaque Polymers Market Volume Share (%), by Application 2024 & 2032
- Figure 35: North America Opaque Polymers Market Revenue (Million), by Country 2024 & 2032
- Figure 36: North America Opaque Polymers Market Volume (K Tons), by Country 2024 & 2032
- Figure 37: North America Opaque Polymers Market Revenue Share (%), by Country 2024 & 2032
- Figure 38: North America Opaque Polymers Market Volume Share (%), by Country 2024 & 2032
- Figure 39: Europe Opaque Polymers Market Revenue (Million), by Application 2024 & 2032
- Figure 40: Europe Opaque Polymers Market Volume (K Tons), by Application 2024 & 2032
- Figure 41: Europe Opaque Polymers Market Revenue Share (%), by Application 2024 & 2032
- Figure 42: Europe Opaque Polymers Market Volume Share (%), by Application 2024 & 2032
- Figure 43: Europe Opaque Polymers Market Revenue (Million), by Country 2024 & 2032
- Figure 44: Europe Opaque Polymers Market Volume (K Tons), by Country 2024 & 2032
- Figure 45: Europe Opaque Polymers Market Revenue Share (%), by Country 2024 & 2032
- Figure 46: Europe Opaque Polymers Market Volume Share (%), by Country 2024 & 2032
- Figure 47: Rest of the World Opaque Polymers Market Revenue (Million), by Application 2024 & 2032
- Figure 48: Rest of the World Opaque Polymers Market Volume (K Tons), by Application 2024 & 2032
- Figure 49: Rest of the World Opaque Polymers Market Revenue Share (%), by Application 2024 & 2032
- Figure 50: Rest of the World Opaque Polymers Market Volume Share (%), by Application 2024 & 2032
- Figure 51: Rest of the World Opaque Polymers Market Revenue (Million), by Country 2024 & 2032
- Figure 52: Rest of the World Opaque Polymers Market Volume (K Tons), by Country 2024 & 2032
- Figure 53: Rest of the World Opaque Polymers Market Revenue Share (%), by Country 2024 & 2032
- Figure 54: Rest of the World Opaque Polymers Market Volume Share (%), by Country 2024 & 2032
List of Tables
- Table 1: Global Opaque Polymers Market Revenue Million Forecast, by Region 2019 & 2032
- Table 2: Global Opaque Polymers Market Volume K Tons Forecast, by Region 2019 & 2032
- Table 3: Global Opaque Polymers Market Revenue Million Forecast, by Application 2019 & 2032
- Table 4: Global Opaque Polymers Market Volume K Tons Forecast, by Application 2019 & 2032
- Table 5: Global Opaque Polymers Market Revenue Million Forecast, by Region 2019 & 2032
- Table 6: Global Opaque Polymers Market Volume K Tons Forecast, by Region 2019 & 2032
- Table 7: Global Opaque Polymers Market Revenue Million Forecast, by Country 2019 & 2032
- Table 8: Global Opaque Polymers Market Volume K Tons Forecast, by Country 2019 & 2032
- Table 9: United States Opaque Polymers Market Revenue (Million) Forecast, by Application 2019 & 2032
- Table 10: United States Opaque Polymers Market Volume (K Tons) Forecast, by Application 2019 & 2032
- Table 11: Canada Opaque Polymers Market Revenue (Million) Forecast, by Application 2019 & 2032
- Table 12: Canada Opaque Polymers Market Volume (K Tons) Forecast, by Application 2019 & 2032
- Table 13: Mexico Opaque Polymers Market Revenue (Million) Forecast, by Application 2019 & 2032
- Table 14: Mexico Opaque Polymers Market Volume (K Tons) Forecast, by Application 2019 & 2032
- Table 15: Global Opaque Polymers Market Revenue Million Forecast, by Country 2019 & 2032
- Table 16: Global Opaque Polymers Market Volume K Tons Forecast, by Country 2019 & 2032
- Table 17: Germany Opaque Polymers Market Revenue (Million) Forecast, by Application 2019 & 2032
- Table 18: Germany Opaque Polymers Market Volume (K Tons) Forecast, by Application 2019 & 2032
- Table 19: France Opaque Polymers Market Revenue (Million) Forecast, by Application 2019 & 2032
- Table 20: France Opaque Polymers Market Volume (K Tons) Forecast, by Application 2019 & 2032
- Table 21: Italy Opaque Polymers Market Revenue (Million) Forecast, by Application 2019 & 2032
- Table 22: Italy Opaque Polymers Market Volume (K Tons) Forecast, by Application 2019 & 2032
- Table 23: United Kingdom Opaque Polymers Market Revenue (Million) Forecast, by Application 2019 & 2032
- Table 24: United Kingdom Opaque Polymers Market Volume (K Tons) Forecast, by Application 2019 & 2032
- Table 25: Netherlands Opaque Polymers Market Revenue (Million) Forecast, by Application 2019 & 2032
- Table 26: Netherlands Opaque Polymers Market Volume (K Tons) Forecast, by Application 2019 & 2032
- Table 27: Rest of Europe Opaque Polymers Market Revenue (Million) Forecast, by Application 2019 & 2032
- Table 28: Rest of Europe Opaque Polymers Market Volume (K Tons) Forecast, by Application 2019 & 2032
- Table 29: Global Opaque Polymers Market Revenue Million Forecast, by Country 2019 & 2032
- Table 30: Global Opaque Polymers Market Volume K Tons Forecast, by Country 2019 & 2032
- Table 31: China Opaque Polymers Market Revenue (Million) Forecast, by Application 2019 & 2032
- Table 32: China Opaque Polymers Market Volume (K Tons) Forecast, by Application 2019 & 2032
- Table 33: Japan Opaque Polymers Market Revenue (Million) Forecast, by Application 2019 & 2032
- Table 34: Japan Opaque Polymers Market Volume (K Tons) Forecast, by Application 2019 & 2032
- Table 35: India Opaque Polymers Market Revenue (Million) Forecast, by Application 2019 & 2032
- Table 36: India Opaque Polymers Market Volume (K Tons) Forecast, by Application 2019 & 2032
- Table 37: South Korea Opaque Polymers Market Revenue (Million) Forecast, by Application 2019 & 2032
- Table 38: South Korea Opaque Polymers Market Volume (K Tons) Forecast, by Application 2019 & 2032
- Table 39: Taiwan Opaque Polymers Market Revenue (Million) Forecast, by Application 2019 & 2032
- Table 40: Taiwan Opaque Polymers Market Volume (K Tons) Forecast, by Application 2019 & 2032
- Table 41: Australia Opaque Polymers Market Revenue (Million) Forecast, by Application 2019 & 2032
- Table 42: Australia Opaque Polymers Market Volume (K Tons) Forecast, by Application 2019 & 2032
- Table 43: Rest of Asia-Pacific Opaque Polymers Market Revenue (Million) Forecast, by Application 2019 & 2032
- Table 44: Rest of Asia-Pacific Opaque Polymers Market Volume (K Tons) Forecast, by Application 2019 & 2032
- Table 45: Global Opaque Polymers Market Revenue Million Forecast, by Country 2019 & 2032
- Table 46: Global Opaque Polymers Market Volume K Tons Forecast, by Country 2019 & 2032
- Table 47: Brazil Opaque Polymers Market Revenue (Million) Forecast, by Application 2019 & 2032
- Table 48: Brazil Opaque Polymers Market Volume (K Tons) Forecast, by Application 2019 & 2032
- Table 49: Argentina Opaque Polymers Market Revenue (Million) Forecast, by Application 2019 & 2032
- Table 50: Argentina Opaque Polymers Market Volume (K Tons) Forecast, by Application 2019 & 2032
- Table 51: Rest of South America Opaque Polymers Market Revenue (Million) Forecast, by Application 2019 & 2032
- Table 52: Rest of South America Opaque Polymers Market Volume (K Tons) Forecast, by Application 2019 & 2032
- Table 53: Global Opaque Polymers Market Revenue Million Forecast, by Country 2019 & 2032
- Table 54: Global Opaque Polymers Market Volume K Tons Forecast, by Country 2019 & 2032
- Table 55: Middle East Opaque Polymers Market Revenue (Million) Forecast, by Application 2019 & 2032
- Table 56: Middle East Opaque Polymers Market Volume (K Tons) Forecast, by Application 2019 & 2032
- Table 57: Africa Opaque Polymers Market Revenue (Million) Forecast, by Application 2019 & 2032
- Table 58: Africa Opaque Polymers Market Volume (K Tons) Forecast, by Application 2019 & 2032
- Table 59: Global Opaque Polymers Market Revenue Million Forecast, by Application 2019 & 2032
- Table 60: Global Opaque Polymers Market Volume K Tons Forecast, by Application 2019 & 2032
- Table 61: Global Opaque Polymers Market Revenue Million Forecast, by Country 2019 & 2032
- Table 62: Global Opaque Polymers Market Volume K Tons Forecast, by Country 2019 & 2032
- Table 63: China Opaque Polymers Market Revenue (Million) Forecast, by Application 2019 & 2032
- Table 64: China Opaque Polymers Market Volume (K Tons) Forecast, by Application 2019 & 2032
- Table 65: India Opaque Polymers Market Revenue (Million) Forecast, by Application 2019 & 2032
- Table 66: India Opaque Polymers Market Volume (K Tons) Forecast, by Application 2019 & 2032
- Table 67: Japan Opaque Polymers Market Revenue (Million) Forecast, by Application 2019 & 2032
- Table 68: Japan Opaque Polymers Market Volume (K Tons) Forecast, by Application 2019 & 2032
- Table 69: South Korea Opaque Polymers Market Revenue (Million) Forecast, by Application 2019 & 2032
- Table 70: South Korea Opaque Polymers Market Volume (K Tons) Forecast, by Application 2019 & 2032
- Table 71: Rest of Asia Pacific Opaque Polymers Market Revenue (Million) Forecast, by Application 2019 & 2032
- Table 72: Rest of Asia Pacific Opaque Polymers Market Volume (K Tons) Forecast, by Application 2019 & 2032
- Table 73: Global Opaque Polymers Market Revenue Million Forecast, by Application 2019 & 2032
- Table 74: Global Opaque Polymers Market Volume K Tons Forecast, by Application 2019 & 2032
- Table 75: Global Opaque Polymers Market Revenue Million Forecast, by Country 2019 & 2032
- Table 76: Global Opaque Polymers Market Volume K Tons Forecast, by Country 2019 & 2032
- Table 77: United States Opaque Polymers Market Revenue (Million) Forecast, by Application 2019 & 2032
- Table 78: United States Opaque Polymers Market Volume (K Tons) Forecast, by Application 2019 & 2032
- Table 79: Canada Opaque Polymers Market Revenue (Million) Forecast, by Application 2019 & 2032
- Table 80: Canada Opaque Polymers Market Volume (K Tons) Forecast, by Application 2019 & 2032
- Table 81: Rest of North America Opaque Polymers Market Revenue (Million) Forecast, by Application 2019 & 2032
- Table 82: Rest of North America Opaque Polymers Market Volume (K Tons) Forecast, by Application 2019 & 2032
- Table 83: Global Opaque Polymers Market Revenue Million Forecast, by Application 2019 & 2032
- Table 84: Global Opaque Polymers Market Volume K Tons Forecast, by Application 2019 & 2032
- Table 85: Global Opaque Polymers Market Revenue Million Forecast, by Country 2019 & 2032
- Table 86: Global Opaque Polymers Market Volume K Tons Forecast, by Country 2019 & 2032
- Table 87: Germany Opaque Polymers Market Revenue (Million) Forecast, by Application 2019 & 2032
- Table 88: Germany Opaque Polymers Market Volume (K Tons) Forecast, by Application 2019 & 2032
- Table 89: United Kingdom Opaque Polymers Market Revenue (Million) Forecast, by Application 2019 & 2032
- Table 90: United Kingdom Opaque Polymers Market Volume (K Tons) Forecast, by Application 2019 & 2032
- Table 91: Spain Opaque Polymers Market Revenue (Million) Forecast, by Application 2019 & 2032
- Table 92: Spain Opaque Polymers Market Volume (K Tons) Forecast, by Application 2019 & 2032
- Table 93: Italy Opaque Polymers Market Revenue (Million) Forecast, by Application 2019 & 2032
- Table 94: Italy Opaque Polymers Market Volume (K Tons) Forecast, by Application 2019 & 2032
- Table 95: Rest of Europe Opaque Polymers Market Revenue (Million) Forecast, by Application 2019 & 2032
- Table 96: Rest of Europe Opaque Polymers Market Volume (K Tons) Forecast, by Application 2019 & 2032
- Table 97: Global Opaque Polymers Market Revenue Million Forecast, by Application 2019 & 2032
- Table 98: Global Opaque Polymers Market Volume K Tons Forecast, by Application 2019 & 2032
- Table 99: Global Opaque Polymers Market Revenue Million Forecast, by Country 2019 & 2032
- Table 100: Global Opaque Polymers Market Volume K Tons Forecast, by Country 2019 & 2032
- Table 101: South America Opaque Polymers Market Revenue (Million) Forecast, by Application 2019 & 2032
- Table 102: South America Opaque Polymers Market Volume (K Tons) Forecast, by Application 2019 & 2032
- Table 103: Middle East and Africa Opaque Polymers Market Revenue (Million) Forecast, by Application 2019 & 2032
- Table 104: Middle East and Africa Opaque Polymers Market Volume (K Tons) Forecast, by Application 2019 & 2032
Frequently Asked Questions
1. What is the projected Compound Annual Growth Rate (CAGR) of the Opaque Polymers Market?
The projected CAGR is approximately > 9.00%.
2. Which companies are prominent players in the Opaque Polymers Market?
Key companies in the market include Arkema, Paras Enterprises, Organik Kimya, Ashland, Dow, En-Tech Polymer Co Ltd, Pexi Chem Private Limited, Visen Industries Limited, HANKUCK LATICES Co Ltd, Zschimmer & Schwarz.
3. What are the main segments of the Opaque Polymers Market?
The market segments include Application.
4. Can you provide details about the market size?
The market size is estimated to be USD XX Million as of 2022.
5. What are some drivers contributing to market growth?
; High Cost and Increasing Need for Scattering Efficiency in Titanium Dioxide Pigment; Rising Demand for Architectural Paints & Coatings.
6. What are the notable trends driving market growth?
Growing Demand from Paints & Coatings Segment.
7. Are there any restraints impacting market growth?
; Less Hiding Power than Titanium Dioxide; Other Restraints.
8. Can you provide examples of recent developments in the market?
N/A
9. What pricing options are available for accessing the report?
Pricing options include single-user, multi-user, and enterprise licenses priced at USD 4750, USD 5250, and USD 8750 respectively.
10. Is the market size provided in terms of value or volume?
The market size is provided in terms of value, measured in Million and volume, measured in K Tons.
11. Are there any specific market keywords associated with the report?
Yes, the market keyword associated with the report is "Opaque Polymers Market," which aids in identifying and referencing the specific market segment covered.
12. How do I determine which pricing option suits my needs best?
The pricing options vary based on user requirements and access needs. Individual users may opt for single-user licenses, while businesses requiring broader access may choose multi-user or enterprise licenses for cost-effective access to the report.
13. Are there any additional resources or data provided in the Opaque Polymers Market report?
While the report offers comprehensive insights, it's advisable to review the specific contents or supplementary materials provided to ascertain if additional resources or data are available.
14. How can I stay updated on further developments or reports in the Opaque Polymers Market?
To stay informed about further developments, trends, and reports in the Opaque Polymers Market, consider subscribing to industry newsletters, following relevant companies and organizations, or regularly checking reputable industry news sources and publications.
Methodology
Step 1 - Identification of Relevant Samples Size from Population Database


Step 2 - Approaches for Defining Global Market Size (Value, Volume* & Price*)

Note*: In applicable scenarios
Step 3 - Data Sources
Primary Research
- Web Analytics
- Survey Reports
- Research Institute
- Latest Research Reports
- Opinion Leaders
Secondary Research
- Annual Reports
- White Paper
- Latest Press Release
- Industry Association
- Paid Database
- Investor Presentations

Step 4 - Data Triangulation
Involves using different sources of information in order to increase the validity of a study
These sources are likely to be stakeholders in a program - participants, other researchers, program staff, other community members, and so on.
Then we put all data in single framework & apply various statistical tools to find out the dynamic on the market.
During the analysis stage, feedback from the stakeholder groups would be compared to determine areas of agreement as well as areas of divergence


