

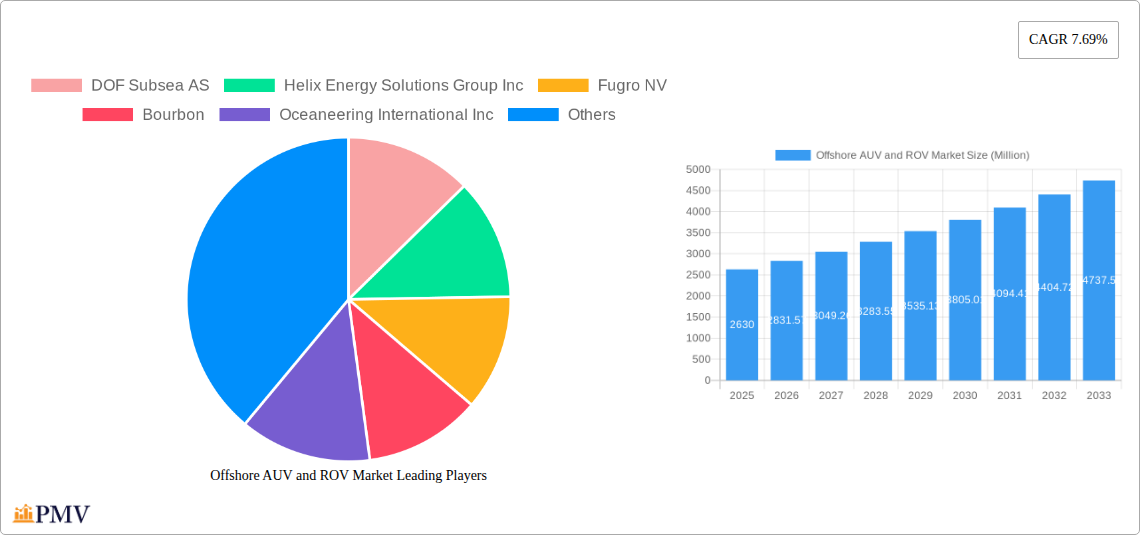
Key Insights
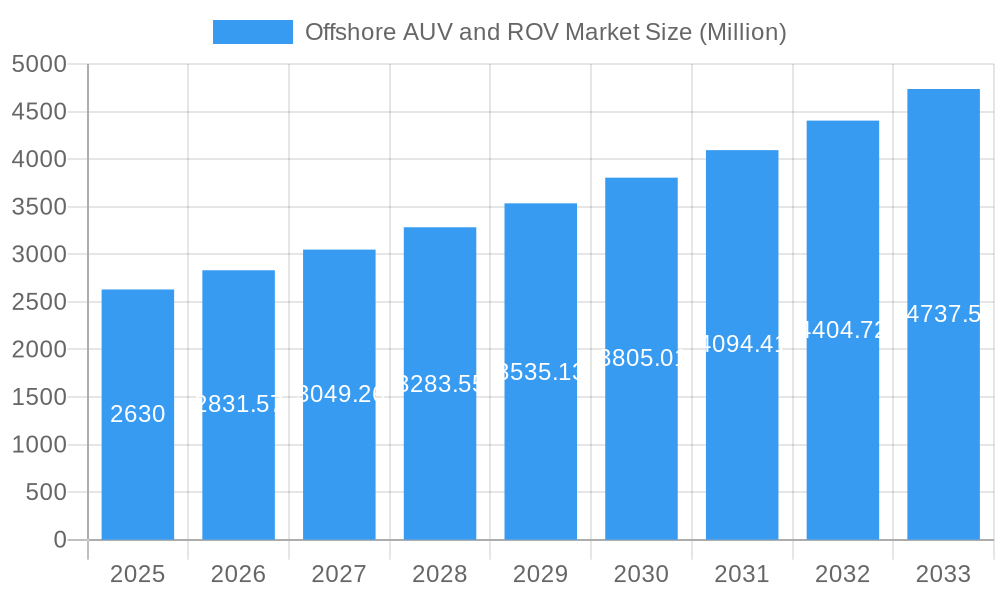
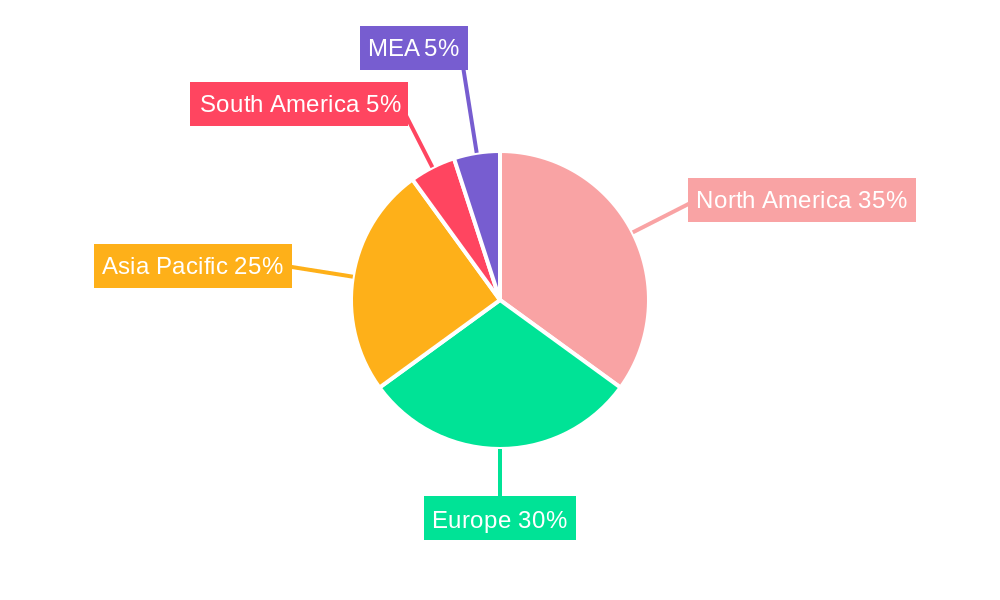
The offshore AUV and ROV market is experiencing robust growth, projected to reach a market size of $2.63 billion in 2025, expanding at a compound annual growth rate (CAGR) of 7.69% from 2025 to 2033. This growth is fueled by several key drivers. The increasing demand for subsea infrastructure development in the oil and gas sector, particularly in deepwater exploration and production, is a major catalyst. Furthermore, the rising adoption of AUVs and ROVs for inspection, repair, and maintenance (IRM) activities, driven by the need for cost-effective and efficient subsea operations, significantly contributes to market expansion. The growing focus on subsea asset integrity management and the increasing complexity of subsea operations necessitate the use of these advanced technologies. The defense and research sectors also contribute to market growth, with ongoing investment in autonomous underwater vehicles for surveillance, exploration, and scientific research. Market segmentation reveals a strong demand across various vehicle types (ROVs and AUVs), vehicle classes (work-class, heavy work-class, observatory-class), and end-user applications (oil and gas, defense, research). Geographic analysis indicates significant market presence in North America and Europe, but the Asia-Pacific region is projected to witness rapid growth due to rising offshore energy exploration and infrastructure development.
Offshore AUV and ROV Market Market Size (In Billion)
The competitive landscape is characterized by a mix of established players and emerging technology companies. Major industry participants include DOF Subsea AS, Helix Energy Solutions Group Inc., Fugro NV, Bourbon, Oceaneering International Inc., Saipem SpA, DeepOcean AS, Subsea 7 SA, and Teledyne Technologies Incorporated, each offering a range of specialized vehicles and services. However, technological advancements, such as improved sensor technology, increased autonomy, and enhanced navigation capabilities, are continuously shaping the market. This leads to a dynamic environment where innovation and technological superiority are key competitive advantages. Despite the positive outlook, challenges remain, including high initial investment costs, operational complexities, and the need for skilled personnel to operate and maintain these sophisticated systems. Nevertheless, the long-term growth prospects for the offshore AUV and ROV market remain very positive, driven by sustained investments in offshore energy exploration, and the ongoing demand for efficient and reliable subsea operations.
Offshore AUV and ROV Market Company Market Share
Offshore AUV and ROV Market: A Comprehensive Report (2019-2033)
This in-depth report provides a comprehensive analysis of the offshore AUV and ROV market, offering valuable insights for industry stakeholders, investors, and researchers. Covering the period from 2019 to 2033, with a base year of 2025, this study forecasts market growth and explores key trends shaping this dynamic sector. The report meticulously analyzes market size, segmentation, competitive landscape, and future outlook, providing actionable intelligence to navigate the complexities of this rapidly evolving market. The total market value is predicted to reach xx Million by 2033.
Offshore AUV and ROV Market Market Structure & Competitive Dynamics
The offshore AUV and ROV market is characterized by a moderately concentrated structure, with several major global players holding significant market share. Key industry leaders include DOF Subsea AS, Helix Energy Solutions Group Inc, Fugro NV, Bourbon, Oceaneering International Inc, Saipem SpA, DeepOcean AS, Subsea 7 SA, Teledyne Technologies Incorporated, and TechnipFMC PLC. However, the market also boasts a robust ecosystem of smaller, highly specialized companies, each contributing unique capabilities and fostering a dynamic and competitive landscape. This blend of large enterprises and niche specialists ensures continuous innovation and a responsive market.
Market share is strategically influenced by a confluence of factors: groundbreaking technological advancements, superior operational capabilities demonstrated in challenging environments, extensive geographical reach, and the securing of long-term, high-value contracts. Recent mergers and acquisitions (M&A) activity, although specific deal values are not always publicly disclosed (estimated total value for the analyzed period at XX Million), highlight a clear trend towards consolidation and strategic expansion, aimed at enhancing market presence and service portfolios. Stringent regulatory frameworks, particularly those prioritizing safety protocols and environmental protection, are pivotal in shaping operational standards and market dynamics. While emerging product substitutes, such as advanced autonomous underwater vehicles (AUVs) with enhanced drone-like functionalities, are appearing, they have not yet significantly diminished the market dominance of traditional AUVs and ROVs. Current end-user trends strongly favor automation and data-driven decision-making, directly fueling the demand for sophisticated, technologically advanced underwater systems that offer unparalleled efficiency and insight.
- Market Concentration: Moderately concentrated, featuring several dominant global players alongside a vibrant segment of specialized firms.
- Innovation Ecosystems: Highly active and continuously evolving, driven by relentless development of cutting-edge technologies and advanced functionalities.
- Regulatory Frameworks: Increasingly stringent and comprehensive, with a paramount focus on ensuring the highest levels of safety and robust environmental stewardship.
- Product Substitutes: Emerging technologies show promise but currently exert limited impact on the established market position of AUVs and ROVs.
- End-User Trends: A pronounced shift towards greater automation, sophisticated data analytics, and intelligent operational solutions is a key market driver.
- M&A Activities: Ongoing consolidation and strategic acquisitions are evident, signaling industry maturation and a drive for enhanced competitive advantage (estimated deal value in the period at XX Million).
Offshore AUV and ROV Market Industry Trends & Insights
The offshore AUV and ROV market is experiencing robust growth, driven by increasing demand from the oil and gas sector, expanding applications in defense and research, and technological advancements. The Compound Annual Growth Rate (CAGR) during the forecast period (2025-2033) is estimated at xx%. Market penetration is increasing across various segments, particularly in deepwater operations and complex subsea installations. Technological disruptions, such as the development of autonomous systems and advanced sensor technologies, are reshaping market dynamics. Consumer preferences are shifting towards more efficient, reliable, and environmentally friendly solutions. Competitive dynamics are characterized by intense rivalry among major players, with a focus on innovation, cost optimization, and service diversification. The increasing adoption of AI and machine learning in AUV and ROV operations is expected to further fuel market growth. The global market size for 2025 is estimated to be xx Million.
Dominant Markets & Segments in Offshore AUV and ROV Market
The oil and gas industry remains the dominant end-user application for offshore AUV and ROVs, driving a significant portion of market demand. Geographically, the market is concentrated in regions with significant offshore oil and gas activities, such as North America, Europe, and Asia-Pacific. Within vehicle types, ROVs currently hold a larger market share compared to AUVs, although the latter is experiencing faster growth due to advancements in autonomy and sensor capabilities.
- Leading Region: North America (xx Million)
- Leading Country: United States (xx Million)
- Dominant Vehicle Type: ROVs (xx Million)
- Dominant Vehicle Class: Work-class vehicles (xx Million)
- Dominant End-User Application: Oil and Gas (xx Million)
- Dominant Activity: Inspection, Repair, and Maintenance (IRM) (xx Million)
Key Drivers:
- Oil and Gas Exploration and Production: Continued investment in offshore oil and gas exploration and production projects fuels demand.
- Technological Advancements: Developments in autonomy, sensor technologies, and communication systems drive market expansion.
- Government Regulations and Policies: Government support for marine research and defense applications further stimulate market growth.
- Infrastructure Development: Expanding offshore infrastructure projects provide opportunities for AUV and ROV deployment.
Offshore AUV and ROV Market Product Innovations
Recent product developments in the offshore AUV and ROV market are charting a course toward unprecedented levels of autonomy, significantly enhanced sensor capabilities, superior maneuverability in complex subsea terrains, and greatly improved operational efficiency. These cutting-edge innovations are pivotal in enabling more intricate underwater missions, facilitating the acquisition of richer and more precise data, and ultimately reducing overall operational expenditures. The integration of artificial intelligence (AI) and machine learning algorithms is a cornerstone in the development of more intelligent, adaptive, and autonomous systems. This technological evolution directly translates into a superior market fit by offering enhanced safety for personnel and equipment, improved operational efficiency, and a minimized environmental footprint for critical subsea operations across various industries.
Report Segmentation & Scope
This comprehensive report meticulously segments the offshore AUV and ROV market based on critical parameters including vehicle type (ROV, AUV), vehicle class (work-class, heavy work-class, observatory-class), key end-user applications (oil and gas, defense, scientific research, and other emerging sectors), and primary operational activities (drilling and development, construction, inspection, repair, and maintenance (IRM), decommissioning, and other specialized services). Each meticulously defined segment's growth projections, current market sizes, and specific competitive dynamics are analyzed in granular detail. The report forecasts substantial growth across all identified segments, propelled by ongoing technological advancements and escalating demand from a diverse range of industrial sectors. The market size for each segment is projected to experience significant expansion by the year 2033.
Key Drivers of Offshore AUV and ROV Market Growth
Several key factors fuel the growth of the offshore AUV and ROV market. These include the increasing demand for subsea operations in the oil and gas industry, particularly in deepwater exploration; the rising adoption of AUVs and ROVs in defense and research applications; the continuous development of advanced technologies, including autonomy, AI, and improved sensor capabilities; and favorable government regulations and policies that promote the adoption of advanced underwater technologies. The cost-effectiveness and improved operational efficiency offered by these technologies are also contributing factors.
Challenges in the Offshore AUV and ROV Market Sector
The offshore AUV and ROV market is not without its inherent challenges. These include the substantial upfront investment costs associated with acquiring and maintaining advanced subsea technology, coupled with increasingly stringent regulatory requirements that can add complexity and cost to operational planning and execution. The persistent need for highly specialized and skilled personnel to operate and maintain these sophisticated systems also presents a hurdle. Furthermore, potential supply chain disruptions, particularly in specialized components, can impact project timelines and operational readiness. The intense competition among a growing number of industry players necessitates continuous, rapid innovation to maintain a competitive edge and secure market share. Finally, inherent technological limitations and the sheer complexity of the underwater environment can present unforeseen operational challenges, potentially impacting project timelines, budgets, and overall market growth trajectory.
Leading Players in the Offshore AUV and ROV Market Market
- DOF Subsea AS
- Helix Energy Solutions Group Inc
- Fugro NV
- Bourbon
- Oceaneering International Inc
- Saipem SpA
- DeepOcean AS
- Subsea 7 SA
- Teledyne Technologies Incorporated
- TechnipFMC PLC
Key Developments in Offshore AUV and ROV Market Sector
Jan 2024: DeepTech secured a three-year contract with BP Plc for ROV services in Egypt, showcasing the growing demand for ROVs in offshore oil and gas operations. This deal demonstrates a significant commitment to ROV technology in long-term projects.
Oct 2022: Oceaneering's substantial USD 300 Million contract win highlights the significant market for ROV and AUV services related to subsea construction, intervention, and equipment support. This underscores the increasing integration of AUV capabilities alongside traditional ROV services.
May 2022: Gujarat Police's adoption of ROVs for underwater recovery operations showcases the expanding applications beyond the traditional oil and gas sector, opening new market opportunities in law enforcement and public safety.
Strategic Offshore AUV and ROV Market Market Outlook
The future of the offshore AUV and ROV market is promising, with significant growth potential driven by technological advancements, increasing demand from diverse sectors, and ongoing investments in offshore infrastructure. Strategic opportunities exist for companies that can develop innovative and cost-effective solutions, catering to the growing demand for automation, data-driven insights, and environmentally friendly technologies. Focusing on expanding into new applications, enhancing operational efficiency, and strategic partnerships will be critical for success in this evolving market.
Offshore AUV and ROV Market Segmentation
-
1. Vehicle Type
- 1.1. ROV
- 1.2. AUV
-
2. Vehicle Class
-
2.1. Work-class Vehicle
- 2.1.1. Light Work-class Vehicle
- 2.1.2. Medium Work-class Vehicle
- 2.1.3. Heavy Work-class Vehicle
- 2.2. Observatory-class Vehicles
-
2.1. Work-class Vehicle
-
3. End-user Application
- 3.1. Oil and Gas
- 3.2. Defense
- 3.3. Research
- 3.4. Other End-user Applications
-
4. Activity
- 4.1. Drilling and Development
- 4.2. Construction
- 4.3. Inspection, Repair, and Maintenance
- 4.4. Decommissioning
- 4.5. Other Activities
Offshore AUV and ROV Market Segmentation By Geography
-
1. North America
- 1.1. United States
- 1.2. Canada
- 1.3. Mexico
-
2. Europe
- 2.1. Germany
- 2.2. United Kingdom
- 2.3. Denmark
- 2.4. Norway
- 2.5. Russia
- 2.6. France
- 2.7. Rest of Europe
-
3. Asia Pacific
- 3.1. China
- 3.2. India
- 3.3. ASEAN Countries
- 3.4. Rest of Asia Pacific
-
4. South America
- 4.1. Brazil
- 4.2. Venezuela
- 4.3. Argentina
- 4.4. Colombia
- 4.5. Rest of South America
-
5. Middle East and Africa
- 5.1. Saudi Arabia
- 5.2. United Arab Emirates
- 5.3. Qatar
- 5.4. Nigeria
- 5.5. Rest of Middle East and Africa
Offshore AUV and ROV Market Regional Market Share
Geographic Coverage of Offshore AUV and ROV Market
Offshore AUV and ROV Market REPORT HIGHLIGHTS
| Aspects | Details |
|---|---|
| Study Period | 2020-2034 |
| Base Year | 2025 |
| Estimated Year | 2026 |
| Forecast Period | 2026-2034 |
| Historical Period | 2020-2025 |
| Growth Rate | CAGR of 7.69% from 2020-2034 |
| Segmentation |
|
Table of Contents
- 1. Introduction
- 1.1. Research Scope
- 1.2. Market Segmentation
- 1.3. Research Objective
- 1.4. Definitions and Assumptions
- 2. Executive Summary
- 2.1. Market Snapshot
- 3. Market Dynamics
- 3.1. Market Drivers
- 3.2. Market Restrains
- 3.3. Market Trends
- 3.4. Market Opportunities
- 4. Market Factor Analysis
- 4.1. Porters Five Forces
- 4.1.1. Bargaining Power of Suppliers
- 4.1.2. Bargaining Power of Buyers
- 4.1.3. Threat of New Entrants
- 4.1.4. Threat of Substitutes
- 4.1.5. Competitive Rivalry
- 4.2. PESTEL analysis
- 4.3. BCG Analysis
- 4.3.1. Stars (High Growth, High Market Share)
- 4.3.2. Cash Cows (Low Growth, High Market Share)
- 4.3.3. Question Mark (High Growth, Low Market Share)
- 4.3.4. Dogs (Low Growth, Low Market Share)
- 4.4. Ansoff Matrix Analysis
- 4.5. Supply Chain Analysis
- 4.6. Regulatory Landscape
- 4.7. Current Market Potential and Opportunity Assessment (TAM–SAM–SOM Framework)
- 4.8. PMV Analyst Note
- 4.1. Porters Five Forces
- 5. Market Analysis, Insights and Forecast 2021-2033
- 5.1. Market Analysis, Insights and Forecast - by Vehicle Type
- 5.1.1. ROV
- 5.1.2. AUV
- 5.2. Market Analysis, Insights and Forecast - by Vehicle Class
- 5.2.1. Work-class Vehicle
- 5.2.1.1. Light Work-class Vehicle
- 5.2.1.2. Medium Work-class Vehicle
- 5.2.1.3. Heavy Work-class Vehicle
- 5.2.2. Observatory-class Vehicles
- 5.2.1. Work-class Vehicle
- 5.3. Market Analysis, Insights and Forecast - by End-user Application
- 5.3.1. Oil and Gas
- 5.3.2. Defense
- 5.3.3. Research
- 5.3.4. Other End-user Applications
- 5.4. Market Analysis, Insights and Forecast - by Activity
- 5.4.1. Drilling and Development
- 5.4.2. Construction
- 5.4.3. Inspection, Repair, and Maintenance
- 5.4.4. Decommissioning
- 5.4.5. Other Activities
- 5.5. Market Analysis, Insights and Forecast - by Region
- 5.5.1. North America
- 5.5.2. Europe
- 5.5.3. Asia Pacific
- 5.5.4. South America
- 5.5.5. Middle East and Africa
- 5.1. Market Analysis, Insights and Forecast - by Vehicle Type
- 6. Global Offshore AUV and ROV Market Analysis, Insights and Forecast, 2021-2033
- 6.1. Market Analysis, Insights and Forecast - by Vehicle Type
- 6.1.1. ROV
- 6.1.2. AUV
- 6.2. Market Analysis, Insights and Forecast - by Vehicle Class
- 6.2.1. Work-class Vehicle
- 6.2.1.1. Light Work-class Vehicle
- 6.2.1.2. Medium Work-class Vehicle
- 6.2.1.3. Heavy Work-class Vehicle
- 6.2.2. Observatory-class Vehicles
- 6.2.1. Work-class Vehicle
- 6.3. Market Analysis, Insights and Forecast - by End-user Application
- 6.3.1. Oil and Gas
- 6.3.2. Defense
- 6.3.3. Research
- 6.3.4. Other End-user Applications
- 6.4. Market Analysis, Insights and Forecast - by Activity
- 6.4.1. Drilling and Development
- 6.4.2. Construction
- 6.4.3. Inspection, Repair, and Maintenance
- 6.4.4. Decommissioning
- 6.4.5. Other Activities
- 6.1. Market Analysis, Insights and Forecast - by Vehicle Type
- 7. North America Offshore AUV and ROV Market Analysis, Insights and Forecast, 2020-2032
- 7.1. Market Analysis, Insights and Forecast - by Vehicle Type
- 7.1.1. ROV
- 7.1.2. AUV
- 7.2. Market Analysis, Insights and Forecast - by Vehicle Class
- 7.2.1. Work-class Vehicle
- 7.2.1.1. Light Work-class Vehicle
- 7.2.1.2. Medium Work-class Vehicle
- 7.2.1.3. Heavy Work-class Vehicle
- 7.2.2. Observatory-class Vehicles
- 7.2.1. Work-class Vehicle
- 7.3. Market Analysis, Insights and Forecast - by End-user Application
- 7.3.1. Oil and Gas
- 7.3.2. Defense
- 7.3.3. Research
- 7.3.4. Other End-user Applications
- 7.4. Market Analysis, Insights and Forecast - by Activity
- 7.4.1. Drilling and Development
- 7.4.2. Construction
- 7.4.3. Inspection, Repair, and Maintenance
- 7.4.4. Decommissioning
- 7.4.5. Other Activities
- 7.1. Market Analysis, Insights and Forecast - by Vehicle Type
- 8. Europe Offshore AUV and ROV Market Analysis, Insights and Forecast, 2020-2032
- 8.1. Market Analysis, Insights and Forecast - by Vehicle Type
- 8.1.1. ROV
- 8.1.2. AUV
- 8.2. Market Analysis, Insights and Forecast - by Vehicle Class
- 8.2.1. Work-class Vehicle
- 8.2.1.1. Light Work-class Vehicle
- 8.2.1.2. Medium Work-class Vehicle
- 8.2.1.3. Heavy Work-class Vehicle
- 8.2.2. Observatory-class Vehicles
- 8.2.1. Work-class Vehicle
- 8.3. Market Analysis, Insights and Forecast - by End-user Application
- 8.3.1. Oil and Gas
- 8.3.2. Defense
- 8.3.3. Research
- 8.3.4. Other End-user Applications
- 8.4. Market Analysis, Insights and Forecast - by Activity
- 8.4.1. Drilling and Development
- 8.4.2. Construction
- 8.4.3. Inspection, Repair, and Maintenance
- 8.4.4. Decommissioning
- 8.4.5. Other Activities
- 8.1. Market Analysis, Insights and Forecast - by Vehicle Type
- 9. Asia Pacific Offshore AUV and ROV Market Analysis, Insights and Forecast, 2020-2032
- 9.1. Market Analysis, Insights and Forecast - by Vehicle Type
- 9.1.1. ROV
- 9.1.2. AUV
- 9.2. Market Analysis, Insights and Forecast - by Vehicle Class
- 9.2.1. Work-class Vehicle
- 9.2.1.1. Light Work-class Vehicle
- 9.2.1.2. Medium Work-class Vehicle
- 9.2.1.3. Heavy Work-class Vehicle
- 9.2.2. Observatory-class Vehicles
- 9.2.1. Work-class Vehicle
- 9.3. Market Analysis, Insights and Forecast - by End-user Application
- 9.3.1. Oil and Gas
- 9.3.2. Defense
- 9.3.3. Research
- 9.3.4. Other End-user Applications
- 9.4. Market Analysis, Insights and Forecast - by Activity
- 9.4.1. Drilling and Development
- 9.4.2. Construction
- 9.4.3. Inspection, Repair, and Maintenance
- 9.4.4. Decommissioning
- 9.4.5. Other Activities
- 9.1. Market Analysis, Insights and Forecast - by Vehicle Type
- 10. South America Offshore AUV and ROV Market Analysis, Insights and Forecast, 2020-2032
- 10.1. Market Analysis, Insights and Forecast - by Vehicle Type
- 10.1.1. ROV
- 10.1.2. AUV
- 10.2. Market Analysis, Insights and Forecast - by Vehicle Class
- 10.2.1. Work-class Vehicle
- 10.2.1.1. Light Work-class Vehicle
- 10.2.1.2. Medium Work-class Vehicle
- 10.2.1.3. Heavy Work-class Vehicle
- 10.2.2. Observatory-class Vehicles
- 10.2.1. Work-class Vehicle
- 10.3. Market Analysis, Insights and Forecast - by End-user Application
- 10.3.1. Oil and Gas
- 10.3.2. Defense
- 10.3.3. Research
- 10.3.4. Other End-user Applications
- 10.4. Market Analysis, Insights and Forecast - by Activity
- 10.4.1. Drilling and Development
- 10.4.2. Construction
- 10.4.3. Inspection, Repair, and Maintenance
- 10.4.4. Decommissioning
- 10.4.5. Other Activities
- 10.1. Market Analysis, Insights and Forecast - by Vehicle Type
- 11. Middle East and Africa Offshore AUV and ROV Market Analysis, Insights and Forecast, 2020-2032
- 11.1. Market Analysis, Insights and Forecast - by Vehicle Type
- 11.1.1. ROV
- 11.1.2. AUV
- 11.2. Market Analysis, Insights and Forecast - by Vehicle Class
- 11.2.1. Work-class Vehicle
- 11.2.1.1. Light Work-class Vehicle
- 11.2.1.2. Medium Work-class Vehicle
- 11.2.1.3. Heavy Work-class Vehicle
- 11.2.2. Observatory-class Vehicles
- 11.2.1. Work-class Vehicle
- 11.3. Market Analysis, Insights and Forecast - by End-user Application
- 11.3.1. Oil and Gas
- 11.3.2. Defense
- 11.3.3. Research
- 11.3.4. Other End-user Applications
- 11.4. Market Analysis, Insights and Forecast - by Activity
- 11.4.1. Drilling and Development
- 11.4.2. Construction
- 11.4.3. Inspection, Repair, and Maintenance
- 11.4.4. Decommissioning
- 11.4.5. Other Activities
- 11.1. Market Analysis, Insights and Forecast - by Vehicle Type
- 12. Competitive Analysis
- 12.1. Company Profiles
- 12.1.1 DOF Subsea AS
- 12.1.1.1. Company Overview
- 12.1.1.2. Products
- 12.1.1.3. Company Financials
- 12.1.1.4. SWOT Analysis
- 12.1.2 Helix Energy Solutions Group Inc
- 12.1.2.1. Company Overview
- 12.1.2.2. Products
- 12.1.2.3. Company Financials
- 12.1.2.4. SWOT Analysis
- 12.1.3 Fugro NV
- 12.1.3.1. Company Overview
- 12.1.3.2. Products
- 12.1.3.3. Company Financials
- 12.1.3.4. SWOT Analysis
- 12.1.4 Bourbon
- 12.1.4.1. Company Overview
- 12.1.4.2. Products
- 12.1.4.3. Company Financials
- 12.1.4.4. SWOT Analysis
- 12.1.5 Oceaneering International Inc
- 12.1.5.1. Company Overview
- 12.1.5.2. Products
- 12.1.5.3. Company Financials
- 12.1.5.4. SWOT Analysis
- 12.1.6 Saipem SpA
- 12.1.6.1. Company Overview
- 12.1.6.2. Products
- 12.1.6.3. Company Financials
- 12.1.6.4. SWOT Analysis
- 12.1.7 DeepOcean AS
- 12.1.7.1. Company Overview
- 12.1.7.2. Products
- 12.1.7.3. Company Financials
- 12.1.7.4. SWOT Analysis
- 12.1.8 Subsea 7 SA
- 12.1.8.1. Company Overview
- 12.1.8.2. Products
- 12.1.8.3. Company Financials
- 12.1.8.4. SWOT Analysis
- 12.1.9 Teledyne Technologies Incorporated*List Not Exhaustive
- 12.1.9.1. Company Overview
- 12.1.9.2. Products
- 12.1.9.3. Company Financials
- 12.1.9.4. SWOT Analysis
- 12.1.10 TechnipFMC PLC
- 12.1.10.1. Company Overview
- 12.1.10.2. Products
- 12.1.10.3. Company Financials
- 12.1.10.4. SWOT Analysis
- 12.1.1 DOF Subsea AS
- 12.2. Market Entropy
- 12.2.1 Company's Key Areas Served
- 12.2.2 Recent Developments
- 12.3. Company Market Share Analysis 2025
- 12.3.1 Top 5 Companies Market Share Analysis
- 12.3.2 Top 3 Companies Market Share Analysis
- 12.4. List of Potential Customers
- 13. Research Methodology
List of Figures
- Figure 1: Global Offshore AUV and ROV Market Revenue Breakdown (Million, %) by Region 2025 & 2033
- Figure 2: Global Offshore AUV and ROV Market Volume Breakdown (K Unit, %) by Region 2025 & 2033
- Figure 3: North America Offshore AUV and ROV Market Revenue (Million), by Vehicle Type 2025 & 2033
- Figure 4: North America Offshore AUV and ROV Market Volume (K Unit), by Vehicle Type 2025 & 2033
- Figure 5: North America Offshore AUV and ROV Market Revenue Share (%), by Vehicle Type 2025 & 2033
- Figure 6: North America Offshore AUV and ROV Market Volume Share (%), by Vehicle Type 2025 & 2033
- Figure 7: North America Offshore AUV and ROV Market Revenue (Million), by Vehicle Class 2025 & 2033
- Figure 8: North America Offshore AUV and ROV Market Volume (K Unit), by Vehicle Class 2025 & 2033
- Figure 9: North America Offshore AUV and ROV Market Revenue Share (%), by Vehicle Class 2025 & 2033
- Figure 10: North America Offshore AUV and ROV Market Volume Share (%), by Vehicle Class 2025 & 2033
- Figure 11: North America Offshore AUV and ROV Market Revenue (Million), by End-user Application 2025 & 2033
- Figure 12: North America Offshore AUV and ROV Market Volume (K Unit), by End-user Application 2025 & 2033
- Figure 13: North America Offshore AUV and ROV Market Revenue Share (%), by End-user Application 2025 & 2033
- Figure 14: North America Offshore AUV and ROV Market Volume Share (%), by End-user Application 2025 & 2033
- Figure 15: North America Offshore AUV and ROV Market Revenue (Million), by Activity 2025 & 2033
- Figure 16: North America Offshore AUV and ROV Market Volume (K Unit), by Activity 2025 & 2033
- Figure 17: North America Offshore AUV and ROV Market Revenue Share (%), by Activity 2025 & 2033
- Figure 18: North America Offshore AUV and ROV Market Volume Share (%), by Activity 2025 & 2033
- Figure 19: North America Offshore AUV and ROV Market Revenue (Million), by Country 2025 & 2033
- Figure 20: North America Offshore AUV and ROV Market Volume (K Unit), by Country 2025 & 2033
- Figure 21: North America Offshore AUV and ROV Market Revenue Share (%), by Country 2025 & 2033
- Figure 22: North America Offshore AUV and ROV Market Volume Share (%), by Country 2025 & 2033
- Figure 23: Europe Offshore AUV and ROV Market Revenue (Million), by Vehicle Type 2025 & 2033
- Figure 24: Europe Offshore AUV and ROV Market Volume (K Unit), by Vehicle Type 2025 & 2033
- Figure 25: Europe Offshore AUV and ROV Market Revenue Share (%), by Vehicle Type 2025 & 2033
- Figure 26: Europe Offshore AUV and ROV Market Volume Share (%), by Vehicle Type 2025 & 2033
- Figure 27: Europe Offshore AUV and ROV Market Revenue (Million), by Vehicle Class 2025 & 2033
- Figure 28: Europe Offshore AUV and ROV Market Volume (K Unit), by Vehicle Class 2025 & 2033
- Figure 29: Europe Offshore AUV and ROV Market Revenue Share (%), by Vehicle Class 2025 & 2033
- Figure 30: Europe Offshore AUV and ROV Market Volume Share (%), by Vehicle Class 2025 & 2033
- Figure 31: Europe Offshore AUV and ROV Market Revenue (Million), by End-user Application 2025 & 2033
- Figure 32: Europe Offshore AUV and ROV Market Volume (K Unit), by End-user Application 2025 & 2033
- Figure 33: Europe Offshore AUV and ROV Market Revenue Share (%), by End-user Application 2025 & 2033
- Figure 34: Europe Offshore AUV and ROV Market Volume Share (%), by End-user Application 2025 & 2033
- Figure 35: Europe Offshore AUV and ROV Market Revenue (Million), by Activity 2025 & 2033
- Figure 36: Europe Offshore AUV and ROV Market Volume (K Unit), by Activity 2025 & 2033
- Figure 37: Europe Offshore AUV and ROV Market Revenue Share (%), by Activity 2025 & 2033
- Figure 38: Europe Offshore AUV and ROV Market Volume Share (%), by Activity 2025 & 2033
- Figure 39: Europe Offshore AUV and ROV Market Revenue (Million), by Country 2025 & 2033
- Figure 40: Europe Offshore AUV and ROV Market Volume (K Unit), by Country 2025 & 2033
- Figure 41: Europe Offshore AUV and ROV Market Revenue Share (%), by Country 2025 & 2033
- Figure 42: Europe Offshore AUV and ROV Market Volume Share (%), by Country 2025 & 2033
- Figure 43: Asia Pacific Offshore AUV and ROV Market Revenue (Million), by Vehicle Type 2025 & 2033
- Figure 44: Asia Pacific Offshore AUV and ROV Market Volume (K Unit), by Vehicle Type 2025 & 2033
- Figure 45: Asia Pacific Offshore AUV and ROV Market Revenue Share (%), by Vehicle Type 2025 & 2033
- Figure 46: Asia Pacific Offshore AUV and ROV Market Volume Share (%), by Vehicle Type 2025 & 2033
- Figure 47: Asia Pacific Offshore AUV and ROV Market Revenue (Million), by Vehicle Class 2025 & 2033
- Figure 48: Asia Pacific Offshore AUV and ROV Market Volume (K Unit), by Vehicle Class 2025 & 2033
- Figure 49: Asia Pacific Offshore AUV and ROV Market Revenue Share (%), by Vehicle Class 2025 & 2033
- Figure 50: Asia Pacific Offshore AUV and ROV Market Volume Share (%), by Vehicle Class 2025 & 2033
- Figure 51: Asia Pacific Offshore AUV and ROV Market Revenue (Million), by End-user Application 2025 & 2033
- Figure 52: Asia Pacific Offshore AUV and ROV Market Volume (K Unit), by End-user Application 2025 & 2033
- Figure 53: Asia Pacific Offshore AUV and ROV Market Revenue Share (%), by End-user Application 2025 & 2033
- Figure 54: Asia Pacific Offshore AUV and ROV Market Volume Share (%), by End-user Application 2025 & 2033
- Figure 55: Asia Pacific Offshore AUV and ROV Market Revenue (Million), by Activity 2025 & 2033
- Figure 56: Asia Pacific Offshore AUV and ROV Market Volume (K Unit), by Activity 2025 & 2033
- Figure 57: Asia Pacific Offshore AUV and ROV Market Revenue Share (%), by Activity 2025 & 2033
- Figure 58: Asia Pacific Offshore AUV and ROV Market Volume Share (%), by Activity 2025 & 2033
- Figure 59: Asia Pacific Offshore AUV and ROV Market Revenue (Million), by Country 2025 & 2033
- Figure 60: Asia Pacific Offshore AUV and ROV Market Volume (K Unit), by Country 2025 & 2033
- Figure 61: Asia Pacific Offshore AUV and ROV Market Revenue Share (%), by Country 2025 & 2033
- Figure 62: Asia Pacific Offshore AUV and ROV Market Volume Share (%), by Country 2025 & 2033
- Figure 63: South America Offshore AUV and ROV Market Revenue (Million), by Vehicle Type 2025 & 2033
- Figure 64: South America Offshore AUV and ROV Market Volume (K Unit), by Vehicle Type 2025 & 2033
- Figure 65: South America Offshore AUV and ROV Market Revenue Share (%), by Vehicle Type 2025 & 2033
- Figure 66: South America Offshore AUV and ROV Market Volume Share (%), by Vehicle Type 2025 & 2033
- Figure 67: South America Offshore AUV and ROV Market Revenue (Million), by Vehicle Class 2025 & 2033
- Figure 68: South America Offshore AUV and ROV Market Volume (K Unit), by Vehicle Class 2025 & 2033
- Figure 69: South America Offshore AUV and ROV Market Revenue Share (%), by Vehicle Class 2025 & 2033
- Figure 70: South America Offshore AUV and ROV Market Volume Share (%), by Vehicle Class 2025 & 2033
- Figure 71: South America Offshore AUV and ROV Market Revenue (Million), by End-user Application 2025 & 2033
- Figure 72: South America Offshore AUV and ROV Market Volume (K Unit), by End-user Application 2025 & 2033
- Figure 73: South America Offshore AUV and ROV Market Revenue Share (%), by End-user Application 2025 & 2033
- Figure 74: South America Offshore AUV and ROV Market Volume Share (%), by End-user Application 2025 & 2033
- Figure 75: South America Offshore AUV and ROV Market Revenue (Million), by Activity 2025 & 2033
- Figure 76: South America Offshore AUV and ROV Market Volume (K Unit), by Activity 2025 & 2033
- Figure 77: South America Offshore AUV and ROV Market Revenue Share (%), by Activity 2025 & 2033
- Figure 78: South America Offshore AUV and ROV Market Volume Share (%), by Activity 2025 & 2033
- Figure 79: South America Offshore AUV and ROV Market Revenue (Million), by Country 2025 & 2033
- Figure 80: South America Offshore AUV and ROV Market Volume (K Unit), by Country 2025 & 2033
- Figure 81: South America Offshore AUV and ROV Market Revenue Share (%), by Country 2025 & 2033
- Figure 82: South America Offshore AUV and ROV Market Volume Share (%), by Country 2025 & 2033
- Figure 83: Middle East and Africa Offshore AUV and ROV Market Revenue (Million), by Vehicle Type 2025 & 2033
- Figure 84: Middle East and Africa Offshore AUV and ROV Market Volume (K Unit), by Vehicle Type 2025 & 2033
- Figure 85: Middle East and Africa Offshore AUV and ROV Market Revenue Share (%), by Vehicle Type 2025 & 2033
- Figure 86: Middle East and Africa Offshore AUV and ROV Market Volume Share (%), by Vehicle Type 2025 & 2033
- Figure 87: Middle East and Africa Offshore AUV and ROV Market Revenue (Million), by Vehicle Class 2025 & 2033
- Figure 88: Middle East and Africa Offshore AUV and ROV Market Volume (K Unit), by Vehicle Class 2025 & 2033
- Figure 89: Middle East and Africa Offshore AUV and ROV Market Revenue Share (%), by Vehicle Class 2025 & 2033
- Figure 90: Middle East and Africa Offshore AUV and ROV Market Volume Share (%), by Vehicle Class 2025 & 2033
- Figure 91: Middle East and Africa Offshore AUV and ROV Market Revenue (Million), by End-user Application 2025 & 2033
- Figure 92: Middle East and Africa Offshore AUV and ROV Market Volume (K Unit), by End-user Application 2025 & 2033
- Figure 93: Middle East and Africa Offshore AUV and ROV Market Revenue Share (%), by End-user Application 2025 & 2033
- Figure 94: Middle East and Africa Offshore AUV and ROV Market Volume Share (%), by End-user Application 2025 & 2033
- Figure 95: Middle East and Africa Offshore AUV and ROV Market Revenue (Million), by Activity 2025 & 2033
- Figure 96: Middle East and Africa Offshore AUV and ROV Market Volume (K Unit), by Activity 2025 & 2033
- Figure 97: Middle East and Africa Offshore AUV and ROV Market Revenue Share (%), by Activity 2025 & 2033
- Figure 98: Middle East and Africa Offshore AUV and ROV Market Volume Share (%), by Activity 2025 & 2033
- Figure 99: Middle East and Africa Offshore AUV and ROV Market Revenue (Million), by Country 2025 & 2033
- Figure 100: Middle East and Africa Offshore AUV and ROV Market Volume (K Unit), by Country 2025 & 2033
- Figure 101: Middle East and Africa Offshore AUV and ROV Market Revenue Share (%), by Country 2025 & 2033
- Figure 102: Middle East and Africa Offshore AUV and ROV Market Volume Share (%), by Country 2025 & 2033
List of Tables
- Table 1: Global Offshore AUV and ROV Market Revenue Million Forecast, by Vehicle Type 2020 & 2033
- Table 2: Global Offshore AUV and ROV Market Volume K Unit Forecast, by Vehicle Type 2020 & 2033
- Table 3: Global Offshore AUV and ROV Market Revenue Million Forecast, by Vehicle Class 2020 & 2033
- Table 4: Global Offshore AUV and ROV Market Volume K Unit Forecast, by Vehicle Class 2020 & 2033
- Table 5: Global Offshore AUV and ROV Market Revenue Million Forecast, by End-user Application 2020 & 2033
- Table 6: Global Offshore AUV and ROV Market Volume K Unit Forecast, by End-user Application 2020 & 2033
- Table 7: Global Offshore AUV and ROV Market Revenue Million Forecast, by Activity 2020 & 2033
- Table 8: Global Offshore AUV and ROV Market Volume K Unit Forecast, by Activity 2020 & 2033
- Table 9: Global Offshore AUV and ROV Market Revenue Million Forecast, by Region 2020 & 2033
- Table 10: Global Offshore AUV and ROV Market Volume K Unit Forecast, by Region 2020 & 2033
- Table 11: Global Offshore AUV and ROV Market Revenue Million Forecast, by Vehicle Type 2020 & 2033
- Table 12: Global Offshore AUV and ROV Market Volume K Unit Forecast, by Vehicle Type 2020 & 2033
- Table 13: Global Offshore AUV and ROV Market Revenue Million Forecast, by Vehicle Class 2020 & 2033
- Table 14: Global Offshore AUV and ROV Market Volume K Unit Forecast, by Vehicle Class 2020 & 2033
- Table 15: Global Offshore AUV and ROV Market Revenue Million Forecast, by End-user Application 2020 & 2033
- Table 16: Global Offshore AUV and ROV Market Volume K Unit Forecast, by End-user Application 2020 & 2033
- Table 17: Global Offshore AUV and ROV Market Revenue Million Forecast, by Activity 2020 & 2033
- Table 18: Global Offshore AUV and ROV Market Volume K Unit Forecast, by Activity 2020 & 2033
- Table 19: Global Offshore AUV and ROV Market Revenue Million Forecast, by Country 2020 & 2033
- Table 20: Global Offshore AUV and ROV Market Volume K Unit Forecast, by Country 2020 & 2033
- Table 21: United States Offshore AUV and ROV Market Revenue (Million) Forecast, by Application 2020 & 2033
- Table 22: United States Offshore AUV and ROV Market Volume (K Unit) Forecast, by Application 2020 & 2033
- Table 23: Canada Offshore AUV and ROV Market Revenue (Million) Forecast, by Application 2020 & 2033
- Table 24: Canada Offshore AUV and ROV Market Volume (K Unit) Forecast, by Application 2020 & 2033
- Table 25: Mexico Offshore AUV and ROV Market Revenue (Million) Forecast, by Application 2020 & 2033
- Table 26: Mexico Offshore AUV and ROV Market Volume (K Unit) Forecast, by Application 2020 & 2033
- Table 27: Global Offshore AUV and ROV Market Revenue Million Forecast, by Vehicle Type 2020 & 2033
- Table 28: Global Offshore AUV and ROV Market Volume K Unit Forecast, by Vehicle Type 2020 & 2033
- Table 29: Global Offshore AUV and ROV Market Revenue Million Forecast, by Vehicle Class 2020 & 2033
- Table 30: Global Offshore AUV and ROV Market Volume K Unit Forecast, by Vehicle Class 2020 & 2033
- Table 31: Global Offshore AUV and ROV Market Revenue Million Forecast, by End-user Application 2020 & 2033
- Table 32: Global Offshore AUV and ROV Market Volume K Unit Forecast, by End-user Application 2020 & 2033
- Table 33: Global Offshore AUV and ROV Market Revenue Million Forecast, by Activity 2020 & 2033
- Table 34: Global Offshore AUV and ROV Market Volume K Unit Forecast, by Activity 2020 & 2033
- Table 35: Global Offshore AUV and ROV Market Revenue Million Forecast, by Country 2020 & 2033
- Table 36: Global Offshore AUV and ROV Market Volume K Unit Forecast, by Country 2020 & 2033
- Table 37: Germany Offshore AUV and ROV Market Revenue (Million) Forecast, by Application 2020 & 2033
- Table 38: Germany Offshore AUV and ROV Market Volume (K Unit) Forecast, by Application 2020 & 2033
- Table 39: United Kingdom Offshore AUV and ROV Market Revenue (Million) Forecast, by Application 2020 & 2033
- Table 40: United Kingdom Offshore AUV and ROV Market Volume (K Unit) Forecast, by Application 2020 & 2033
- Table 41: Denmark Offshore AUV and ROV Market Revenue (Million) Forecast, by Application 2020 & 2033
- Table 42: Denmark Offshore AUV and ROV Market Volume (K Unit) Forecast, by Application 2020 & 2033
- Table 43: Norway Offshore AUV and ROV Market Revenue (Million) Forecast, by Application 2020 & 2033
- Table 44: Norway Offshore AUV and ROV Market Volume (K Unit) Forecast, by Application 2020 & 2033
- Table 45: Russia Offshore AUV and ROV Market Revenue (Million) Forecast, by Application 2020 & 2033
- Table 46: Russia Offshore AUV and ROV Market Volume (K Unit) Forecast, by Application 2020 & 2033
- Table 47: France Offshore AUV and ROV Market Revenue (Million) Forecast, by Application 2020 & 2033
- Table 48: France Offshore AUV and ROV Market Volume (K Unit) Forecast, by Application 2020 & 2033
- Table 49: Rest of Europe Offshore AUV and ROV Market Revenue (Million) Forecast, by Application 2020 & 2033
- Table 50: Rest of Europe Offshore AUV and ROV Market Volume (K Unit) Forecast, by Application 2020 & 2033
- Table 51: Global Offshore AUV and ROV Market Revenue Million Forecast, by Vehicle Type 2020 & 2033
- Table 52: Global Offshore AUV and ROV Market Volume K Unit Forecast, by Vehicle Type 2020 & 2033
- Table 53: Global Offshore AUV and ROV Market Revenue Million Forecast, by Vehicle Class 2020 & 2033
- Table 54: Global Offshore AUV and ROV Market Volume K Unit Forecast, by Vehicle Class 2020 & 2033
- Table 55: Global Offshore AUV and ROV Market Revenue Million Forecast, by End-user Application 2020 & 2033
- Table 56: Global Offshore AUV and ROV Market Volume K Unit Forecast, by End-user Application 2020 & 2033
- Table 57: Global Offshore AUV and ROV Market Revenue Million Forecast, by Activity 2020 & 2033
- Table 58: Global Offshore AUV and ROV Market Volume K Unit Forecast, by Activity 2020 & 2033
- Table 59: Global Offshore AUV and ROV Market Revenue Million Forecast, by Country 2020 & 2033
- Table 60: Global Offshore AUV and ROV Market Volume K Unit Forecast, by Country 2020 & 2033
- Table 61: China Offshore AUV and ROV Market Revenue (Million) Forecast, by Application 2020 & 2033
- Table 62: China Offshore AUV and ROV Market Volume (K Unit) Forecast, by Application 2020 & 2033
- Table 63: India Offshore AUV and ROV Market Revenue (Million) Forecast, by Application 2020 & 2033
- Table 64: India Offshore AUV and ROV Market Volume (K Unit) Forecast, by Application 2020 & 2033
- Table 65: ASEAN Countries Offshore AUV and ROV Market Revenue (Million) Forecast, by Application 2020 & 2033
- Table 66: ASEAN Countries Offshore AUV and ROV Market Volume (K Unit) Forecast, by Application 2020 & 2033
- Table 67: Rest of Asia Pacific Offshore AUV and ROV Market Revenue (Million) Forecast, by Application 2020 & 2033
- Table 68: Rest of Asia Pacific Offshore AUV and ROV Market Volume (K Unit) Forecast, by Application 2020 & 2033
- Table 69: Global Offshore AUV and ROV Market Revenue Million Forecast, by Vehicle Type 2020 & 2033
- Table 70: Global Offshore AUV and ROV Market Volume K Unit Forecast, by Vehicle Type 2020 & 2033
- Table 71: Global Offshore AUV and ROV Market Revenue Million Forecast, by Vehicle Class 2020 & 2033
- Table 72: Global Offshore AUV and ROV Market Volume K Unit Forecast, by Vehicle Class 2020 & 2033
- Table 73: Global Offshore AUV and ROV Market Revenue Million Forecast, by End-user Application 2020 & 2033
- Table 74: Global Offshore AUV and ROV Market Volume K Unit Forecast, by End-user Application 2020 & 2033
- Table 75: Global Offshore AUV and ROV Market Revenue Million Forecast, by Activity 2020 & 2033
- Table 76: Global Offshore AUV and ROV Market Volume K Unit Forecast, by Activity 2020 & 2033
- Table 77: Global Offshore AUV and ROV Market Revenue Million Forecast, by Country 2020 & 2033
- Table 78: Global Offshore AUV and ROV Market Volume K Unit Forecast, by Country 2020 & 2033
- Table 79: Brazil Offshore AUV and ROV Market Revenue (Million) Forecast, by Application 2020 & 2033
- Table 80: Brazil Offshore AUV and ROV Market Volume (K Unit) Forecast, by Application 2020 & 2033
- Table 81: Venezuela Offshore AUV and ROV Market Revenue (Million) Forecast, by Application 2020 & 2033
- Table 82: Venezuela Offshore AUV and ROV Market Volume (K Unit) Forecast, by Application 2020 & 2033
- Table 83: Argentina Offshore AUV and ROV Market Revenue (Million) Forecast, by Application 2020 & 2033
- Table 84: Argentina Offshore AUV and ROV Market Volume (K Unit) Forecast, by Application 2020 & 2033
- Table 85: Colombia Offshore AUV and ROV Market Revenue (Million) Forecast, by Application 2020 & 2033
- Table 86: Colombia Offshore AUV and ROV Market Volume (K Unit) Forecast, by Application 2020 & 2033
- Table 87: Rest of South America Offshore AUV and ROV Market Revenue (Million) Forecast, by Application 2020 & 2033
- Table 88: Rest of South America Offshore AUV and ROV Market Volume (K Unit) Forecast, by Application 2020 & 2033
- Table 89: Global Offshore AUV and ROV Market Revenue Million Forecast, by Vehicle Type 2020 & 2033
- Table 90: Global Offshore AUV and ROV Market Volume K Unit Forecast, by Vehicle Type 2020 & 2033
- Table 91: Global Offshore AUV and ROV Market Revenue Million Forecast, by Vehicle Class 2020 & 2033
- Table 92: Global Offshore AUV and ROV Market Volume K Unit Forecast, by Vehicle Class 2020 & 2033
- Table 93: Global Offshore AUV and ROV Market Revenue Million Forecast, by End-user Application 2020 & 2033
- Table 94: Global Offshore AUV and ROV Market Volume K Unit Forecast, by End-user Application 2020 & 2033
- Table 95: Global Offshore AUV and ROV Market Revenue Million Forecast, by Activity 2020 & 2033
- Table 96: Global Offshore AUV and ROV Market Volume K Unit Forecast, by Activity 2020 & 2033
- Table 97: Global Offshore AUV and ROV Market Revenue Million Forecast, by Country 2020 & 2033
- Table 98: Global Offshore AUV and ROV Market Volume K Unit Forecast, by Country 2020 & 2033
- Table 99: Saudi Arabia Offshore AUV and ROV Market Revenue (Million) Forecast, by Application 2020 & 2033
- Table 100: Saudi Arabia Offshore AUV and ROV Market Volume (K Unit) Forecast, by Application 2020 & 2033
- Table 101: United Arab Emirates Offshore AUV and ROV Market Revenue (Million) Forecast, by Application 2020 & 2033
- Table 102: United Arab Emirates Offshore AUV and ROV Market Volume (K Unit) Forecast, by Application 2020 & 2033
- Table 103: Qatar Offshore AUV and ROV Market Revenue (Million) Forecast, by Application 2020 & 2033
- Table 104: Qatar Offshore AUV and ROV Market Volume (K Unit) Forecast, by Application 2020 & 2033
- Table 105: Nigeria Offshore AUV and ROV Market Revenue (Million) Forecast, by Application 2020 & 2033
- Table 106: Nigeria Offshore AUV and ROV Market Volume (K Unit) Forecast, by Application 2020 & 2033
- Table 107: Rest of Middle East and Africa Offshore AUV and ROV Market Revenue (Million) Forecast, by Application 2020 & 2033
- Table 108: Rest of Middle East and Africa Offshore AUV and ROV Market Volume (K Unit) Forecast, by Application 2020 & 2033
Frequently Asked Questions
1. What is the projected Compound Annual Growth Rate (CAGR) of the Offshore AUV and ROV Market?
The projected CAGR is approximately 7.69%.
2. Which companies are prominent players in the Offshore AUV and ROV Market?
Key companies in the market include DOF Subsea AS, Helix Energy Solutions Group Inc, Fugro NV, Bourbon, Oceaneering International Inc, Saipem SpA, DeepOcean AS, Subsea 7 SA, Teledyne Technologies Incorporated*List Not Exhaustive, TechnipFMC PLC.
3. What are the main segments of the Offshore AUV and ROV Market?
The market segments include Vehicle Type, Vehicle Class, End-user Application, Activity.
4. Can you provide details about the market size?
The market size is estimated to be USD 2.63 Million as of 2022.
5. What are some drivers contributing to market growth?
4.; Increasing Offshore Oil and Gas Exploration Activities in the American. Asia-Pacific. and Middle-East and African Regions4.; Growing Offshore Renewable Technologies.
6. What are the notable trends driving market growth?
Oil and Gas Segment to Dominate the Market.
7. Are there any restraints impacting market growth?
4.; Ban on Offshore Exploration and Production Activities in Multiple Regions.
8. Can you provide examples of recent developments in the market?
Jan 2024: DeepTech won a three-year contract to provide rig support ROV services for BP Plc on the West Nile Delta development offshore Egypt. As part of the contract, two work class ROVs are provided to support the drilling, completion, and subsea activities directly on this long-term contract, which includes an option for further extension.
9. What pricing options are available for accessing the report?
Pricing options include single-user, multi-user, and enterprise licenses priced at USD 4750, USD 5250, and USD 8750 respectively.
10. Is the market size provided in terms of value or volume?
The market size is provided in terms of value, measured in Million and volume, measured in K Unit.
11. Are there any specific market keywords associated with the report?
Yes, the market keyword associated with the report is "Offshore AUV and ROV Market," which aids in identifying and referencing the specific market segment covered.
12. How do I determine which pricing option suits my needs best?
The pricing options vary based on user requirements and access needs. Individual users may opt for single-user licenses, while businesses requiring broader access may choose multi-user or enterprise licenses for cost-effective access to the report.
13. Are there any additional resources or data provided in the Offshore AUV and ROV Market report?
While the report offers comprehensive insights, it's advisable to review the specific contents or supplementary materials provided to ascertain if additional resources or data are available.
14. How can I stay updated on further developments or reports in the Offshore AUV and ROV Market?
To stay informed about further developments, trends, and reports in the Offshore AUV and ROV Market, consider subscribing to industry newsletters, following relevant companies and organizations, or regularly checking reputable industry news sources and publications.
Methodology
Step 1 - Identification of Relevant Samples Size from Population Database


Step 2 - Approaches for Defining Global Market Size (Value, Volume* & Price*)

Note*: In applicable scenarios
Step 3 - Data Sources
Primary Research
- Web Analytics
- Survey Reports
- Research Institute
- Latest Research Reports
- Opinion Leaders
Secondary Research
- Annual Reports
- White Paper
- Latest Press Release
- Industry Association
- Paid Database
- Investor Presentations

Step 4 - Data Triangulation
Involves using different sources of information in order to increase the validity of a study
These sources are likely to be stakeholders in a program - participants, other researchers, program staff, other community members, and so on.
Then we put all data in single framework & apply various statistical tools to find out the dynamic on the market.
During the analysis stage, feedback from the stakeholder groups would be compared to determine areas of agreement as well as areas of divergence