

Key Insights
The North Sea decommissioning oil rig market is experiencing robust growth, driven by the aging infrastructure of existing oil and gas platforms and increasingly stringent environmental regulations. With a Compound Annual Growth Rate (CAGR) exceeding 5%, the market, valued at an estimated $XX million in 2025, is projected to reach significant size by 2033. This expansion is fueled by several key factors. Firstly, the extensive network of mature oil and gas fields in the North Sea necessitates a considerable amount of decommissioning activity in the coming years. Secondly, governments are imposing stricter environmental standards, incentivizing the removal of obsolete platforms to mitigate environmental risks and reduce the carbon footprint. Thirdly, technological advancements in decommissioning technologies such as improved remotely operated vehicles (ROVs) and advanced dismantling techniques are making the process more efficient and cost-effective. The market is segmented by water depth, with shallow water projects currently dominating but deepwater and ultra-deepwater decommissioning gaining traction as technology advances. Key players like Aker Solutions, DNV GL, and Heerema Marine Contractors are actively involved, shaping the market through innovation and strategic partnerships. Competition is expected to intensify as new entrants emerge and existing players expand their service portfolios to cater to the growing demand. Regional analysis indicates a strong focus on the North Sea region itself, with significant contributions also expected from other European nations and potentially North America, as companies gain experience in North Sea operations and look for new opportunities.
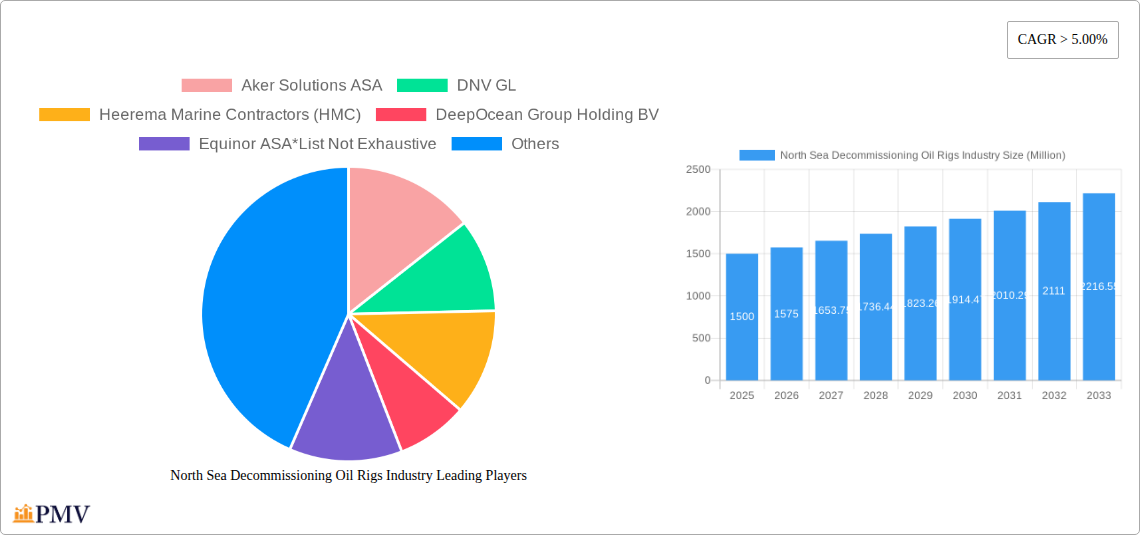
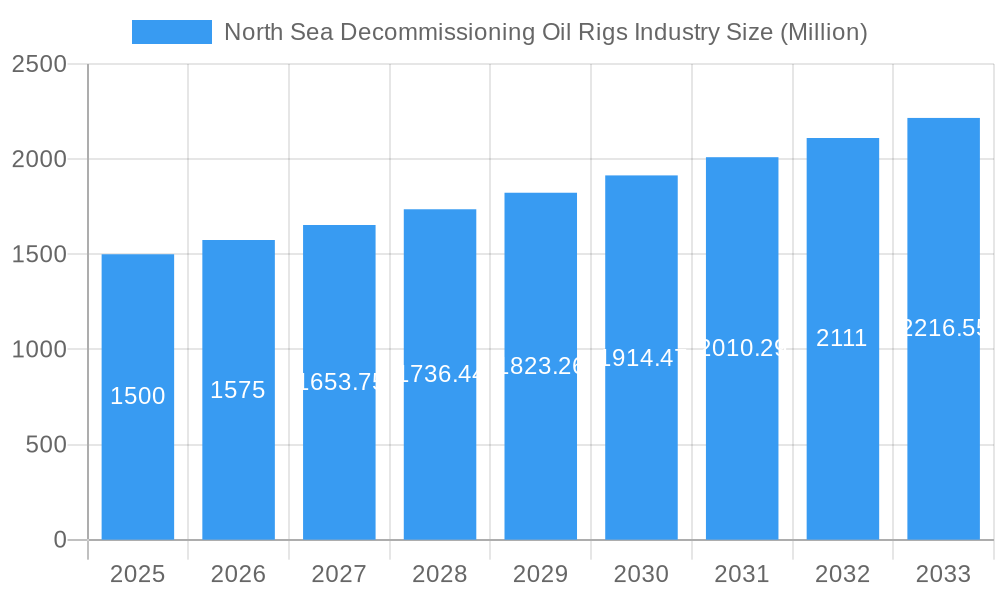
North Sea Decommissioning Oil Rigs Industry Market Size (In Billion)
The North Sea decommissioning market presents significant opportunities for companies specializing in engineering, project management, and specialized decommissioning services. While challenges exist, such as fluctuating oil prices and potential regulatory changes, the overall trend points towards sustained growth. The cost of decommissioning is substantial, placing a premium on efficient and cost-effective solutions. This is driving innovation in areas such as recycling and reuse of materials, reducing the overall environmental impact and financial burden. The geographic distribution of the market is concentrated in the North Sea, with the UK, Norway and Netherlands likely to be major contributors, alongside other areas where similar aging infrastructure exists. The success of companies in this market hinges on their ability to adapt to evolving regulatory requirements, leverage technological advancements, and maintain a strong safety record. The long-term outlook remains positive due to the inevitable need for decommissioning a large number of existing oil and gas platforms.
North Sea Decommissioning Oil Rigs Industry Company Market Share
North Sea Decommissioning Oil Rigs Industry: A Comprehensive Market Report (2019-2033)
This comprehensive report provides an in-depth analysis of the North Sea decommissioning oil rigs industry, offering crucial insights for stakeholders, investors, and industry professionals. The study period spans from 2019 to 2033, with 2025 serving as the base and estimated year. The report meticulously examines market structure, competitive dynamics, technological advancements, and future growth prospects, encompassing all key segments and players within this vital sector. The forecast period covers 2025-2033, while the historical period analyzed is 2019-2024.
Expect detailed analysis covering: Market size (in Millions), CAGR, market share, M&A activity, and key trends.
North Sea Decommissioning Oil Rigs Industry Market Structure & Competitive Dynamics
This section analyzes the market concentration, innovation ecosystems, regulatory frameworks, product substitutes, end-user trends, and M&A activities within the North Sea decommissioning oil rigs industry. The report assesses the market share held by key players, including Aker Solutions ASA, DNV GL, Heerema Marine Contractors (HMC), DeepOcean Group Holding BV, Equinor ASA, Able UK, John Wood Group PLC, TechnipFMC PLC, AF Gruppen SA, and Allseas Group (List Not Exhaustive). We evaluate the competitive landscape, identifying dominant players and analyzing their strategies. The analysis includes an examination of mergers and acquisitions (M&A) activities, quantifying deal values (in Millions) where data is available, and their impact on market consolidation. Furthermore, the regulatory environment governing decommissioning activities and its influence on market dynamics are scrutinized. The report assesses the impact of technological innovations, alternative decommissioning methods, and shifting end-user demands on the overall market structure. We project that the market will see xx Million in M&A activity in 2025, driving further consolidation.
North Sea Decommissioning Oil Rigs Industry Industry Trends & Insights
This section delves into the key drivers shaping the North Sea decommissioning oil rigs market. We examine market growth drivers, including increased regulatory pressure for responsible decommissioning, the aging North Sea oil and gas infrastructure, and technological advancements enabling more efficient and cost-effective decommissioning solutions. The report analyzes technological disruptions, such as advancements in robotics, remote operations, and specialized decommissioning vessels. Competitive dynamics, including pricing strategies, service offerings, and technological innovation, are thoroughly analyzed. We examine consumer preferences (oil and gas operators) and their influence on the demand for various decommissioning services. The report projects a CAGR of xx% for the North Sea decommissioning oil rigs market during the forecast period (2025-2033), with a market penetration of xx% by 2033. Furthermore, the impact of fluctuating oil prices and evolving environmental regulations is assessed.
Dominant Markets & Segments in North Sea Decommissioning Oil Rigs Industry
This section identifies the dominant markets and segments within the North Sea decommissioning oil rigs industry. The analysis is categorized by water depth: shallow water, deepwater, and ultra-deepwater.
Dominant Segment Analysis: (Detailed analysis will be provided in the full report)
Deepwater: This segment is expected to dominate due to factors such as (paragraphs will detail economic policies, infrastructure, technological feasibility, and existing infrastructure). The report provides a detailed analysis of the factors driving the dominance of this segment.
Shallow Water: This segment's characteristics will be examined, including economic and logistical factors influencing its performance.
Ultra-deepwater: Challenges and opportunities in this segment will be detailed, focusing on specific technological and economic considerations.
North Sea Decommissioning Oil Rigs Industry Product Innovations
The North Sea decommissioning oil rigs industry witnesses continuous product innovation. Advancements in remotely operated vehicles (ROVs), autonomous underwater vehicles (AUVs), and specialized decommissioning vessels enhance efficiency and safety. New techniques for well plugging and abandonment are also emerging, reducing environmental impact and cost. These innovations offer competitive advantages to companies offering improved services, faster turnaround times, and reduced environmental footprints, contributing to higher market demand.
Report Segmentation & Scope
The report segments the North Sea decommissioning oil rigs market based on water depth: shallow water, deepwater, and ultra-deepwater.
Shallow Water: This segment encompasses decommissioning projects in relatively shallow water depths. The report provides growth projections, market size estimations (in Millions), and an analysis of the competitive landscape within this segment.
Deepwater: This segment focuses on decommissioning activities in deeper water. Growth projections, market size, and competitive dynamics for this segment are presented in detail.
Ultra-deepwater: This section examines decommissioning in the deepest waters of the North Sea, analyzing growth potential, market size, and unique challenges and opportunities within this segment.
Key Drivers of North Sea Decommissioning Oil Rigs Industry Growth
Several factors drive the growth of the North Sea decommissioning oil rigs industry. Stringent government regulations mandating responsible decommissioning practices are a major catalyst. The aging infrastructure of existing oil and gas platforms necessitates substantial decommissioning efforts. Technological advancements, such as improved robotics and specialized vessels, lead to more efficient and cost-effective decommissioning processes. Furthermore, increasing environmental awareness and the need to mitigate environmental risks are key drivers propelling industry growth. Finally, the availability of funding and financial incentives for decommissioning projects contributes to market expansion.
Challenges in the North Sea Decommissioning Oil Rigs Industry Sector
The North Sea decommissioning industry faces several challenges. Complex regulatory frameworks and permitting processes can lead to delays and increased costs. Supply chain issues, particularly the availability of specialized equipment and skilled labor, pose significant hurdles. The intense competition among decommissioning companies exerts pressure on pricing and profitability. Furthermore, unpredictable weather conditions in the North Sea can disrupt operations and increase project timelines, thus affecting the overall cost. These factors collectively impact the industry's efficiency and profitability.
Leading Players in the North Sea Decommissioning Oil Rigs Industry Market
Key Developments in North Sea Decommissioning Oil Rigs Industry Sector
- 2022 Q4: Introduction of a new, more efficient well-plugging technique by [Company Name], significantly reducing decommissioning time.
- 2023 Q1: Merger between two major decommissioning companies, resulting in increased market share and consolidation. (Specific details and names to be provided in full report)
- 2024 Q3: Successful deployment of an advanced robotic system for underwater decommissioning, lowering operational costs. (Further details to be added)
Strategic North Sea Decommissioning Oil Rigs Industry Market Outlook
The North Sea decommissioning oil rigs market exhibits significant growth potential. Technological innovation, including automation and robotics, will further enhance efficiency and reduce costs. Stringent environmental regulations will drive demand for sustainable decommissioning solutions. Strategic partnerships and mergers & acquisitions will continue to reshape the competitive landscape, creating opportunities for both established players and new entrants. The market is projected to witness substantial growth, driven by the expanding decommissioning backlog and ongoing technological advancements. This creates substantial opportunities for companies offering innovative and cost-effective decommissioning services.
North Sea Decommissioning Oil Rigs Industry Segmentation
-
1. Water Depth
- 1.1. Shallow Water
- 1.2. Deepwater and Ultra-deepwater
-
2. Geography
- 2.1. United Kingdom
- 2.2. Norway
- 2.3. Rest of North Sea
North Sea Decommissioning Oil Rigs Industry Segmentation By Geography
- 1. United Kingdom
- 2. Norway
- 3. Rest of North Sea
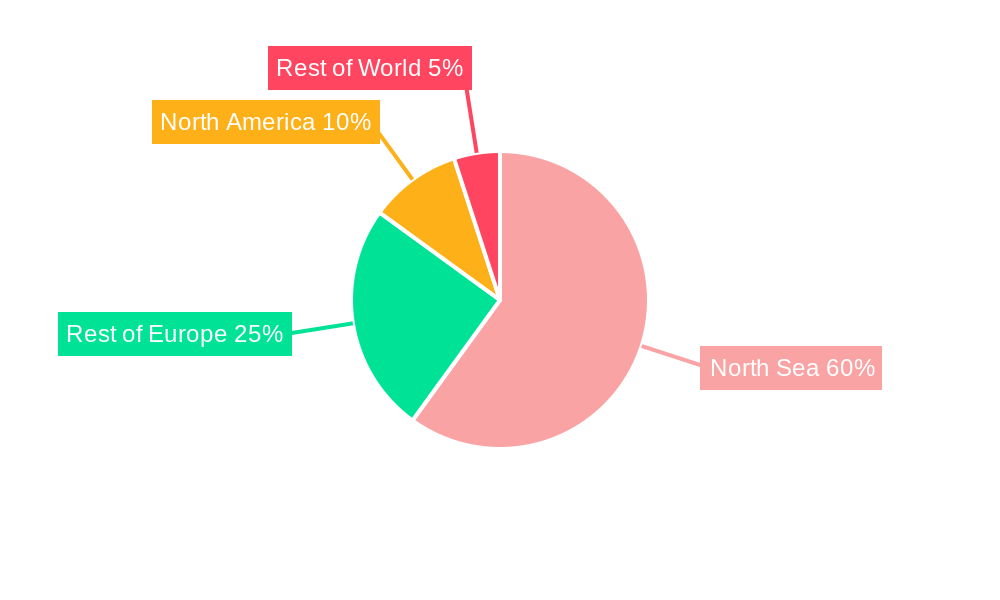
North Sea Decommissioning Oil Rigs Industry Regional Market Share
Geographic Coverage of North Sea Decommissioning Oil Rigs Industry
North Sea Decommissioning Oil Rigs Industry REPORT HIGHLIGHTS
| Aspects | Details |
|---|---|
| Study Period | 2020-2034 |
| Base Year | 2025 |
| Estimated Year | 2026 |
| Forecast Period | 2026-2034 |
| Historical Period | 2020-2025 |
| Growth Rate | CAGR of 8.2% from 2020-2034 |
| Segmentation |
|
Table of Contents
- 1. Introduction
- 1.1. Research Scope
- 1.2. Market Segmentation
- 1.3. Research Objective
- 1.4. Definitions and Assumptions
- 2. Executive Summary
- 2.1. Market Snapshot
- 3. Market Dynamics
- 3.1. Market Drivers
- 3.2. Market Restrains
- 3.3. Market Trends
- 3.4. Market Opportunities
- 4. Market Factor Analysis
- 4.1. Porters Five Forces
- 4.1.1. Bargaining Power of Suppliers
- 4.1.2. Bargaining Power of Buyers
- 4.1.3. Threat of New Entrants
- 4.1.4. Threat of Substitutes
- 4.1.5. Competitive Rivalry
- 4.2. PESTEL analysis
- 4.3. BCG Analysis
- 4.3.1. Stars (High Growth, High Market Share)
- 4.3.2. Cash Cows (Low Growth, High Market Share)
- 4.3.3. Question Mark (High Growth, Low Market Share)
- 4.3.4. Dogs (Low Growth, Low Market Share)
- 4.4. Ansoff Matrix Analysis
- 4.5. Supply Chain Analysis
- 4.6. Regulatory Landscape
- 4.7. Current Market Potential and Opportunity Assessment (TAM–SAM–SOM Framework)
- 4.8. PMV Analyst Note
- 4.1. Porters Five Forces
- 5. Market Analysis, Insights and Forecast 2021-2033
- 5.1. Market Analysis, Insights and Forecast - by Water Depth
- 5.1.1. Shallow Water
- 5.1.2. Deepwater and Ultra-deepwater
- 5.2. Market Analysis, Insights and Forecast - by Geography
- 5.2.1. United Kingdom
- 5.2.2. Norway
- 5.2.3. Rest of North Sea
- 5.3. Market Analysis, Insights and Forecast - by Region
- 5.3.1. United Kingdom
- 5.3.2. Norway
- 5.3.3. Rest of North Sea
- 5.1. Market Analysis, Insights and Forecast - by Water Depth
- 6. Global North Sea Decommissioning Oil Rigs Industry Analysis, Insights and Forecast, 2021-2033
- 6.1. Market Analysis, Insights and Forecast - by Water Depth
- 6.1.1. Shallow Water
- 6.1.2. Deepwater and Ultra-deepwater
- 6.2. Market Analysis, Insights and Forecast - by Geography
- 6.2.1. United Kingdom
- 6.2.2. Norway
- 6.2.3. Rest of North Sea
- 6.1. Market Analysis, Insights and Forecast - by Water Depth
- 7. United Kingdom North Sea Decommissioning Oil Rigs Industry Analysis, Insights and Forecast, 2020-2032
- 7.1. Market Analysis, Insights and Forecast - by Water Depth
- 7.1.1. Shallow Water
- 7.1.2. Deepwater and Ultra-deepwater
- 7.2. Market Analysis, Insights and Forecast - by Geography
- 7.2.1. United Kingdom
- 7.2.2. Norway
- 7.2.3. Rest of North Sea
- 7.1. Market Analysis, Insights and Forecast - by Water Depth
- 8. Norway North Sea Decommissioning Oil Rigs Industry Analysis, Insights and Forecast, 2020-2032
- 8.1. Market Analysis, Insights and Forecast - by Water Depth
- 8.1.1. Shallow Water
- 8.1.2. Deepwater and Ultra-deepwater
- 8.2. Market Analysis, Insights and Forecast - by Geography
- 8.2.1. United Kingdom
- 8.2.2. Norway
- 8.2.3. Rest of North Sea
- 8.1. Market Analysis, Insights and Forecast - by Water Depth
- 9. Rest of North Sea North Sea Decommissioning Oil Rigs Industry Analysis, Insights and Forecast, 2020-2032
- 9.1. Market Analysis, Insights and Forecast - by Water Depth
- 9.1.1. Shallow Water
- 9.1.2. Deepwater and Ultra-deepwater
- 9.2. Market Analysis, Insights and Forecast - by Geography
- 9.2.1. United Kingdom
- 9.2.2. Norway
- 9.2.3. Rest of North Sea
- 9.1. Market Analysis, Insights and Forecast - by Water Depth
- 10. Competitive Analysis
- 10.1. Company Profiles
- 10.1.1 Aker Solutions ASA
- 10.1.1.1. Company Overview
- 10.1.1.2. Products
- 10.1.1.3. Company Financials
- 10.1.1.4. SWOT Analysis
- 10.1.2 DNV GL
- 10.1.2.1. Company Overview
- 10.1.2.2. Products
- 10.1.2.3. Company Financials
- 10.1.2.4. SWOT Analysis
- 10.1.3 Heerema Marine Contractors (HMC)
- 10.1.3.1. Company Overview
- 10.1.3.2. Products
- 10.1.3.3. Company Financials
- 10.1.3.4. SWOT Analysis
- 10.1.4 DeepOcean Group Holding BV
- 10.1.4.1. Company Overview
- 10.1.4.2. Products
- 10.1.4.3. Company Financials
- 10.1.4.4. SWOT Analysis
- 10.1.5 Equinor ASA*List Not Exhaustive
- 10.1.5.1. Company Overview
- 10.1.5.2. Products
- 10.1.5.3. Company Financials
- 10.1.5.4. SWOT Analysis
- 10.1.6 Able UK
- 10.1.6.1. Company Overview
- 10.1.6.2. Products
- 10.1.6.3. Company Financials
- 10.1.6.4. SWOT Analysis
- 10.1.7 John Wood Group PLC
- 10.1.7.1. Company Overview
- 10.1.7.2. Products
- 10.1.7.3. Company Financials
- 10.1.7.4. SWOT Analysis
- 10.1.8 TechnipFMC PLC
- 10.1.8.1. Company Overview
- 10.1.8.2. Products
- 10.1.8.3. Company Financials
- 10.1.8.4. SWOT Analysis
- 10.1.9 AF Gruppen SA
- 10.1.9.1. Company Overview
- 10.1.9.2. Products
- 10.1.9.3. Company Financials
- 10.1.9.4. SWOT Analysis
- 10.1.10 Allseas Group
- 10.1.10.1. Company Overview
- 10.1.10.2. Products
- 10.1.10.3. Company Financials
- 10.1.10.4. SWOT Analysis
- 10.1.1 Aker Solutions ASA
- 10.2. Market Entropy
- 10.2.1 Company's Key Areas Served
- 10.2.2 Recent Developments
- 10.3. Company Market Share Analysis 2025
- 10.3.1 Top 5 Companies Market Share Analysis
- 10.3.2 Top 3 Companies Market Share Analysis
- 10.4. List of Potential Customers
- 11. Research Methodology
List of Figures
- Figure 1: Global North Sea Decommissioning Oil Rigs Industry Revenue Breakdown (undefined, %) by Region 2025 & 2033
- Figure 2: United Kingdom North Sea Decommissioning Oil Rigs Industry Revenue (undefined), by Water Depth 2025 & 2033
- Figure 3: United Kingdom North Sea Decommissioning Oil Rigs Industry Revenue Share (%), by Water Depth 2025 & 2033
- Figure 4: United Kingdom North Sea Decommissioning Oil Rigs Industry Revenue (undefined), by Geography 2025 & 2033
- Figure 5: United Kingdom North Sea Decommissioning Oil Rigs Industry Revenue Share (%), by Geography 2025 & 2033
- Figure 6: United Kingdom North Sea Decommissioning Oil Rigs Industry Revenue (undefined), by Country 2025 & 2033
- Figure 7: United Kingdom North Sea Decommissioning Oil Rigs Industry Revenue Share (%), by Country 2025 & 2033
- Figure 8: Norway North Sea Decommissioning Oil Rigs Industry Revenue (undefined), by Water Depth 2025 & 2033
- Figure 9: Norway North Sea Decommissioning Oil Rigs Industry Revenue Share (%), by Water Depth 2025 & 2033
- Figure 10: Norway North Sea Decommissioning Oil Rigs Industry Revenue (undefined), by Geography 2025 & 2033
- Figure 11: Norway North Sea Decommissioning Oil Rigs Industry Revenue Share (%), by Geography 2025 & 2033
- Figure 12: Norway North Sea Decommissioning Oil Rigs Industry Revenue (undefined), by Country 2025 & 2033
- Figure 13: Norway North Sea Decommissioning Oil Rigs Industry Revenue Share (%), by Country 2025 & 2033
- Figure 14: Rest of North Sea North Sea Decommissioning Oil Rigs Industry Revenue (undefined), by Water Depth 2025 & 2033
- Figure 15: Rest of North Sea North Sea Decommissioning Oil Rigs Industry Revenue Share (%), by Water Depth 2025 & 2033
- Figure 16: Rest of North Sea North Sea Decommissioning Oil Rigs Industry Revenue (undefined), by Geography 2025 & 2033
- Figure 17: Rest of North Sea North Sea Decommissioning Oil Rigs Industry Revenue Share (%), by Geography 2025 & 2033
- Figure 18: Rest of North Sea North Sea Decommissioning Oil Rigs Industry Revenue (undefined), by Country 2025 & 2033
- Figure 19: Rest of North Sea North Sea Decommissioning Oil Rigs Industry Revenue Share (%), by Country 2025 & 2033
List of Tables
- Table 1: Global North Sea Decommissioning Oil Rigs Industry Revenue undefined Forecast, by Water Depth 2020 & 2033
- Table 2: Global North Sea Decommissioning Oil Rigs Industry Revenue undefined Forecast, by Geography 2020 & 2033
- Table 3: Global North Sea Decommissioning Oil Rigs Industry Revenue undefined Forecast, by Region 2020 & 2033
- Table 4: Global North Sea Decommissioning Oil Rigs Industry Revenue undefined Forecast, by Water Depth 2020 & 2033
- Table 5: Global North Sea Decommissioning Oil Rigs Industry Revenue undefined Forecast, by Geography 2020 & 2033
- Table 6: Global North Sea Decommissioning Oil Rigs Industry Revenue undefined Forecast, by Country 2020 & 2033
- Table 7: Global North Sea Decommissioning Oil Rigs Industry Revenue undefined Forecast, by Water Depth 2020 & 2033
- Table 8: Global North Sea Decommissioning Oil Rigs Industry Revenue undefined Forecast, by Geography 2020 & 2033
- Table 9: Global North Sea Decommissioning Oil Rigs Industry Revenue undefined Forecast, by Country 2020 & 2033
- Table 10: Global North Sea Decommissioning Oil Rigs Industry Revenue undefined Forecast, by Water Depth 2020 & 2033
- Table 11: Global North Sea Decommissioning Oil Rigs Industry Revenue undefined Forecast, by Geography 2020 & 2033
- Table 12: Global North Sea Decommissioning Oil Rigs Industry Revenue undefined Forecast, by Country 2020 & 2033
Frequently Asked Questions
1. What is the projected Compound Annual Growth Rate (CAGR) of the North Sea Decommissioning Oil Rigs Industry?
The projected CAGR is approximately 8.2%.
2. Which companies are prominent players in the North Sea Decommissioning Oil Rigs Industry?
Key companies in the market include Aker Solutions ASA, DNV GL, Heerema Marine Contractors (HMC), DeepOcean Group Holding BV, Equinor ASA*List Not Exhaustive, Able UK, John Wood Group PLC, TechnipFMC PLC, AF Gruppen SA, Allseas Group.
3. What are the main segments of the North Sea Decommissioning Oil Rigs Industry?
The market segments include Water Depth, Geography.
4. Can you provide details about the market size?
The market size is estimated to be USD XXX N/A as of 2022.
5. What are some drivers contributing to market growth?
4.; Increasing Demand for Secure. Sustainable. and Clean Energy.
6. What are the notable trends driving market growth?
Shallow Water to Dominate the Market.
7. Are there any restraints impacting market growth?
4.; High Cost of Production of Biofuels.
8. Can you provide examples of recent developments in the market?
N/A
9. What pricing options are available for accessing the report?
Pricing options include single-user, multi-user, and enterprise licenses priced at USD 4750, USD 5250, and USD 8750 respectively.
10. Is the market size provided in terms of value or volume?
The market size is provided in terms of value, measured in N/A.
11. Are there any specific market keywords associated with the report?
Yes, the market keyword associated with the report is "North Sea Decommissioning Oil Rigs Industry," which aids in identifying and referencing the specific market segment covered.
12. How do I determine which pricing option suits my needs best?
The pricing options vary based on user requirements and access needs. Individual users may opt for single-user licenses, while businesses requiring broader access may choose multi-user or enterprise licenses for cost-effective access to the report.
13. Are there any additional resources or data provided in the North Sea Decommissioning Oil Rigs Industry report?
While the report offers comprehensive insights, it's advisable to review the specific contents or supplementary materials provided to ascertain if additional resources or data are available.
14. How can I stay updated on further developments or reports in the North Sea Decommissioning Oil Rigs Industry?
To stay informed about further developments, trends, and reports in the North Sea Decommissioning Oil Rigs Industry, consider subscribing to industry newsletters, following relevant companies and organizations, or regularly checking reputable industry news sources and publications.
Methodology
Step 1 - Identification of Relevant Samples Size from Population Database


Step 2 - Approaches for Defining Global Market Size (Value, Volume* & Price*)

Note*: In applicable scenarios
Step 3 - Data Sources
Primary Research
- Web Analytics
- Survey Reports
- Research Institute
- Latest Research Reports
- Opinion Leaders
Secondary Research
- Annual Reports
- White Paper
- Latest Press Release
- Industry Association
- Paid Database
- Investor Presentations

Step 4 - Data Triangulation
Involves using different sources of information in order to increase the validity of a study
These sources are likely to be stakeholders in a program - participants, other researchers, program staff, other community members, and so on.
Then we put all data in single framework & apply various statistical tools to find out the dynamic on the market.
During the analysis stage, feedback from the stakeholder groups would be compared to determine areas of agreement as well as areas of divergence