
Key Insights
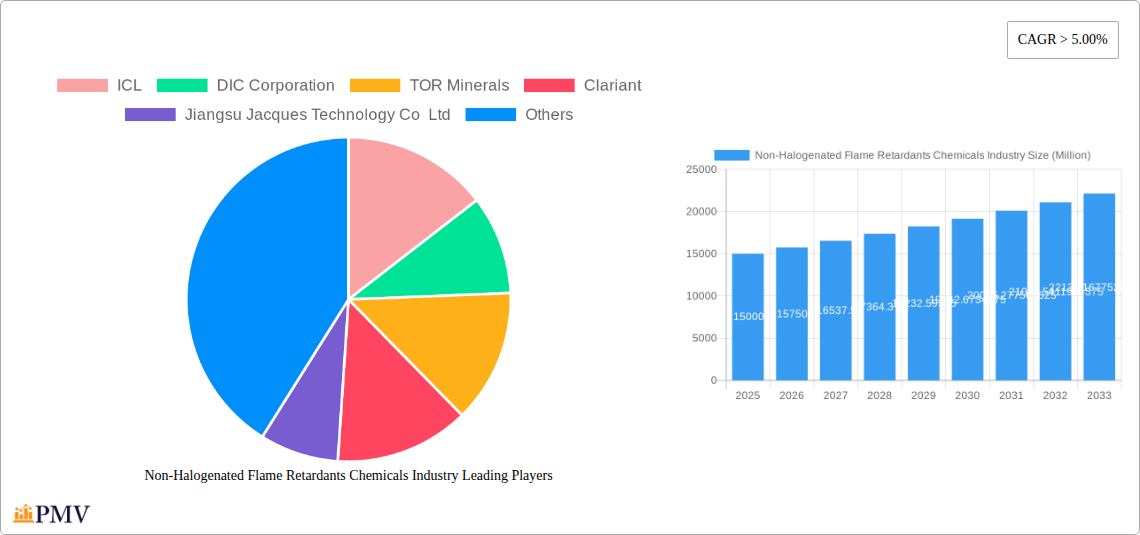
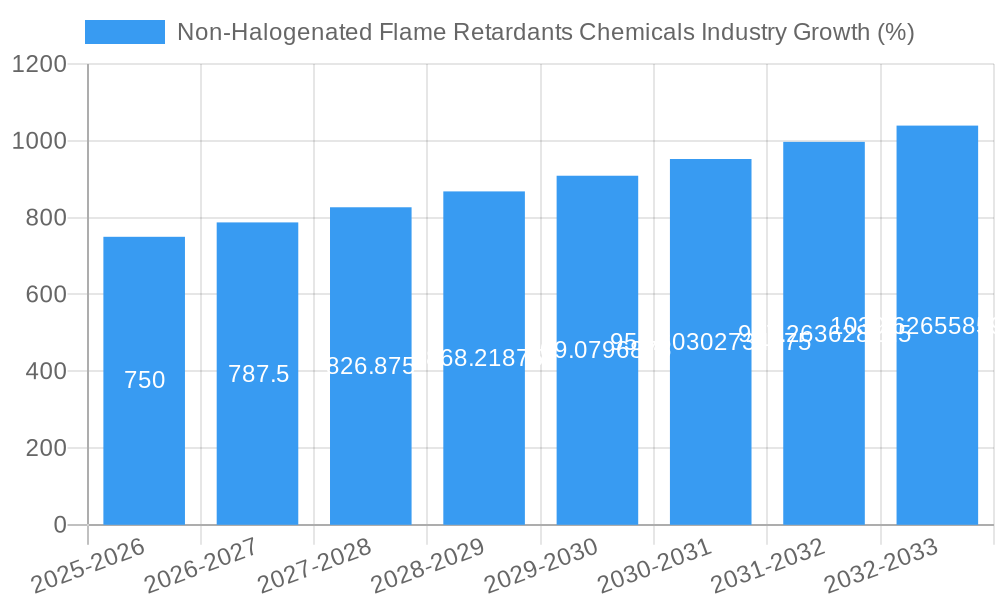
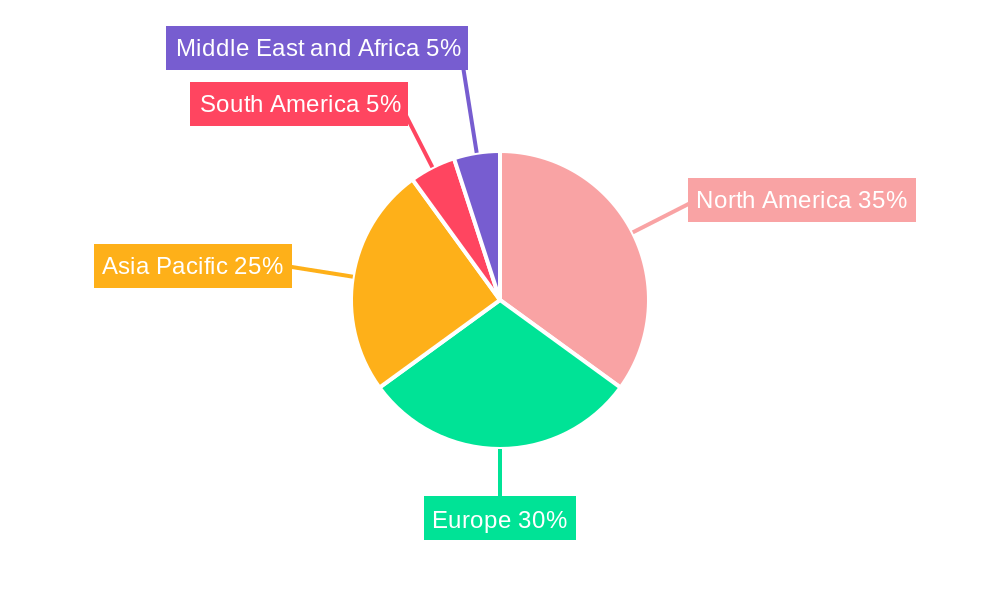
The Non-Halogenated Flame Retardants (NHFR) chemicals market is experiencing robust growth, driven by increasing demand for safer and environmentally friendly alternatives to halogenated flame retardants. The market's Compound Annual Growth Rate (CAGR) exceeding 5% indicates a sustained expansion projected through 2033. Key drivers include stringent regulations aimed at reducing the use of harmful halogenated compounds, coupled with growing awareness of the health and environmental risks associated with them. The increasing adoption of NHFRs across diverse sectors, such as electronics, construction, and transportation, further fuels market growth. Organic NHFRs are witnessing higher adoption rates compared to inorganic counterparts due to their superior performance characteristics and lower toxicity. Within the organic segment, phosphorus-based compounds hold a significant market share, owing to their effectiveness and versatility. The geographical distribution reveals a strong presence in North America and Europe, driven by established regulatory frameworks and robust industrial infrastructure. However, the Asia-Pacific region is projected to demonstrate rapid growth, fueled by expanding manufacturing activities and rising infrastructure development. Competition among established players like ICL, DIC Corporation, and Clariant is intense, with smaller regional players vying for market share. Ongoing research and development efforts are focused on developing innovative, high-performance NHFRs with improved cost-effectiveness and enhanced safety profiles.
The market segmentation reveals significant opportunities for specialized NHFRs catering to specific end-user requirements. The building and construction sector remains a major consumer, driven by the need to enhance fire safety in residential and commercial buildings. Similarly, the electronics industry continues to be a significant driver, with demand for NHFRs in printed circuit boards and other electronic components. The transportation sector, including automotive and aerospace, is also witnessing increased adoption, as manufacturers strive to meet stringent fire safety regulations. While the overall market presents a positive outlook, challenges remain. These include the relatively higher cost of some NHFRs compared to halogenated alternatives and the need for further technological advancements to improve performance and address potential limitations in specific applications. Nevertheless, the long-term growth trajectory of the NHFR market remains promising, driven by the increasing focus on environmental sustainability and enhanced fire safety.
This comprehensive report provides an in-depth analysis of the Non-Halogenated Flame Retardants Chemicals market, offering valuable insights for industry stakeholders, investors, and researchers. Covering the period from 2019 to 2033, with a focus on the 2025-2033 forecast, this report dissects market dynamics, competitive landscapes, and future growth potential. Key segments, including inorganic and organic flame retardants, boron compounds (phosphorus, nitrogen, and others), and end-user industries (electrical & electronics, buildings & construction, transportation, and textiles & furniture) are thoroughly examined. Leading players like ICL, DIC Corporation, and BASF are profiled, providing a granular understanding of market share, strategic initiatives, and competitive advantages.
Non-Halogenated Flame Retardants Chemicals Industry Market Structure & Competitive Dynamics
The Non-Halogenated Flame Retardants Chemicals market exhibits a moderately consolidated structure, with several major players holding significant market share. ICL, DIC Corporation, and Clariant are amongst the leading companies, collectively controlling an estimated xx% of the global market in 2025. Market concentration is influenced by factors such as economies of scale in production, technological innovation capabilities, and established distribution networks. The industry’s innovation ecosystem thrives on collaborative R&D partnerships and strategic alliances, driving the development of novel, high-performance flame retardants. Stringent regulatory frameworks, particularly concerning environmental and health concerns, significantly shape the market. The market witnesses considerable M&A activity, with deal values exceeding $xx Million in the past five years. These transactions aim to expand market reach, enhance product portfolios, and consolidate market share. The increasing demand for eco-friendly alternatives to halogenated flame retardants is a crucial driver, fostering both organic growth and acquisitions in the sector. Product substitution trends favoring non-halogenated options are significant, influenced by evolving environmental regulations and consumer preferences for safer materials.
- Market Concentration: High (xx% controlled by top 5 players in 2025)
- M&A Activity: High, with total deal values exceeding $xx Million (2019-2024)
- Key Regulatory Frameworks: REACH, RoHS, California TB117
- Product Substitution: Strong shift away from halogenated flame retardants.
- End-User Trends: Growing demand for sustainable and high-performance materials.
Non-Halogenated Flame Retardants Chemicals Industry Industry Trends & Insights
The Non-Halogenated Flame Retardants Chemicals market is witnessing robust growth, projected to achieve a CAGR of xx% during the forecast period (2025-2033). This expansion is driven by several factors, including the rising global demand for flame-retardant materials across diverse end-user industries. The stringent regulations restricting the use of halogenated flame retardants are pushing market participants to invest heavily in research and development of eco-friendly and efficient alternatives. Technological advancements in material science are further contributing to the market's growth, leading to the development of novel flame retardants with enhanced performance characteristics and reduced environmental impact. The market penetration of non-halogenated flame retardants is steadily increasing, driven by heightened consumer awareness regarding environmental sustainability and improved product safety. However, fluctuations in raw material prices and supply chain disruptions pose challenges to market growth. Increased consumer preference for sustainable products and the growing construction and electronics sectors are key contributors to market expansion. Competitive dynamics remain intense, with companies focusing on innovation, cost optimization, and strategic partnerships.
Dominant Markets & Segments in Non-Halogenated Flame Retardants Chemicals Industry
The Asia-Pacific region dominates the Non-Halogenated Flame Retardants Chemicals market, driven by rapid industrialization, robust infrastructure development, and burgeoning construction and electronics sectors. China and India are particularly significant contributors to this regional dominance.
- Leading Region: Asia-Pacific
- Leading Countries: China, India
- Dominant Segment (Type): Inorganic flame retardants (market size: $xx Million in 2025)
- Dominant Segment (Boron Compounds): Phosphorus-based compounds (market share: xx% in 2025)
- Dominant Segment (End-user Industry): Electrical and Electronics (market size: $xx Million in 2025)
Key Drivers:
- Rapid urbanization and infrastructure development in Asia-Pacific.
- Stringent environmental regulations promoting the adoption of non-halogenated options.
- Growth in the electrical & electronics and construction sectors.
The dominance of inorganic flame retardants stems from their cost-effectiveness and established applications across diverse industries. Within boron compounds, phosphorus-based options have garnered significant market share due to their superior flame-retardant properties. The electrical and electronics sector's robust growth significantly drives market demand.
Non-Halogenated Flame Retardants Chemicals Industry Product Innovations
Recent product developments focus on enhancing the performance characteristics of non-halogenated flame retardants while addressing environmental and safety concerns. Companies are actively investing in nanotechnology to improve the efficacy and efficiency of their products, resulting in the development of nano-enhanced flame retardants with better heat resistance and processing capabilities. These innovations cater to the growing demands of stringent safety regulations and the need for sustainable alternatives across diverse applications. The market is also witnessing the emergence of synergistic combinations of flame retardants, allowing for optimized performance with reduced usage. These advancements position the industry to cater effectively to the demands of increasingly stringent regulatory environments and the evolving needs of end-users.
Report Segmentation & Scope
The report segments the Non-Halogenated Flame Retardants Chemicals market by type (inorganic, organic), boron compounds (phosphorus, nitrogen, other types), and end-user industry (electrical and electronics, buildings and construction, transportation, textiles and furniture). Each segment is analyzed based on its market size, growth projections, and competitive dynamics. Inorganic flame retardants are projected to exhibit significant growth due to their cost-effectiveness. The organic segment benefits from improved performance, but faces pricing challenges. Phosphorus-based boron compounds dominate the market due to proven efficacy. The electrical and electronics industry is the largest end-user segment, driven by increasing electronics manufacturing. Buildings and construction remain a significant market, influenced by stringent fire safety standards. The transportation and textile sectors represent promising areas for future growth.
Key Drivers of Non-Halogenated Flame Retardants Chemicals Industry Growth
Several factors fuel the growth of the Non-Halogenated Flame Retardants Chemicals market. These include stringent government regulations phasing out harmful halogenated alternatives, increasing demand from the electronics and construction sectors due to their increasing usage in several products and infrastructures, and the continuous development of innovative, high-performance non-halogenated compounds with superior properties. The growing focus on sustainable and eco-friendly materials further boosts the market. Technological advancements are also key, leading to more effective and safer products.
Challenges in the Non-Halogenated Flame Retardants Chemicals Industry Sector
Despite the positive outlook, several challenges exist. These include volatile raw material prices impacting profitability, stringent regulatory compliance requirements leading to increased production costs and complex approval processes, and intense competition among established players and new entrants. Supply chain disruptions due to geopolitical instability and natural disasters also pose threats, occasionally causing price increases and material shortages. These obstacles necessitate strategic adaptation and risk management by market players.
Leading Players in the Non-Halogenated Flame Retardants Chemicals Industry Market
- ICL
- DIC Corporation
- TOR Minerals
- Clariant
- Jiangsu Jacques Technology Co Ltd
- MPI Chemie BV
- Italmatch Chemicals SpA
- LANXESS
- Nippon Carbide Indestries Co Inc (Sanwa Chemical Industry Co Ltd)
- BASF SE
- Rin Kagaku Kogyo Co Ltd
- Shandong Brother Sci &Tech Co Ltd
- Nabaltec AG
- Thor
- Eti Maden
- Apexical Inc
- NYACOL Nano Technologies Inc
- Huber Engineered Materials
- Daihachi Chemical Industry Co Ltd
Key Developments in Non-Halogenated Flame Retardants Chemicals Industry Sector
- 2022 Q4: ICL launched a new generation of phosphorus-based flame retardants.
- 2023 Q1: DIC Corporation and Clariant announced a strategic partnership to develop novel flame retardant technologies.
- 2023 Q2: BASF invested $xx Million in expanding its production capacity for non-halogenated flame retardants.
- (Further developments to be added as available.)
Strategic Non-Halogenated Flame Retardants Chemicals Industry Market Outlook
The Non-Halogenated Flame Retardants Chemicals market exhibits significant growth potential driven by increasing demand for safer and more sustainable materials. Strategic opportunities exist in developing innovative products with enhanced performance and cost-effectiveness, focusing on niche applications and expanding into emerging markets. Companies that proactively address environmental concerns and adapt to evolving regulatory landscapes are poised to gain a competitive edge. Collaborative R&D and strategic partnerships will be vital for navigating the complexities of the market and fostering innovation. The future holds immense potential for companies that effectively cater to the growing need for sustainable and high-performance flame retardant solutions.
Non-Halogenated Flame Retardants Chemicals Industry Segmentation
-
1. Type
-
1.1. Inorganic
- 1.1.1. Aluminum Hydroxide
- 1.1.2. Magnesium Hydroxide
- 1.1.3. Boron Compounds
- 1.2. Phosphorus
- 1.3. Nitrogen
- 1.4. Other Types
-
1.1. Inorganic
-
2. End-user Industry
- 2.1. Electrical and Electronics
- 2.2. Buildings and Construction
- 2.3. Transportation
- 2.4. Textiles and Furniture
Non-Halogenated Flame Retardants Chemicals Industry Segmentation By Geography
-
1. Asia Pacific
- 1.1. China
- 1.2. India
- 1.3. Japan
- 1.4. South Korea
- 1.5. Rest of Asia Pacific
-
2. North America
- 2.1. United States
- 2.2. Canada
- 2.3. Mexico
-
3. Europe
- 3.1. Germany
- 3.2. United Kingdom
- 3.3. Italy
- 3.4. France
- 3.5. Rest of Europe
-
4. South America
- 4.1. Brazil
- 4.2. Argentina
- 4.3. Rest of South America
-
5. Middle East and Africa
- 5.1. Saudi Arabia
- 5.2. South Africa
- 5.3. Rest of Middle East and Africa
Non-Halogenated Flame Retardants Chemicals Industry REPORT HIGHLIGHTS
| Aspects | Details |
|---|---|
| Study Period | 2019-2033 |
| Base Year | 2024 |
| Estimated Year | 2025 |
| Forecast Period | 2025-2033 |
| Historical Period | 2019-2024 |
| Growth Rate | CAGR of > 5.00% from 2019-2033 |
| Segmentation |
|
Table of Contents
- 1. Introduction
- 1.1. Research Scope
- 1.2. Market Segmentation
- 1.3. Research Methodology
- 1.4. Definitions and Assumptions
- 2. Executive Summary
- 2.1. Introduction
- 3. Market Dynamics
- 3.1. Introduction
- 3.2. Market Drivers
- 3.2.1. ; Environmental and Health Concerns Regarding Brominated and Other Flame Retardants; Increasing Infrastructure Activities in Asia-Pacific; Rising Consumer Electrical and Electronic Goods Manufacturing
- 3.3. Market Restrains
- 3.3.1. ; Non-suitability of Hydroxides to High Temperature Applications
- 3.4. Market Trends
- 3.4.1. Increasing Demand from the Buildings and Construction Industry
- 4. Market Factor Analysis
- 4.1. Porters Five Forces
- 4.2. Supply/Value Chain
- 4.3. PESTEL analysis
- 4.4. Market Entropy
- 4.5. Patent/Trademark Analysis
- 5. Global Non-Halogenated Flame Retardants Chemicals Industry Analysis, Insights and Forecast, 2019-2031
- 5.1. Market Analysis, Insights and Forecast - by Type
- 5.1.1. Inorganic
- 5.1.1.1. Aluminum Hydroxide
- 5.1.1.2. Magnesium Hydroxide
- 5.1.1.3. Boron Compounds
- 5.1.2. Phosphorus
- 5.1.3. Nitrogen
- 5.1.4. Other Types
- 5.1.1. Inorganic
- 5.2. Market Analysis, Insights and Forecast - by End-user Industry
- 5.2.1. Electrical and Electronics
- 5.2.2. Buildings and Construction
- 5.2.3. Transportation
- 5.2.4. Textiles and Furniture
- 5.3. Market Analysis, Insights and Forecast - by Region
- 5.3.1. Asia Pacific
- 5.3.2. North America
- 5.3.3. Europe
- 5.3.4. South America
- 5.3.5. Middle East and Africa
- 5.1. Market Analysis, Insights and Forecast - by Type
- 6. Asia Pacific Non-Halogenated Flame Retardants Chemicals Industry Analysis, Insights and Forecast, 2019-2031
- 6.1. Market Analysis, Insights and Forecast - by Type
- 6.1.1. Inorganic
- 6.1.1.1. Aluminum Hydroxide
- 6.1.1.2. Magnesium Hydroxide
- 6.1.1.3. Boron Compounds
- 6.1.2. Phosphorus
- 6.1.3. Nitrogen
- 6.1.4. Other Types
- 6.1.1. Inorganic
- 6.2. Market Analysis, Insights and Forecast - by End-user Industry
- 6.2.1. Electrical and Electronics
- 6.2.2. Buildings and Construction
- 6.2.3. Transportation
- 6.2.4. Textiles and Furniture
- 6.1. Market Analysis, Insights and Forecast - by Type
- 7. North America Non-Halogenated Flame Retardants Chemicals Industry Analysis, Insights and Forecast, 2019-2031
- 7.1. Market Analysis, Insights and Forecast - by Type
- 7.1.1. Inorganic
- 7.1.1.1. Aluminum Hydroxide
- 7.1.1.2. Magnesium Hydroxide
- 7.1.1.3. Boron Compounds
- 7.1.2. Phosphorus
- 7.1.3. Nitrogen
- 7.1.4. Other Types
- 7.1.1. Inorganic
- 7.2. Market Analysis, Insights and Forecast - by End-user Industry
- 7.2.1. Electrical and Electronics
- 7.2.2. Buildings and Construction
- 7.2.3. Transportation
- 7.2.4. Textiles and Furniture
- 7.1. Market Analysis, Insights and Forecast - by Type
- 8. Europe Non-Halogenated Flame Retardants Chemicals Industry Analysis, Insights and Forecast, 2019-2031
- 8.1. Market Analysis, Insights and Forecast - by Type
- 8.1.1. Inorganic
- 8.1.1.1. Aluminum Hydroxide
- 8.1.1.2. Magnesium Hydroxide
- 8.1.1.3. Boron Compounds
- 8.1.2. Phosphorus
- 8.1.3. Nitrogen
- 8.1.4. Other Types
- 8.1.1. Inorganic
- 8.2. Market Analysis, Insights and Forecast - by End-user Industry
- 8.2.1. Electrical and Electronics
- 8.2.2. Buildings and Construction
- 8.2.3. Transportation
- 8.2.4. Textiles and Furniture
- 8.1. Market Analysis, Insights and Forecast - by Type
- 9. South America Non-Halogenated Flame Retardants Chemicals Industry Analysis, Insights and Forecast, 2019-2031
- 9.1. Market Analysis, Insights and Forecast - by Type
- 9.1.1. Inorganic
- 9.1.1.1. Aluminum Hydroxide
- 9.1.1.2. Magnesium Hydroxide
- 9.1.1.3. Boron Compounds
- 9.1.2. Phosphorus
- 9.1.3. Nitrogen
- 9.1.4. Other Types
- 9.1.1. Inorganic
- 9.2. Market Analysis, Insights and Forecast - by End-user Industry
- 9.2.1. Electrical and Electronics
- 9.2.2. Buildings and Construction
- 9.2.3. Transportation
- 9.2.4. Textiles and Furniture
- 9.1. Market Analysis, Insights and Forecast - by Type
- 10. Middle East and Africa Non-Halogenated Flame Retardants Chemicals Industry Analysis, Insights and Forecast, 2019-2031
- 10.1. Market Analysis, Insights and Forecast - by Type
- 10.1.1. Inorganic
- 10.1.1.1. Aluminum Hydroxide
- 10.1.1.2. Magnesium Hydroxide
- 10.1.1.3. Boron Compounds
- 10.1.2. Phosphorus
- 10.1.3. Nitrogen
- 10.1.4. Other Types
- 10.1.1. Inorganic
- 10.2. Market Analysis, Insights and Forecast - by End-user Industry
- 10.2.1. Electrical and Electronics
- 10.2.2. Buildings and Construction
- 10.2.3. Transportation
- 10.2.4. Textiles and Furniture
- 10.1. Market Analysis, Insights and Forecast - by Type
- 11. North America Non-Halogenated Flame Retardants Chemicals Industry Analysis, Insights and Forecast, 2019-2031
- 11.1. Market Analysis, Insights and Forecast - By Country/Sub-region
- 11.1.1 United States
- 11.1.2 Canada
- 11.1.3 Mexico
- 12. Europe Non-Halogenated Flame Retardants Chemicals Industry Analysis, Insights and Forecast, 2019-2031
- 12.1. Market Analysis, Insights and Forecast - By Country/Sub-region
- 12.1.1 Germany
- 12.1.2 France
- 12.1.3 Italy
- 12.1.4 United Kingdom
- 12.1.5 Netherlands
- 12.1.6 Rest of Europe
- 13. Asia Pacific Non-Halogenated Flame Retardants Chemicals Industry Analysis, Insights and Forecast, 2019-2031
- 13.1. Market Analysis, Insights and Forecast - By Country/Sub-region
- 13.1.1 China
- 13.1.2 Japan
- 13.1.3 India
- 13.1.4 South Korea
- 13.1.5 Taiwan
- 13.1.6 Australia
- 13.1.7 Rest of Asia-Pacific
- 14. South America Non-Halogenated Flame Retardants Chemicals Industry Analysis, Insights and Forecast, 2019-2031
- 14.1. Market Analysis, Insights and Forecast - By Country/Sub-region
- 14.1.1 Brazil
- 14.1.2 Argentina
- 14.1.3 Rest of South America
- 15. Middle East and Africa Non-Halogenated Flame Retardants Chemicals Industry Analysis, Insights and Forecast, 2019-2031
- 15.1. Market Analysis, Insights and Forecast - By Country/Sub-region
- 15.1.1 Middle East
- 15.1.2 Africa
- 16. Competitive Analysis
- 16.1. Global Market Share Analysis 2024
- 16.2. Company Profiles
- 16.2.1 ICL
- 16.2.1.1. Overview
- 16.2.1.2. Products
- 16.2.1.3. SWOT Analysis
- 16.2.1.4. Recent Developments
- 16.2.1.5. Financials (Based on Availability)
- 16.2.2 DIC Corporation
- 16.2.2.1. Overview
- 16.2.2.2. Products
- 16.2.2.3. SWOT Analysis
- 16.2.2.4. Recent Developments
- 16.2.2.5. Financials (Based on Availability)
- 16.2.3 TOR Minerals
- 16.2.3.1. Overview
- 16.2.3.2. Products
- 16.2.3.3. SWOT Analysis
- 16.2.3.4. Recent Developments
- 16.2.3.5. Financials (Based on Availability)
- 16.2.4 Clariant
- 16.2.4.1. Overview
- 16.2.4.2. Products
- 16.2.4.3. SWOT Analysis
- 16.2.4.4. Recent Developments
- 16.2.4.5. Financials (Based on Availability)
- 16.2.5 Jiangsu Jacques Technology Co Ltd
- 16.2.5.1. Overview
- 16.2.5.2. Products
- 16.2.5.3. SWOT Analysis
- 16.2.5.4. Recent Developments
- 16.2.5.5. Financials (Based on Availability)
- 16.2.6 MPI Chemie BV
- 16.2.6.1. Overview
- 16.2.6.2. Products
- 16.2.6.3. SWOT Analysis
- 16.2.6.4. Recent Developments
- 16.2.6.5. Financials (Based on Availability)
- 16.2.7 Italmatch Chemicals SpA
- 16.2.7.1. Overview
- 16.2.7.2. Products
- 16.2.7.3. SWOT Analysis
- 16.2.7.4. Recent Developments
- 16.2.7.5. Financials (Based on Availability)
- 16.2.8 LANXESS
- 16.2.8.1. Overview
- 16.2.8.2. Products
- 16.2.8.3. SWOT Analysis
- 16.2.8.4. Recent Developments
- 16.2.8.5. Financials (Based on Availability)
- 16.2.9 Nippon Carbide Indestries Co Inc (Sanwa Chemical Industry Co Ltd)
- 16.2.9.1. Overview
- 16.2.9.2. Products
- 16.2.9.3. SWOT Analysis
- 16.2.9.4. Recent Developments
- 16.2.9.5. Financials (Based on Availability)
- 16.2.10 BASF SE
- 16.2.10.1. Overview
- 16.2.10.2. Products
- 16.2.10.3. SWOT Analysis
- 16.2.10.4. Recent Developments
- 16.2.10.5. Financials (Based on Availability)
- 16.2.11 Rin Kagaku Kogyo Co Ltd
- 16.2.11.1. Overview
- 16.2.11.2. Products
- 16.2.11.3. SWOT Analysis
- 16.2.11.4. Recent Developments
- 16.2.11.5. Financials (Based on Availability)
- 16.2.12 Shandong Brother Sci &Tech Co Ltd
- 16.2.12.1. Overview
- 16.2.12.2. Products
- 16.2.12.3. SWOT Analysis
- 16.2.12.4. Recent Developments
- 16.2.12.5. Financials (Based on Availability)
- 16.2.13 Nabaltec AG
- 16.2.13.1. Overview
- 16.2.13.2. Products
- 16.2.13.3. SWOT Analysis
- 16.2.13.4. Recent Developments
- 16.2.13.5. Financials (Based on Availability)
- 16.2.14 Thor
- 16.2.14.1. Overview
- 16.2.14.2. Products
- 16.2.14.3. SWOT Analysis
- 16.2.14.4. Recent Developments
- 16.2.14.5. Financials (Based on Availability)
- 16.2.15 Eti Maden
- 16.2.15.1. Overview
- 16.2.15.2. Products
- 16.2.15.3. SWOT Analysis
- 16.2.15.4. Recent Developments
- 16.2.15.5. Financials (Based on Availability)
- 16.2.16 Apexical Inc
- 16.2.16.1. Overview
- 16.2.16.2. Products
- 16.2.16.3. SWOT Analysis
- 16.2.16.4. Recent Developments
- 16.2.16.5. Financials (Based on Availability)
- 16.2.17 NYACOL Nano Technologies Inc
- 16.2.17.1. Overview
- 16.2.17.2. Products
- 16.2.17.3. SWOT Analysis
- 16.2.17.4. Recent Developments
- 16.2.17.5. Financials (Based on Availability)
- 16.2.18 Huber Engineered Materials
- 16.2.18.1. Overview
- 16.2.18.2. Products
- 16.2.18.3. SWOT Analysis
- 16.2.18.4. Recent Developments
- 16.2.18.5. Financials (Based on Availability)
- 16.2.19 Daihachi Chemical Industry Co Ltd
- 16.2.19.1. Overview
- 16.2.19.2. Products
- 16.2.19.3. SWOT Analysis
- 16.2.19.4. Recent Developments
- 16.2.19.5. Financials (Based on Availability)
- 16.2.1 ICL
List of Figures
- Figure 1: Global Non-Halogenated Flame Retardants Chemicals Industry Revenue Breakdown (Million, %) by Region 2024 & 2032
- Figure 2: Global Non-Halogenated Flame Retardants Chemicals Industry Volume Breakdown (K Tons, %) by Region 2024 & 2032
- Figure 3: North America Non-Halogenated Flame Retardants Chemicals Industry Revenue (Million), by Country 2024 & 2032
- Figure 4: North America Non-Halogenated Flame Retardants Chemicals Industry Volume (K Tons), by Country 2024 & 2032
- Figure 5: North America Non-Halogenated Flame Retardants Chemicals Industry Revenue Share (%), by Country 2024 & 2032
- Figure 6: North America Non-Halogenated Flame Retardants Chemicals Industry Volume Share (%), by Country 2024 & 2032
- Figure 7: Europe Non-Halogenated Flame Retardants Chemicals Industry Revenue (Million), by Country 2024 & 2032
- Figure 8: Europe Non-Halogenated Flame Retardants Chemicals Industry Volume (K Tons), by Country 2024 & 2032
- Figure 9: Europe Non-Halogenated Flame Retardants Chemicals Industry Revenue Share (%), by Country 2024 & 2032
- Figure 10: Europe Non-Halogenated Flame Retardants Chemicals Industry Volume Share (%), by Country 2024 & 2032
- Figure 11: Asia Pacific Non-Halogenated Flame Retardants Chemicals Industry Revenue (Million), by Country 2024 & 2032
- Figure 12: Asia Pacific Non-Halogenated Flame Retardants Chemicals Industry Volume (K Tons), by Country 2024 & 2032
- Figure 13: Asia Pacific Non-Halogenated Flame Retardants Chemicals Industry Revenue Share (%), by Country 2024 & 2032
- Figure 14: Asia Pacific Non-Halogenated Flame Retardants Chemicals Industry Volume Share (%), by Country 2024 & 2032
- Figure 15: South America Non-Halogenated Flame Retardants Chemicals Industry Revenue (Million), by Country 2024 & 2032
- Figure 16: South America Non-Halogenated Flame Retardants Chemicals Industry Volume (K Tons), by Country 2024 & 2032
- Figure 17: South America Non-Halogenated Flame Retardants Chemicals Industry Revenue Share (%), by Country 2024 & 2032
- Figure 18: South America Non-Halogenated Flame Retardants Chemicals Industry Volume Share (%), by Country 2024 & 2032
- Figure 19: Middle East and Africa Non-Halogenated Flame Retardants Chemicals Industry Revenue (Million), by Country 2024 & 2032
- Figure 20: Middle East and Africa Non-Halogenated Flame Retardants Chemicals Industry Volume (K Tons), by Country 2024 & 2032
- Figure 21: Middle East and Africa Non-Halogenated Flame Retardants Chemicals Industry Revenue Share (%), by Country 2024 & 2032
- Figure 22: Middle East and Africa Non-Halogenated Flame Retardants Chemicals Industry Volume Share (%), by Country 2024 & 2032
- Figure 23: Asia Pacific Non-Halogenated Flame Retardants Chemicals Industry Revenue (Million), by Type 2024 & 2032
- Figure 24: Asia Pacific Non-Halogenated Flame Retardants Chemicals Industry Volume (K Tons), by Type 2024 & 2032
- Figure 25: Asia Pacific Non-Halogenated Flame Retardants Chemicals Industry Revenue Share (%), by Type 2024 & 2032
- Figure 26: Asia Pacific Non-Halogenated Flame Retardants Chemicals Industry Volume Share (%), by Type 2024 & 2032
- Figure 27: Asia Pacific Non-Halogenated Flame Retardants Chemicals Industry Revenue (Million), by End-user Industry 2024 & 2032
- Figure 28: Asia Pacific Non-Halogenated Flame Retardants Chemicals Industry Volume (K Tons), by End-user Industry 2024 & 2032
- Figure 29: Asia Pacific Non-Halogenated Flame Retardants Chemicals Industry Revenue Share (%), by End-user Industry 2024 & 2032
- Figure 30: Asia Pacific Non-Halogenated Flame Retardants Chemicals Industry Volume Share (%), by End-user Industry 2024 & 2032
- Figure 31: Asia Pacific Non-Halogenated Flame Retardants Chemicals Industry Revenue (Million), by Country 2024 & 2032
- Figure 32: Asia Pacific Non-Halogenated Flame Retardants Chemicals Industry Volume (K Tons), by Country 2024 & 2032
- Figure 33: Asia Pacific Non-Halogenated Flame Retardants Chemicals Industry Revenue Share (%), by Country 2024 & 2032
- Figure 34: Asia Pacific Non-Halogenated Flame Retardants Chemicals Industry Volume Share (%), by Country 2024 & 2032
- Figure 35: North America Non-Halogenated Flame Retardants Chemicals Industry Revenue (Million), by Type 2024 & 2032
- Figure 36: North America Non-Halogenated Flame Retardants Chemicals Industry Volume (K Tons), by Type 2024 & 2032
- Figure 37: North America Non-Halogenated Flame Retardants Chemicals Industry Revenue Share (%), by Type 2024 & 2032
- Figure 38: North America Non-Halogenated Flame Retardants Chemicals Industry Volume Share (%), by Type 2024 & 2032
- Figure 39: North America Non-Halogenated Flame Retardants Chemicals Industry Revenue (Million), by End-user Industry 2024 & 2032
- Figure 40: North America Non-Halogenated Flame Retardants Chemicals Industry Volume (K Tons), by End-user Industry 2024 & 2032
- Figure 41: North America Non-Halogenated Flame Retardants Chemicals Industry Revenue Share (%), by End-user Industry 2024 & 2032
- Figure 42: North America Non-Halogenated Flame Retardants Chemicals Industry Volume Share (%), by End-user Industry 2024 & 2032
- Figure 43: North America Non-Halogenated Flame Retardants Chemicals Industry Revenue (Million), by Country 2024 & 2032
- Figure 44: North America Non-Halogenated Flame Retardants Chemicals Industry Volume (K Tons), by Country 2024 & 2032
- Figure 45: North America Non-Halogenated Flame Retardants Chemicals Industry Revenue Share (%), by Country 2024 & 2032
- Figure 46: North America Non-Halogenated Flame Retardants Chemicals Industry Volume Share (%), by Country 2024 & 2032
- Figure 47: Europe Non-Halogenated Flame Retardants Chemicals Industry Revenue (Million), by Type 2024 & 2032
- Figure 48: Europe Non-Halogenated Flame Retardants Chemicals Industry Volume (K Tons), by Type 2024 & 2032
- Figure 49: Europe Non-Halogenated Flame Retardants Chemicals Industry Revenue Share (%), by Type 2024 & 2032
- Figure 50: Europe Non-Halogenated Flame Retardants Chemicals Industry Volume Share (%), by Type 2024 & 2032
- Figure 51: Europe Non-Halogenated Flame Retardants Chemicals Industry Revenue (Million), by End-user Industry 2024 & 2032
- Figure 52: Europe Non-Halogenated Flame Retardants Chemicals Industry Volume (K Tons), by End-user Industry 2024 & 2032
- Figure 53: Europe Non-Halogenated Flame Retardants Chemicals Industry Revenue Share (%), by End-user Industry 2024 & 2032
- Figure 54: Europe Non-Halogenated Flame Retardants Chemicals Industry Volume Share (%), by End-user Industry 2024 & 2032
- Figure 55: Europe Non-Halogenated Flame Retardants Chemicals Industry Revenue (Million), by Country 2024 & 2032
- Figure 56: Europe Non-Halogenated Flame Retardants Chemicals Industry Volume (K Tons), by Country 2024 & 2032
- Figure 57: Europe Non-Halogenated Flame Retardants Chemicals Industry Revenue Share (%), by Country 2024 & 2032
- Figure 58: Europe Non-Halogenated Flame Retardants Chemicals Industry Volume Share (%), by Country 2024 & 2032
- Figure 59: South America Non-Halogenated Flame Retardants Chemicals Industry Revenue (Million), by Type 2024 & 2032
- Figure 60: South America Non-Halogenated Flame Retardants Chemicals Industry Volume (K Tons), by Type 2024 & 2032
- Figure 61: South America Non-Halogenated Flame Retardants Chemicals Industry Revenue Share (%), by Type 2024 & 2032
- Figure 62: South America Non-Halogenated Flame Retardants Chemicals Industry Volume Share (%), by Type 2024 & 2032
- Figure 63: South America Non-Halogenated Flame Retardants Chemicals Industry Revenue (Million), by End-user Industry 2024 & 2032
- Figure 64: South America Non-Halogenated Flame Retardants Chemicals Industry Volume (K Tons), by End-user Industry 2024 & 2032
- Figure 65: South America Non-Halogenated Flame Retardants Chemicals Industry Revenue Share (%), by End-user Industry 2024 & 2032
- Figure 66: South America Non-Halogenated Flame Retardants Chemicals Industry Volume Share (%), by End-user Industry 2024 & 2032
- Figure 67: South America Non-Halogenated Flame Retardants Chemicals Industry Revenue (Million), by Country 2024 & 2032
- Figure 68: South America Non-Halogenated Flame Retardants Chemicals Industry Volume (K Tons), by Country 2024 & 2032
- Figure 69: South America Non-Halogenated Flame Retardants Chemicals Industry Revenue Share (%), by Country 2024 & 2032
- Figure 70: South America Non-Halogenated Flame Retardants Chemicals Industry Volume Share (%), by Country 2024 & 2032
- Figure 71: Middle East and Africa Non-Halogenated Flame Retardants Chemicals Industry Revenue (Million), by Type 2024 & 2032
- Figure 72: Middle East and Africa Non-Halogenated Flame Retardants Chemicals Industry Volume (K Tons), by Type 2024 & 2032
- Figure 73: Middle East and Africa Non-Halogenated Flame Retardants Chemicals Industry Revenue Share (%), by Type 2024 & 2032
- Figure 74: Middle East and Africa Non-Halogenated Flame Retardants Chemicals Industry Volume Share (%), by Type 2024 & 2032
- Figure 75: Middle East and Africa Non-Halogenated Flame Retardants Chemicals Industry Revenue (Million), by End-user Industry 2024 & 2032
- Figure 76: Middle East and Africa Non-Halogenated Flame Retardants Chemicals Industry Volume (K Tons), by End-user Industry 2024 & 2032
- Figure 77: Middle East and Africa Non-Halogenated Flame Retardants Chemicals Industry Revenue Share (%), by End-user Industry 2024 & 2032
- Figure 78: Middle East and Africa Non-Halogenated Flame Retardants Chemicals Industry Volume Share (%), by End-user Industry 2024 & 2032
- Figure 79: Middle East and Africa Non-Halogenated Flame Retardants Chemicals Industry Revenue (Million), by Country 2024 & 2032
- Figure 80: Middle East and Africa Non-Halogenated Flame Retardants Chemicals Industry Volume (K Tons), by Country 2024 & 2032
- Figure 81: Middle East and Africa Non-Halogenated Flame Retardants Chemicals Industry Revenue Share (%), by Country 2024 & 2032
- Figure 82: Middle East and Africa Non-Halogenated Flame Retardants Chemicals Industry Volume Share (%), by Country 2024 & 2032
List of Tables
- Table 1: Global Non-Halogenated Flame Retardants Chemicals Industry Revenue Million Forecast, by Region 2019 & 2032
- Table 2: Global Non-Halogenated Flame Retardants Chemicals Industry Volume K Tons Forecast, by Region 2019 & 2032
- Table 3: Global Non-Halogenated Flame Retardants Chemicals Industry Revenue Million Forecast, by Type 2019 & 2032
- Table 4: Global Non-Halogenated Flame Retardants Chemicals Industry Volume K Tons Forecast, by Type 2019 & 2032
- Table 5: Global Non-Halogenated Flame Retardants Chemicals Industry Revenue Million Forecast, by End-user Industry 2019 & 2032
- Table 6: Global Non-Halogenated Flame Retardants Chemicals Industry Volume K Tons Forecast, by End-user Industry 2019 & 2032
- Table 7: Global Non-Halogenated Flame Retardants Chemicals Industry Revenue Million Forecast, by Region 2019 & 2032
- Table 8: Global Non-Halogenated Flame Retardants Chemicals Industry Volume K Tons Forecast, by Region 2019 & 2032
- Table 9: Global Non-Halogenated Flame Retardants Chemicals Industry Revenue Million Forecast, by Country 2019 & 2032
- Table 10: Global Non-Halogenated Flame Retardants Chemicals Industry Volume K Tons Forecast, by Country 2019 & 2032
- Table 11: United States Non-Halogenated Flame Retardants Chemicals Industry Revenue (Million) Forecast, by Application 2019 & 2032
- Table 12: United States Non-Halogenated Flame Retardants Chemicals Industry Volume (K Tons) Forecast, by Application 2019 & 2032
- Table 13: Canada Non-Halogenated Flame Retardants Chemicals Industry Revenue (Million) Forecast, by Application 2019 & 2032
- Table 14: Canada Non-Halogenated Flame Retardants Chemicals Industry Volume (K Tons) Forecast, by Application 2019 & 2032
- Table 15: Mexico Non-Halogenated Flame Retardants Chemicals Industry Revenue (Million) Forecast, by Application 2019 & 2032
- Table 16: Mexico Non-Halogenated Flame Retardants Chemicals Industry Volume (K Tons) Forecast, by Application 2019 & 2032
- Table 17: Global Non-Halogenated Flame Retardants Chemicals Industry Revenue Million Forecast, by Country 2019 & 2032
- Table 18: Global Non-Halogenated Flame Retardants Chemicals Industry Volume K Tons Forecast, by Country 2019 & 2032
- Table 19: Germany Non-Halogenated Flame Retardants Chemicals Industry Revenue (Million) Forecast, by Application 2019 & 2032
- Table 20: Germany Non-Halogenated Flame Retardants Chemicals Industry Volume (K Tons) Forecast, by Application 2019 & 2032
- Table 21: France Non-Halogenated Flame Retardants Chemicals Industry Revenue (Million) Forecast, by Application 2019 & 2032
- Table 22: France Non-Halogenated Flame Retardants Chemicals Industry Volume (K Tons) Forecast, by Application 2019 & 2032
- Table 23: Italy Non-Halogenated Flame Retardants Chemicals Industry Revenue (Million) Forecast, by Application 2019 & 2032
- Table 24: Italy Non-Halogenated Flame Retardants Chemicals Industry Volume (K Tons) Forecast, by Application 2019 & 2032
- Table 25: United Kingdom Non-Halogenated Flame Retardants Chemicals Industry Revenue (Million) Forecast, by Application 2019 & 2032
- Table 26: United Kingdom Non-Halogenated Flame Retardants Chemicals Industry Volume (K Tons) Forecast, by Application 2019 & 2032
- Table 27: Netherlands Non-Halogenated Flame Retardants Chemicals Industry Revenue (Million) Forecast, by Application 2019 & 2032
- Table 28: Netherlands Non-Halogenated Flame Retardants Chemicals Industry Volume (K Tons) Forecast, by Application 2019 & 2032
- Table 29: Rest of Europe Non-Halogenated Flame Retardants Chemicals Industry Revenue (Million) Forecast, by Application 2019 & 2032
- Table 30: Rest of Europe Non-Halogenated Flame Retardants Chemicals Industry Volume (K Tons) Forecast, by Application 2019 & 2032
- Table 31: Global Non-Halogenated Flame Retardants Chemicals Industry Revenue Million Forecast, by Country 2019 & 2032
- Table 32: Global Non-Halogenated Flame Retardants Chemicals Industry Volume K Tons Forecast, by Country 2019 & 2032
- Table 33: China Non-Halogenated Flame Retardants Chemicals Industry Revenue (Million) Forecast, by Application 2019 & 2032
- Table 34: China Non-Halogenated Flame Retardants Chemicals Industry Volume (K Tons) Forecast, by Application 2019 & 2032
- Table 35: Japan Non-Halogenated Flame Retardants Chemicals Industry Revenue (Million) Forecast, by Application 2019 & 2032
- Table 36: Japan Non-Halogenated Flame Retardants Chemicals Industry Volume (K Tons) Forecast, by Application 2019 & 2032
- Table 37: India Non-Halogenated Flame Retardants Chemicals Industry Revenue (Million) Forecast, by Application 2019 & 2032
- Table 38: India Non-Halogenated Flame Retardants Chemicals Industry Volume (K Tons) Forecast, by Application 2019 & 2032
- Table 39: South Korea Non-Halogenated Flame Retardants Chemicals Industry Revenue (Million) Forecast, by Application 2019 & 2032
- Table 40: South Korea Non-Halogenated Flame Retardants Chemicals Industry Volume (K Tons) Forecast, by Application 2019 & 2032
- Table 41: Taiwan Non-Halogenated Flame Retardants Chemicals Industry Revenue (Million) Forecast, by Application 2019 & 2032
- Table 42: Taiwan Non-Halogenated Flame Retardants Chemicals Industry Volume (K Tons) Forecast, by Application 2019 & 2032
- Table 43: Australia Non-Halogenated Flame Retardants Chemicals Industry Revenue (Million) Forecast, by Application 2019 & 2032
- Table 44: Australia Non-Halogenated Flame Retardants Chemicals Industry Volume (K Tons) Forecast, by Application 2019 & 2032
- Table 45: Rest of Asia-Pacific Non-Halogenated Flame Retardants Chemicals Industry Revenue (Million) Forecast, by Application 2019 & 2032
- Table 46: Rest of Asia-Pacific Non-Halogenated Flame Retardants Chemicals Industry Volume (K Tons) Forecast, by Application 2019 & 2032
- Table 47: Global Non-Halogenated Flame Retardants Chemicals Industry Revenue Million Forecast, by Country 2019 & 2032
- Table 48: Global Non-Halogenated Flame Retardants Chemicals Industry Volume K Tons Forecast, by Country 2019 & 2032
- Table 49: Brazil Non-Halogenated Flame Retardants Chemicals Industry Revenue (Million) Forecast, by Application 2019 & 2032
- Table 50: Brazil Non-Halogenated Flame Retardants Chemicals Industry Volume (K Tons) Forecast, by Application 2019 & 2032
- Table 51: Argentina Non-Halogenated Flame Retardants Chemicals Industry Revenue (Million) Forecast, by Application 2019 & 2032
- Table 52: Argentina Non-Halogenated Flame Retardants Chemicals Industry Volume (K Tons) Forecast, by Application 2019 & 2032
- Table 53: Rest of South America Non-Halogenated Flame Retardants Chemicals Industry Revenue (Million) Forecast, by Application 2019 & 2032
- Table 54: Rest of South America Non-Halogenated Flame Retardants Chemicals Industry Volume (K Tons) Forecast, by Application 2019 & 2032
- Table 55: Global Non-Halogenated Flame Retardants Chemicals Industry Revenue Million Forecast, by Country 2019 & 2032
- Table 56: Global Non-Halogenated Flame Retardants Chemicals Industry Volume K Tons Forecast, by Country 2019 & 2032
- Table 57: Middle East Non-Halogenated Flame Retardants Chemicals Industry Revenue (Million) Forecast, by Application 2019 & 2032
- Table 58: Middle East Non-Halogenated Flame Retardants Chemicals Industry Volume (K Tons) Forecast, by Application 2019 & 2032
- Table 59: Africa Non-Halogenated Flame Retardants Chemicals Industry Revenue (Million) Forecast, by Application 2019 & 2032
- Table 60: Africa Non-Halogenated Flame Retardants Chemicals Industry Volume (K Tons) Forecast, by Application 2019 & 2032
- Table 61: Global Non-Halogenated Flame Retardants Chemicals Industry Revenue Million Forecast, by Type 2019 & 2032
- Table 62: Global Non-Halogenated Flame Retardants Chemicals Industry Volume K Tons Forecast, by Type 2019 & 2032
- Table 63: Global Non-Halogenated Flame Retardants Chemicals Industry Revenue Million Forecast, by End-user Industry 2019 & 2032
- Table 64: Global Non-Halogenated Flame Retardants Chemicals Industry Volume K Tons Forecast, by End-user Industry 2019 & 2032
- Table 65: Global Non-Halogenated Flame Retardants Chemicals Industry Revenue Million Forecast, by Country 2019 & 2032
- Table 66: Global Non-Halogenated Flame Retardants Chemicals Industry Volume K Tons Forecast, by Country 2019 & 2032
- Table 67: China Non-Halogenated Flame Retardants Chemicals Industry Revenue (Million) Forecast, by Application 2019 & 2032
- Table 68: China Non-Halogenated Flame Retardants Chemicals Industry Volume (K Tons) Forecast, by Application 2019 & 2032
- Table 69: India Non-Halogenated Flame Retardants Chemicals Industry Revenue (Million) Forecast, by Application 2019 & 2032
- Table 70: India Non-Halogenated Flame Retardants Chemicals Industry Volume (K Tons) Forecast, by Application 2019 & 2032
- Table 71: Japan Non-Halogenated Flame Retardants Chemicals Industry Revenue (Million) Forecast, by Application 2019 & 2032
- Table 72: Japan Non-Halogenated Flame Retardants Chemicals Industry Volume (K Tons) Forecast, by Application 2019 & 2032
- Table 73: South Korea Non-Halogenated Flame Retardants Chemicals Industry Revenue (Million) Forecast, by Application 2019 & 2032
- Table 74: South Korea Non-Halogenated Flame Retardants Chemicals Industry Volume (K Tons) Forecast, by Application 2019 & 2032
- Table 75: Rest of Asia Pacific Non-Halogenated Flame Retardants Chemicals Industry Revenue (Million) Forecast, by Application 2019 & 2032
- Table 76: Rest of Asia Pacific Non-Halogenated Flame Retardants Chemicals Industry Volume (K Tons) Forecast, by Application 2019 & 2032
- Table 77: Global Non-Halogenated Flame Retardants Chemicals Industry Revenue Million Forecast, by Type 2019 & 2032
- Table 78: Global Non-Halogenated Flame Retardants Chemicals Industry Volume K Tons Forecast, by Type 2019 & 2032
- Table 79: Global Non-Halogenated Flame Retardants Chemicals Industry Revenue Million Forecast, by End-user Industry 2019 & 2032
- Table 80: Global Non-Halogenated Flame Retardants Chemicals Industry Volume K Tons Forecast, by End-user Industry 2019 & 2032
- Table 81: Global Non-Halogenated Flame Retardants Chemicals Industry Revenue Million Forecast, by Country 2019 & 2032
- Table 82: Global Non-Halogenated Flame Retardants Chemicals Industry Volume K Tons Forecast, by Country 2019 & 2032
- Table 83: United States Non-Halogenated Flame Retardants Chemicals Industry Revenue (Million) Forecast, by Application 2019 & 2032
- Table 84: United States Non-Halogenated Flame Retardants Chemicals Industry Volume (K Tons) Forecast, by Application 2019 & 2032
- Table 85: Canada Non-Halogenated Flame Retardants Chemicals Industry Revenue (Million) Forecast, by Application 2019 & 2032
- Table 86: Canada Non-Halogenated Flame Retardants Chemicals Industry Volume (K Tons) Forecast, by Application 2019 & 2032
- Table 87: Mexico Non-Halogenated Flame Retardants Chemicals Industry Revenue (Million) Forecast, by Application 2019 & 2032
- Table 88: Mexico Non-Halogenated Flame Retardants Chemicals Industry Volume (K Tons) Forecast, by Application 2019 & 2032
- Table 89: Global Non-Halogenated Flame Retardants Chemicals Industry Revenue Million Forecast, by Type 2019 & 2032
- Table 90: Global Non-Halogenated Flame Retardants Chemicals Industry Volume K Tons Forecast, by Type 2019 & 2032
- Table 91: Global Non-Halogenated Flame Retardants Chemicals Industry Revenue Million Forecast, by End-user Industry 2019 & 2032
- Table 92: Global Non-Halogenated Flame Retardants Chemicals Industry Volume K Tons Forecast, by End-user Industry 2019 & 2032
- Table 93: Global Non-Halogenated Flame Retardants Chemicals Industry Revenue Million Forecast, by Country 2019 & 2032
- Table 94: Global Non-Halogenated Flame Retardants Chemicals Industry Volume K Tons Forecast, by Country 2019 & 2032
- Table 95: Germany Non-Halogenated Flame Retardants Chemicals Industry Revenue (Million) Forecast, by Application 2019 & 2032
- Table 96: Germany Non-Halogenated Flame Retardants Chemicals Industry Volume (K Tons) Forecast, by Application 2019 & 2032
- Table 97: United Kingdom Non-Halogenated Flame Retardants Chemicals Industry Revenue (Million) Forecast, by Application 2019 & 2032
- Table 98: United Kingdom Non-Halogenated Flame Retardants Chemicals Industry Volume (K Tons) Forecast, by Application 2019 & 2032
- Table 99: Italy Non-Halogenated Flame Retardants Chemicals Industry Revenue (Million) Forecast, by Application 2019 & 2032
- Table 100: Italy Non-Halogenated Flame Retardants Chemicals Industry Volume (K Tons) Forecast, by Application 2019 & 2032
- Table 101: France Non-Halogenated Flame Retardants Chemicals Industry Revenue (Million) Forecast, by Application 2019 & 2032
- Table 102: France Non-Halogenated Flame Retardants Chemicals Industry Volume (K Tons) Forecast, by Application 2019 & 2032
- Table 103: Rest of Europe Non-Halogenated Flame Retardants Chemicals Industry Revenue (Million) Forecast, by Application 2019 & 2032
- Table 104: Rest of Europe Non-Halogenated Flame Retardants Chemicals Industry Volume (K Tons) Forecast, by Application 2019 & 2032
- Table 105: Global Non-Halogenated Flame Retardants Chemicals Industry Revenue Million Forecast, by Type 2019 & 2032
- Table 106: Global Non-Halogenated Flame Retardants Chemicals Industry Volume K Tons Forecast, by Type 2019 & 2032
- Table 107: Global Non-Halogenated Flame Retardants Chemicals Industry Revenue Million Forecast, by End-user Industry 2019 & 2032
- Table 108: Global Non-Halogenated Flame Retardants Chemicals Industry Volume K Tons Forecast, by End-user Industry 2019 & 2032
- Table 109: Global Non-Halogenated Flame Retardants Chemicals Industry Revenue Million Forecast, by Country 2019 & 2032
- Table 110: Global Non-Halogenated Flame Retardants Chemicals Industry Volume K Tons Forecast, by Country 2019 & 2032
- Table 111: Brazil Non-Halogenated Flame Retardants Chemicals Industry Revenue (Million) Forecast, by Application 2019 & 2032
- Table 112: Brazil Non-Halogenated Flame Retardants Chemicals Industry Volume (K Tons) Forecast, by Application 2019 & 2032
- Table 113: Argentina Non-Halogenated Flame Retardants Chemicals Industry Revenue (Million) Forecast, by Application 2019 & 2032
- Table 114: Argentina Non-Halogenated Flame Retardants Chemicals Industry Volume (K Tons) Forecast, by Application 2019 & 2032
- Table 115: Rest of South America Non-Halogenated Flame Retardants Chemicals Industry Revenue (Million) Forecast, by Application 2019 & 2032
- Table 116: Rest of South America Non-Halogenated Flame Retardants Chemicals Industry Volume (K Tons) Forecast, by Application 2019 & 2032
- Table 117: Global Non-Halogenated Flame Retardants Chemicals Industry Revenue Million Forecast, by Type 2019 & 2032
- Table 118: Global Non-Halogenated Flame Retardants Chemicals Industry Volume K Tons Forecast, by Type 2019 & 2032
- Table 119: Global Non-Halogenated Flame Retardants Chemicals Industry Revenue Million Forecast, by End-user Industry 2019 & 2032
- Table 120: Global Non-Halogenated Flame Retardants Chemicals Industry Volume K Tons Forecast, by End-user Industry 2019 & 2032
- Table 121: Global Non-Halogenated Flame Retardants Chemicals Industry Revenue Million Forecast, by Country 2019 & 2032
- Table 122: Global Non-Halogenated Flame Retardants Chemicals Industry Volume K Tons Forecast, by Country 2019 & 2032
- Table 123: Saudi Arabia Non-Halogenated Flame Retardants Chemicals Industry Revenue (Million) Forecast, by Application 2019 & 2032
- Table 124: Saudi Arabia Non-Halogenated Flame Retardants Chemicals Industry Volume (K Tons) Forecast, by Application 2019 & 2032
- Table 125: South Africa Non-Halogenated Flame Retardants Chemicals Industry Revenue (Million) Forecast, by Application 2019 & 2032
- Table 126: South Africa Non-Halogenated Flame Retardants Chemicals Industry Volume (K Tons) Forecast, by Application 2019 & 2032
- Table 127: Rest of Middle East and Africa Non-Halogenated Flame Retardants Chemicals Industry Revenue (Million) Forecast, by Application 2019 & 2032
- Table 128: Rest of Middle East and Africa Non-Halogenated Flame Retardants Chemicals Industry Volume (K Tons) Forecast, by Application 2019 & 2032
Frequently Asked Questions
1. What is the projected Compound Annual Growth Rate (CAGR) of the Non-Halogenated Flame Retardants Chemicals Industry?
The projected CAGR is approximately > 5.00%.
2. Which companies are prominent players in the Non-Halogenated Flame Retardants Chemicals Industry?
Key companies in the market include ICL, DIC Corporation, TOR Minerals, Clariant, Jiangsu Jacques Technology Co Ltd, MPI Chemie BV, Italmatch Chemicals SpA, LANXESS, Nippon Carbide Indestries Co Inc (Sanwa Chemical Industry Co Ltd), BASF SE, Rin Kagaku Kogyo Co Ltd, Shandong Brother Sci &Tech Co Ltd, Nabaltec AG, Thor, Eti Maden, Apexical Inc, NYACOL Nano Technologies Inc, Huber Engineered Materials, Daihachi Chemical Industry Co Ltd.
3. What are the main segments of the Non-Halogenated Flame Retardants Chemicals Industry?
The market segments include Type, End-user Industry.
4. Can you provide details about the market size?
The market size is estimated to be USD XX Million as of 2022.
5. What are some drivers contributing to market growth?
; Environmental and Health Concerns Regarding Brominated and Other Flame Retardants; Increasing Infrastructure Activities in Asia-Pacific; Rising Consumer Electrical and Electronic Goods Manufacturing.
6. What are the notable trends driving market growth?
Increasing Demand from the Buildings and Construction Industry.
7. Are there any restraints impacting market growth?
; Non-suitability of Hydroxides to High Temperature Applications.
8. Can you provide examples of recent developments in the market?
N/A
9. What pricing options are available for accessing the report?
Pricing options include single-user, multi-user, and enterprise licenses priced at USD 4750, USD 5250, and USD 8750 respectively.
10. Is the market size provided in terms of value or volume?
The market size is provided in terms of value, measured in Million and volume, measured in K Tons.
11. Are there any specific market keywords associated with the report?
Yes, the market keyword associated with the report is "Non-Halogenated Flame Retardants Chemicals Industry," which aids in identifying and referencing the specific market segment covered.
12. How do I determine which pricing option suits my needs best?
The pricing options vary based on user requirements and access needs. Individual users may opt for single-user licenses, while businesses requiring broader access may choose multi-user or enterprise licenses for cost-effective access to the report.
13. Are there any additional resources or data provided in the Non-Halogenated Flame Retardants Chemicals Industry report?
While the report offers comprehensive insights, it's advisable to review the specific contents or supplementary materials provided to ascertain if additional resources or data are available.
14. How can I stay updated on further developments or reports in the Non-Halogenated Flame Retardants Chemicals Industry?
To stay informed about further developments, trends, and reports in the Non-Halogenated Flame Retardants Chemicals Industry, consider subscribing to industry newsletters, following relevant companies and organizations, or regularly checking reputable industry news sources and publications.
Methodology
Step 1 - Identification of Relevant Samples Size from Population Database


Step 2 - Approaches for Defining Global Market Size (Value, Volume* & Price*)

Note*: In applicable scenarios
Step 3 - Data Sources
Primary Research
- Web Analytics
- Survey Reports
- Research Institute
- Latest Research Reports
- Opinion Leaders
Secondary Research
- Annual Reports
- White Paper
- Latest Press Release
- Industry Association
- Paid Database
- Investor Presentations

Step 4 - Data Triangulation
Involves using different sources of information in order to increase the validity of a study
These sources are likely to be stakeholders in a program - participants, other researchers, program staff, other community members, and so on.
Then we put all data in single framework & apply various statistical tools to find out the dynamic on the market.
During the analysis stage, feedback from the stakeholder groups would be compared to determine areas of agreement as well as areas of divergence


