
Key Insights
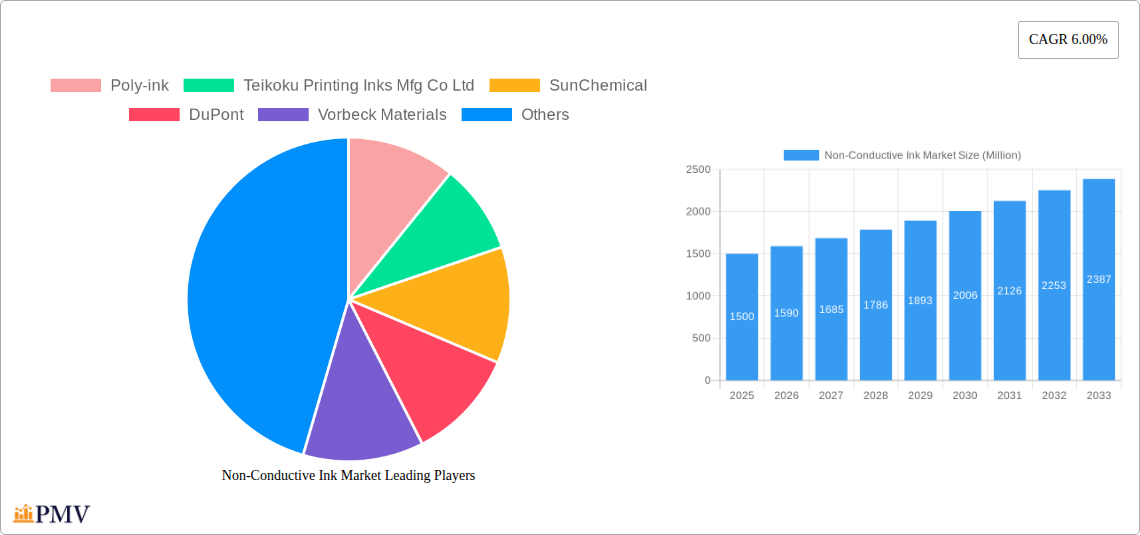
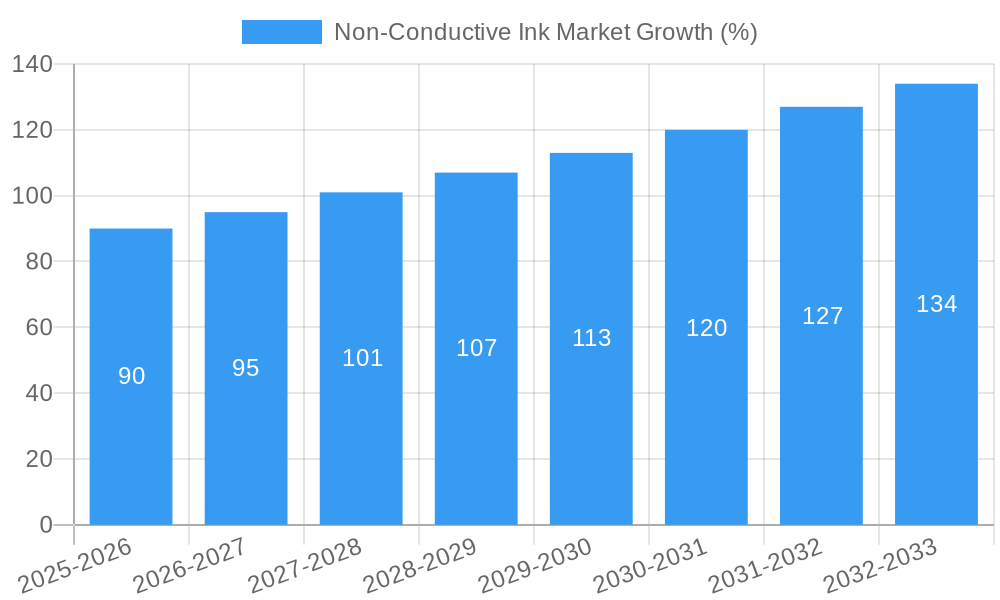
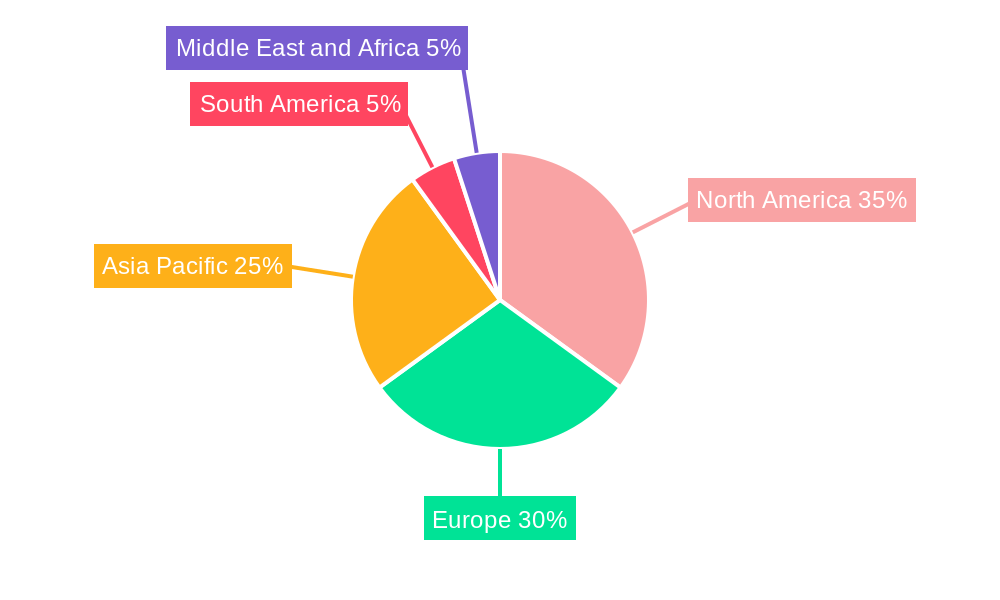
The non-conductive ink market, valued at approximately $1.5 billion in 2025, is projected to experience robust growth, exhibiting a compound annual growth rate (CAGR) of 6% from 2025 to 2033. This expansion is driven by the increasing demand for advanced electronics, particularly in the photovoltaic (PV) panel, printed circuit board (PCB), and LED packaging sectors. The rising adoption of flexible electronics and the miniaturization of electronic components further fuel market growth. Acrylic substrates currently dominate the market due to their cost-effectiveness and ease of processing, but ceramic and glass substrates are gaining traction, driven by the need for improved durability and thermal stability in high-performance applications. Geographic expansion is also a key factor; while North America and Europe currently hold significant market shares, the Asia-Pacific region is poised for substantial growth due to the rapid expansion of electronics manufacturing in countries like China and India. However, market growth may be somewhat constrained by fluctuating raw material prices and concerns about the environmental impact of certain ink formulations. Companies are actively investing in research and development to address these challenges and develop more sustainable, high-performance non-conductive inks.
The competitive landscape is characterized by a mix of established players like DuPont and SunChemical, alongside specialized manufacturers such as Poly-ink and Vorbeck Materials. Strategic partnerships, mergers and acquisitions, and the introduction of innovative ink formulations are shaping the competitive dynamics. The market is witnessing a shift towards inks with enhanced properties, such as improved adhesion, UV resistance, and chemical stability, catering to the evolving demands of diverse applications. Future growth will likely be driven by technological advancements in ink formulation, leading to improved performance characteristics and expanded application possibilities within existing and emerging markets. The focus on sustainability and environmentally friendly inks will also play a significant role in shaping the market's future trajectory.
Dive Deep into the Non-Conductive Ink Market: A Comprehensive Report (2019-2033)
This meticulously researched report provides a comprehensive analysis of the Non-Conductive Ink market, offering invaluable insights for businesses, investors, and industry professionals seeking to navigate this dynamic landscape. The study period spans from 2019 to 2033, with 2025 serving as the base and estimated year. The forecast period extends from 2025 to 2033, while the historical period covers 2019-2024. This report leverages robust data and expert analysis to uncover key market trends, growth drivers, and challenges. The market size is projected to reach xx Million by 2033, exhibiting a CAGR of xx% during the forecast period.
Non-Conductive Ink Market Market Structure & Competitive Dynamics
The Non-Conductive Ink market exhibits a moderately consolidated structure, with key players such as Poly-ink, Teikoku Printing Inks Mfg Co Ltd, SunChemical, DuPont, Vorbeck Materials, Applied Ink Solutions, Henkel Corporation, Creative Materials Inc, Nagase America LLC, and NovaCentrix vying for market share. Market concentration is estimated at xx%, with the top five players holding approximately xx% of the overall market share in 2025. The market is characterized by a dynamic innovation ecosystem, driven by ongoing R&D efforts focused on enhancing ink properties, expanding application areas, and improving manufacturing processes. Regulatory frameworks, particularly concerning environmental regulations and material safety, significantly impact market dynamics. The presence of substitute materials, such as certain polymers and coatings, poses a competitive challenge. End-user trends toward miniaturization and higher performance are shaping demand. The historical period witnessed several M&A activities, with deal values totaling an estimated xx Million. These activities have influenced market consolidation and the competitive landscape. Future M&A activity is predicted to be driven by the quest for technological advancements, expansion into new markets, and enhanced economies of scale.
Non-Conductive Ink Market Industry Trends & Insights
The Non-Conductive Ink market is experiencing robust growth, fueled by several key factors. The rising demand for advanced electronics, particularly in sectors like photovoltaics, printed circuit boards, and LED packaging, is a major driver. Technological advancements in ink formulation and printing techniques are leading to improved performance and cost-effectiveness. Consumer preferences for eco-friendly and sustainable products are pushing manufacturers to develop non-toxic and biodegradable inks. Competitive dynamics are characterized by intense R&D activities, strategic partnerships, and product differentiation strategies. The market is expected to witness significant growth in emerging economies due to increasing infrastructure development and industrialization. Market penetration in specific application segments, such as flexible electronics, is poised for considerable expansion. The overall market CAGR is estimated at xx% during the forecast period, indicating substantial growth potential.
Dominant Markets & Segments in Non-Conductive Ink Market
The global Non-Conductive Ink market demonstrates regional dominance in [Insert Leading Region Here], driven by robust economic growth, supportive government policies, and a well-established electronics manufacturing base. Within this region, [Insert Leading Country Here] stands out as the key market, fueled by [Explain specific factors, e.g., high demand for solar panels, strong government support for renewable energy, thriving electronics industry].
Key Drivers for Dominant Segments:
- Substrate Type:
- Acrylic: Strong demand from the electronics industry due to cost-effectiveness and ease of processing.
- Ceramic: Growing adoption in high-temperature applications due to superior thermal stability.
- Glass: Wide use in LED packaging and photovoltaic panels due to its optical transparency and durability.
- Application:
- Photovoltaic Panels: Significant growth driven by the global push toward renewable energy sources.
- Printed Circuit Board Panels: High demand due to the increasing complexity and miniaturization of electronic devices.
- LED Packaging: Expansion fueled by the widespread adoption of LEDs in lighting and display applications.
Non-Conductive Ink Market Product Innovations
Recent innovations in Non-Conductive Ink technology have focused on enhancing material properties such as viscosity, adhesion, and curing speed. The development of inks with improved UV resistance and durability is also gaining momentum. New applications are emerging in areas like flexible electronics and 3D printing, driven by the need for versatile and adaptable materials. These product advancements offer competitive advantages through improved performance, cost reduction, and enhanced sustainability, enabling manufacturers to cater to the evolving demands of various end-use sectors.
Report Segmentation & Scope
This report offers granular segmentation of the Non-Conductive Ink market across various parameters.
Substrate Type: Acrylic, Ceramic, and Glass segments are analyzed individually, considering their unique properties, market demand, and growth projections. Each segment's market size, growth rate, and competitive landscape are detailed.
Application: The report dissects the Photovoltaic Panels, Printed Circuit Board Panels, and LED Packaging segments. Each application area's market size, growth drivers, and associated technological advancements are thoroughly evaluated. Competitive dynamics within each application area are also examined.
Key Drivers of Non-Conductive Ink Market Growth
The growth of the Non-Conductive Ink market is primarily driven by the increasing demand for advanced electronic devices, the rising adoption of renewable energy technologies, and the growing emphasis on sustainable manufacturing practices. Technological advancements in ink formulation and printing processes have also significantly contributed to market expansion. Favorable government policies supporting the electronics industry and renewable energy initiatives further boost market growth.
Challenges in the Non-Conductive Ink Market Sector
The Non-Conductive Ink market faces several challenges, including stringent environmental regulations impacting material composition and production processes. Supply chain disruptions and volatility in raw material prices pose significant risks. Intense competition among existing players and the emergence of new entrants add pressure on profit margins. These factors can influence market growth and the profitability of companies operating in this sector. The overall impact of these challenges is estimated to result in a xx% reduction in market growth in [specific year].
Leading Players in the Non-Conductive Ink Market Market
- Poly-ink
- Teikoku Printing Inks Mfg Co Ltd
- SunChemical
- DuPont
- Vorbeck Materials
- Applied Ink Solutions
- Henkel Corporation
- Creative Materials Inc
- Nagase America LLC
- NovaCentrix
Key Developments in Non-Conductive Ink Market Sector
- 2023-06: DuPont announced a new line of environmentally friendly Non-Conductive Inks.
- 2022-11: Poly-ink acquired a smaller competitor, expanding its market share.
- 2021-08: Vorbeck Materials secured a major contract with a leading electronics manufacturer. (Further details on specific developments would be included in the full report).
Strategic Non-Conductive Ink Market Market Outlook
The future of the Non-Conductive Ink market appears bright, with continued growth projected due to several factors. The increasing adoption of electronics in various applications, the expansion of renewable energy technologies, and ongoing technological innovation are major growth accelerators. Strategic opportunities exist for companies focusing on sustainability, advanced material development, and efficient manufacturing processes. Further exploration into new application areas will also drive market growth in the coming years.
Non-Conductive Ink Market Segmentation
-
1. Substrate Type
- 1.1. Acrylic
- 1.2. Ceramic
- 1.3. Glass
-
2. Application
- 2.1. Photovoltaic Panels
- 2.2. Printed Circuit Board Panels
- 2.3. LED Packaging
Non-Conductive Ink Market Segmentation By Geography
-
1. Asia Pacific
- 1.1. China
- 1.2. India
- 1.3. Japan
- 1.4. South Korea
- 1.5. Rest of Asia Pacific
-
2. North America
- 2.1. United States
- 2.2. Canada
- 2.3. Mexico
-
3. Europe
- 3.1. Germany
- 3.2. United Kingdom
- 3.3. France
- 3.4. Italy
- 3.5. Rest of Europe
-
4. South America
- 4.1. Brazil
- 4.2. Argentina
- 4.3. Rest of South America
-
5. Middle East and Africa
- 5.1. Saudi Arabia
- 5.2. South Africa
- 5.3. Rest of Middle East and Africa
Non-Conductive Ink Market REPORT HIGHLIGHTS
| Aspects | Details |
|---|---|
| Study Period | 2019-2033 |
| Base Year | 2024 |
| Estimated Year | 2025 |
| Forecast Period | 2025-2033 |
| Historical Period | 2019-2024 |
| Growth Rate | CAGR of 6.00% from 2019-2033 |
| Segmentation |
|
Table of Contents
- 1. Introduction
- 1.1. Research Scope
- 1.2. Market Segmentation
- 1.3. Research Methodology
- 1.4. Definitions and Assumptions
- 2. Executive Summary
- 2.1. Introduction
- 3. Market Dynamics
- 3.1. Introduction
- 3.2. Market Drivers
- 3.2.1. ; Increasing Demand for Printed Circuit Boards; Growing Electronic and Electrical Industry
- 3.3. Market Restrains
- 3.3.1. ; Fluctuation in Raw Material Pricing; Unfavorable Conditions Arising Due to COVID-19 Outbreak
- 3.4. Market Trends
- 3.4.1. Increasing Demand for Printed Circuit Boards
- 4. Market Factor Analysis
- 4.1. Porters Five Forces
- 4.2. Supply/Value Chain
- 4.3. PESTEL analysis
- 4.4. Market Entropy
- 4.5. Patent/Trademark Analysis
- 5. Global Non-Conductive Ink Market Analysis, Insights and Forecast, 2019-2031
- 5.1. Market Analysis, Insights and Forecast - by Substrate Type
- 5.1.1. Acrylic
- 5.1.2. Ceramic
- 5.1.3. Glass
- 5.2. Market Analysis, Insights and Forecast - by Application
- 5.2.1. Photovoltaic Panels
- 5.2.2. Printed Circuit Board Panels
- 5.2.3. LED Packaging
- 5.3. Market Analysis, Insights and Forecast - by Region
- 5.3.1. Asia Pacific
- 5.3.2. North America
- 5.3.3. Europe
- 5.3.4. South America
- 5.3.5. Middle East and Africa
- 5.1. Market Analysis, Insights and Forecast - by Substrate Type
- 6. Asia Pacific Non-Conductive Ink Market Analysis, Insights and Forecast, 2019-2031
- 6.1. Market Analysis, Insights and Forecast - by Substrate Type
- 6.1.1. Acrylic
- 6.1.2. Ceramic
- 6.1.3. Glass
- 6.2. Market Analysis, Insights and Forecast - by Application
- 6.2.1. Photovoltaic Panels
- 6.2.2. Printed Circuit Board Panels
- 6.2.3. LED Packaging
- 6.1. Market Analysis, Insights and Forecast - by Substrate Type
- 7. North America Non-Conductive Ink Market Analysis, Insights and Forecast, 2019-2031
- 7.1. Market Analysis, Insights and Forecast - by Substrate Type
- 7.1.1. Acrylic
- 7.1.2. Ceramic
- 7.1.3. Glass
- 7.2. Market Analysis, Insights and Forecast - by Application
- 7.2.1. Photovoltaic Panels
- 7.2.2. Printed Circuit Board Panels
- 7.2.3. LED Packaging
- 7.1. Market Analysis, Insights and Forecast - by Substrate Type
- 8. Europe Non-Conductive Ink Market Analysis, Insights and Forecast, 2019-2031
- 8.1. Market Analysis, Insights and Forecast - by Substrate Type
- 8.1.1. Acrylic
- 8.1.2. Ceramic
- 8.1.3. Glass
- 8.2. Market Analysis, Insights and Forecast - by Application
- 8.2.1. Photovoltaic Panels
- 8.2.2. Printed Circuit Board Panels
- 8.2.3. LED Packaging
- 8.1. Market Analysis, Insights and Forecast - by Substrate Type
- 9. South America Non-Conductive Ink Market Analysis, Insights and Forecast, 2019-2031
- 9.1. Market Analysis, Insights and Forecast - by Substrate Type
- 9.1.1. Acrylic
- 9.1.2. Ceramic
- 9.1.3. Glass
- 9.2. Market Analysis, Insights and Forecast - by Application
- 9.2.1. Photovoltaic Panels
- 9.2.2. Printed Circuit Board Panels
- 9.2.3. LED Packaging
- 9.1. Market Analysis, Insights and Forecast - by Substrate Type
- 10. Middle East and Africa Non-Conductive Ink Market Analysis, Insights and Forecast, 2019-2031
- 10.1. Market Analysis, Insights and Forecast - by Substrate Type
- 10.1.1. Acrylic
- 10.1.2. Ceramic
- 10.1.3. Glass
- 10.2. Market Analysis, Insights and Forecast - by Application
- 10.2.1. Photovoltaic Panels
- 10.2.2. Printed Circuit Board Panels
- 10.2.3. LED Packaging
- 10.1. Market Analysis, Insights and Forecast - by Substrate Type
- 11. North America Non-Conductive Ink Market Analysis, Insights and Forecast, 2019-2031
- 11.1. Market Analysis, Insights and Forecast - By Country/Sub-region
- 11.1.1 United States
- 11.1.2 Canada
- 11.1.3 Mexico
- 12. Europe Non-Conductive Ink Market Analysis, Insights and Forecast, 2019-2031
- 12.1. Market Analysis, Insights and Forecast - By Country/Sub-region
- 12.1.1 Germany
- 12.1.2 France
- 12.1.3 Italy
- 12.1.4 United Kingdom
- 12.1.5 Netherlands
- 12.1.6 Rest of Europe
- 13. Asia Pacific Non-Conductive Ink Market Analysis, Insights and Forecast, 2019-2031
- 13.1. Market Analysis, Insights and Forecast - By Country/Sub-region
- 13.1.1 China
- 13.1.2 Japan
- 13.1.3 India
- 13.1.4 South Korea
- 13.1.5 Taiwan
- 13.1.6 Australia
- 13.1.7 Rest of Asia-Pacific
- 14. South America Non-Conductive Ink Market Analysis, Insights and Forecast, 2019-2031
- 14.1. Market Analysis, Insights and Forecast - By Country/Sub-region
- 14.1.1 Brazil
- 14.1.2 Argentina
- 14.1.3 Rest of South America
- 15. Middle East and Africa Non-Conductive Ink Market Analysis, Insights and Forecast, 2019-2031
- 15.1. Market Analysis, Insights and Forecast - By Country/Sub-region
- 15.1.1 Middle East
- 15.1.2 Africa
- 16. Competitive Analysis
- 16.1. Global Market Share Analysis 2024
- 16.2. Company Profiles
- 16.2.1 Poly-ink
- 16.2.1.1. Overview
- 16.2.1.2. Products
- 16.2.1.3. SWOT Analysis
- 16.2.1.4. Recent Developments
- 16.2.1.5. Financials (Based on Availability)
- 16.2.2 Teikoku Printing Inks Mfg Co Ltd
- 16.2.2.1. Overview
- 16.2.2.2. Products
- 16.2.2.3. SWOT Analysis
- 16.2.2.4. Recent Developments
- 16.2.2.5. Financials (Based on Availability)
- 16.2.3 SunChemical
- 16.2.3.1. Overview
- 16.2.3.2. Products
- 16.2.3.3. SWOT Analysis
- 16.2.3.4. Recent Developments
- 16.2.3.5. Financials (Based on Availability)
- 16.2.4 DuPont
- 16.2.4.1. Overview
- 16.2.4.2. Products
- 16.2.4.3. SWOT Analysis
- 16.2.4.4. Recent Developments
- 16.2.4.5. Financials (Based on Availability)
- 16.2.5 Vorbeck Materials
- 16.2.5.1. Overview
- 16.2.5.2. Products
- 16.2.5.3. SWOT Analysis
- 16.2.5.4. Recent Developments
- 16.2.5.5. Financials (Based on Availability)
- 16.2.6 Applied Ink Solutions
- 16.2.6.1. Overview
- 16.2.6.2. Products
- 16.2.6.3. SWOT Analysis
- 16.2.6.4. Recent Developments
- 16.2.6.5. Financials (Based on Availability)
- 16.2.7 Henkel Corporation
- 16.2.7.1. Overview
- 16.2.7.2. Products
- 16.2.7.3. SWOT Analysis
- 16.2.7.4. Recent Developments
- 16.2.7.5. Financials (Based on Availability)
- 16.2.8 Creative Materials Inc
- 16.2.8.1. Overview
- 16.2.8.2. Products
- 16.2.8.3. SWOT Analysis
- 16.2.8.4. Recent Developments
- 16.2.8.5. Financials (Based on Availability)
- 16.2.9 Nagase America LLC
- 16.2.9.1. Overview
- 16.2.9.2. Products
- 16.2.9.3. SWOT Analysis
- 16.2.9.4. Recent Developments
- 16.2.9.5. Financials (Based on Availability)
- 16.2.10 NovaCentrix
- 16.2.10.1. Overview
- 16.2.10.2. Products
- 16.2.10.3. SWOT Analysis
- 16.2.10.4. Recent Developments
- 16.2.10.5. Financials (Based on Availability)
- 16.2.1 Poly-ink
List of Figures
- Figure 1: Global Non-Conductive Ink Market Revenue Breakdown (Million, %) by Region 2024 & 2032
- Figure 2: Global Non-Conductive Ink Market Volume Breakdown (K Tons, %) by Region 2024 & 2032
- Figure 3: North America Non-Conductive Ink Market Revenue (Million), by Country 2024 & 2032
- Figure 4: North America Non-Conductive Ink Market Volume (K Tons), by Country 2024 & 2032
- Figure 5: North America Non-Conductive Ink Market Revenue Share (%), by Country 2024 & 2032
- Figure 6: North America Non-Conductive Ink Market Volume Share (%), by Country 2024 & 2032
- Figure 7: Europe Non-Conductive Ink Market Revenue (Million), by Country 2024 & 2032
- Figure 8: Europe Non-Conductive Ink Market Volume (K Tons), by Country 2024 & 2032
- Figure 9: Europe Non-Conductive Ink Market Revenue Share (%), by Country 2024 & 2032
- Figure 10: Europe Non-Conductive Ink Market Volume Share (%), by Country 2024 & 2032
- Figure 11: Asia Pacific Non-Conductive Ink Market Revenue (Million), by Country 2024 & 2032
- Figure 12: Asia Pacific Non-Conductive Ink Market Volume (K Tons), by Country 2024 & 2032
- Figure 13: Asia Pacific Non-Conductive Ink Market Revenue Share (%), by Country 2024 & 2032
- Figure 14: Asia Pacific Non-Conductive Ink Market Volume Share (%), by Country 2024 & 2032
- Figure 15: South America Non-Conductive Ink Market Revenue (Million), by Country 2024 & 2032
- Figure 16: South America Non-Conductive Ink Market Volume (K Tons), by Country 2024 & 2032
- Figure 17: South America Non-Conductive Ink Market Revenue Share (%), by Country 2024 & 2032
- Figure 18: South America Non-Conductive Ink Market Volume Share (%), by Country 2024 & 2032
- Figure 19: Middle East and Africa Non-Conductive Ink Market Revenue (Million), by Country 2024 & 2032
- Figure 20: Middle East and Africa Non-Conductive Ink Market Volume (K Tons), by Country 2024 & 2032
- Figure 21: Middle East and Africa Non-Conductive Ink Market Revenue Share (%), by Country 2024 & 2032
- Figure 22: Middle East and Africa Non-Conductive Ink Market Volume Share (%), by Country 2024 & 2032
- Figure 23: Asia Pacific Non-Conductive Ink Market Revenue (Million), by Substrate Type 2024 & 2032
- Figure 24: Asia Pacific Non-Conductive Ink Market Volume (K Tons), by Substrate Type 2024 & 2032
- Figure 25: Asia Pacific Non-Conductive Ink Market Revenue Share (%), by Substrate Type 2024 & 2032
- Figure 26: Asia Pacific Non-Conductive Ink Market Volume Share (%), by Substrate Type 2024 & 2032
- Figure 27: Asia Pacific Non-Conductive Ink Market Revenue (Million), by Application 2024 & 2032
- Figure 28: Asia Pacific Non-Conductive Ink Market Volume (K Tons), by Application 2024 & 2032
- Figure 29: Asia Pacific Non-Conductive Ink Market Revenue Share (%), by Application 2024 & 2032
- Figure 30: Asia Pacific Non-Conductive Ink Market Volume Share (%), by Application 2024 & 2032
- Figure 31: Asia Pacific Non-Conductive Ink Market Revenue (Million), by Country 2024 & 2032
- Figure 32: Asia Pacific Non-Conductive Ink Market Volume (K Tons), by Country 2024 & 2032
- Figure 33: Asia Pacific Non-Conductive Ink Market Revenue Share (%), by Country 2024 & 2032
- Figure 34: Asia Pacific Non-Conductive Ink Market Volume Share (%), by Country 2024 & 2032
- Figure 35: North America Non-Conductive Ink Market Revenue (Million), by Substrate Type 2024 & 2032
- Figure 36: North America Non-Conductive Ink Market Volume (K Tons), by Substrate Type 2024 & 2032
- Figure 37: North America Non-Conductive Ink Market Revenue Share (%), by Substrate Type 2024 & 2032
- Figure 38: North America Non-Conductive Ink Market Volume Share (%), by Substrate Type 2024 & 2032
- Figure 39: North America Non-Conductive Ink Market Revenue (Million), by Application 2024 & 2032
- Figure 40: North America Non-Conductive Ink Market Volume (K Tons), by Application 2024 & 2032
- Figure 41: North America Non-Conductive Ink Market Revenue Share (%), by Application 2024 & 2032
- Figure 42: North America Non-Conductive Ink Market Volume Share (%), by Application 2024 & 2032
- Figure 43: North America Non-Conductive Ink Market Revenue (Million), by Country 2024 & 2032
- Figure 44: North America Non-Conductive Ink Market Volume (K Tons), by Country 2024 & 2032
- Figure 45: North America Non-Conductive Ink Market Revenue Share (%), by Country 2024 & 2032
- Figure 46: North America Non-Conductive Ink Market Volume Share (%), by Country 2024 & 2032
- Figure 47: Europe Non-Conductive Ink Market Revenue (Million), by Substrate Type 2024 & 2032
- Figure 48: Europe Non-Conductive Ink Market Volume (K Tons), by Substrate Type 2024 & 2032
- Figure 49: Europe Non-Conductive Ink Market Revenue Share (%), by Substrate Type 2024 & 2032
- Figure 50: Europe Non-Conductive Ink Market Volume Share (%), by Substrate Type 2024 & 2032
- Figure 51: Europe Non-Conductive Ink Market Revenue (Million), by Application 2024 & 2032
- Figure 52: Europe Non-Conductive Ink Market Volume (K Tons), by Application 2024 & 2032
- Figure 53: Europe Non-Conductive Ink Market Revenue Share (%), by Application 2024 & 2032
- Figure 54: Europe Non-Conductive Ink Market Volume Share (%), by Application 2024 & 2032
- Figure 55: Europe Non-Conductive Ink Market Revenue (Million), by Country 2024 & 2032
- Figure 56: Europe Non-Conductive Ink Market Volume (K Tons), by Country 2024 & 2032
- Figure 57: Europe Non-Conductive Ink Market Revenue Share (%), by Country 2024 & 2032
- Figure 58: Europe Non-Conductive Ink Market Volume Share (%), by Country 2024 & 2032
- Figure 59: South America Non-Conductive Ink Market Revenue (Million), by Substrate Type 2024 & 2032
- Figure 60: South America Non-Conductive Ink Market Volume (K Tons), by Substrate Type 2024 & 2032
- Figure 61: South America Non-Conductive Ink Market Revenue Share (%), by Substrate Type 2024 & 2032
- Figure 62: South America Non-Conductive Ink Market Volume Share (%), by Substrate Type 2024 & 2032
- Figure 63: South America Non-Conductive Ink Market Revenue (Million), by Application 2024 & 2032
- Figure 64: South America Non-Conductive Ink Market Volume (K Tons), by Application 2024 & 2032
- Figure 65: South America Non-Conductive Ink Market Revenue Share (%), by Application 2024 & 2032
- Figure 66: South America Non-Conductive Ink Market Volume Share (%), by Application 2024 & 2032
- Figure 67: South America Non-Conductive Ink Market Revenue (Million), by Country 2024 & 2032
- Figure 68: South America Non-Conductive Ink Market Volume (K Tons), by Country 2024 & 2032
- Figure 69: South America Non-Conductive Ink Market Revenue Share (%), by Country 2024 & 2032
- Figure 70: South America Non-Conductive Ink Market Volume Share (%), by Country 2024 & 2032
- Figure 71: Middle East and Africa Non-Conductive Ink Market Revenue (Million), by Substrate Type 2024 & 2032
- Figure 72: Middle East and Africa Non-Conductive Ink Market Volume (K Tons), by Substrate Type 2024 & 2032
- Figure 73: Middle East and Africa Non-Conductive Ink Market Revenue Share (%), by Substrate Type 2024 & 2032
- Figure 74: Middle East and Africa Non-Conductive Ink Market Volume Share (%), by Substrate Type 2024 & 2032
- Figure 75: Middle East and Africa Non-Conductive Ink Market Revenue (Million), by Application 2024 & 2032
- Figure 76: Middle East and Africa Non-Conductive Ink Market Volume (K Tons), by Application 2024 & 2032
- Figure 77: Middle East and Africa Non-Conductive Ink Market Revenue Share (%), by Application 2024 & 2032
- Figure 78: Middle East and Africa Non-Conductive Ink Market Volume Share (%), by Application 2024 & 2032
- Figure 79: Middle East and Africa Non-Conductive Ink Market Revenue (Million), by Country 2024 & 2032
- Figure 80: Middle East and Africa Non-Conductive Ink Market Volume (K Tons), by Country 2024 & 2032
- Figure 81: Middle East and Africa Non-Conductive Ink Market Revenue Share (%), by Country 2024 & 2032
- Figure 82: Middle East and Africa Non-Conductive Ink Market Volume Share (%), by Country 2024 & 2032
List of Tables
- Table 1: Global Non-Conductive Ink Market Revenue Million Forecast, by Region 2019 & 2032
- Table 2: Global Non-Conductive Ink Market Volume K Tons Forecast, by Region 2019 & 2032
- Table 3: Global Non-Conductive Ink Market Revenue Million Forecast, by Substrate Type 2019 & 2032
- Table 4: Global Non-Conductive Ink Market Volume K Tons Forecast, by Substrate Type 2019 & 2032
- Table 5: Global Non-Conductive Ink Market Revenue Million Forecast, by Application 2019 & 2032
- Table 6: Global Non-Conductive Ink Market Volume K Tons Forecast, by Application 2019 & 2032
- Table 7: Global Non-Conductive Ink Market Revenue Million Forecast, by Region 2019 & 2032
- Table 8: Global Non-Conductive Ink Market Volume K Tons Forecast, by Region 2019 & 2032
- Table 9: Global Non-Conductive Ink Market Revenue Million Forecast, by Country 2019 & 2032
- Table 10: Global Non-Conductive Ink Market Volume K Tons Forecast, by Country 2019 & 2032
- Table 11: United States Non-Conductive Ink Market Revenue (Million) Forecast, by Application 2019 & 2032
- Table 12: United States Non-Conductive Ink Market Volume (K Tons) Forecast, by Application 2019 & 2032
- Table 13: Canada Non-Conductive Ink Market Revenue (Million) Forecast, by Application 2019 & 2032
- Table 14: Canada Non-Conductive Ink Market Volume (K Tons) Forecast, by Application 2019 & 2032
- Table 15: Mexico Non-Conductive Ink Market Revenue (Million) Forecast, by Application 2019 & 2032
- Table 16: Mexico Non-Conductive Ink Market Volume (K Tons) Forecast, by Application 2019 & 2032
- Table 17: Global Non-Conductive Ink Market Revenue Million Forecast, by Country 2019 & 2032
- Table 18: Global Non-Conductive Ink Market Volume K Tons Forecast, by Country 2019 & 2032
- Table 19: Germany Non-Conductive Ink Market Revenue (Million) Forecast, by Application 2019 & 2032
- Table 20: Germany Non-Conductive Ink Market Volume (K Tons) Forecast, by Application 2019 & 2032
- Table 21: France Non-Conductive Ink Market Revenue (Million) Forecast, by Application 2019 & 2032
- Table 22: France Non-Conductive Ink Market Volume (K Tons) Forecast, by Application 2019 & 2032
- Table 23: Italy Non-Conductive Ink Market Revenue (Million) Forecast, by Application 2019 & 2032
- Table 24: Italy Non-Conductive Ink Market Volume (K Tons) Forecast, by Application 2019 & 2032
- Table 25: United Kingdom Non-Conductive Ink Market Revenue (Million) Forecast, by Application 2019 & 2032
- Table 26: United Kingdom Non-Conductive Ink Market Volume (K Tons) Forecast, by Application 2019 & 2032
- Table 27: Netherlands Non-Conductive Ink Market Revenue (Million) Forecast, by Application 2019 & 2032
- Table 28: Netherlands Non-Conductive Ink Market Volume (K Tons) Forecast, by Application 2019 & 2032
- Table 29: Rest of Europe Non-Conductive Ink Market Revenue (Million) Forecast, by Application 2019 & 2032
- Table 30: Rest of Europe Non-Conductive Ink Market Volume (K Tons) Forecast, by Application 2019 & 2032
- Table 31: Global Non-Conductive Ink Market Revenue Million Forecast, by Country 2019 & 2032
- Table 32: Global Non-Conductive Ink Market Volume K Tons Forecast, by Country 2019 & 2032
- Table 33: China Non-Conductive Ink Market Revenue (Million) Forecast, by Application 2019 & 2032
- Table 34: China Non-Conductive Ink Market Volume (K Tons) Forecast, by Application 2019 & 2032
- Table 35: Japan Non-Conductive Ink Market Revenue (Million) Forecast, by Application 2019 & 2032
- Table 36: Japan Non-Conductive Ink Market Volume (K Tons) Forecast, by Application 2019 & 2032
- Table 37: India Non-Conductive Ink Market Revenue (Million) Forecast, by Application 2019 & 2032
- Table 38: India Non-Conductive Ink Market Volume (K Tons) Forecast, by Application 2019 & 2032
- Table 39: South Korea Non-Conductive Ink Market Revenue (Million) Forecast, by Application 2019 & 2032
- Table 40: South Korea Non-Conductive Ink Market Volume (K Tons) Forecast, by Application 2019 & 2032
- Table 41: Taiwan Non-Conductive Ink Market Revenue (Million) Forecast, by Application 2019 & 2032
- Table 42: Taiwan Non-Conductive Ink Market Volume (K Tons) Forecast, by Application 2019 & 2032
- Table 43: Australia Non-Conductive Ink Market Revenue (Million) Forecast, by Application 2019 & 2032
- Table 44: Australia Non-Conductive Ink Market Volume (K Tons) Forecast, by Application 2019 & 2032
- Table 45: Rest of Asia-Pacific Non-Conductive Ink Market Revenue (Million) Forecast, by Application 2019 & 2032
- Table 46: Rest of Asia-Pacific Non-Conductive Ink Market Volume (K Tons) Forecast, by Application 2019 & 2032
- Table 47: Global Non-Conductive Ink Market Revenue Million Forecast, by Country 2019 & 2032
- Table 48: Global Non-Conductive Ink Market Volume K Tons Forecast, by Country 2019 & 2032
- Table 49: Brazil Non-Conductive Ink Market Revenue (Million) Forecast, by Application 2019 & 2032
- Table 50: Brazil Non-Conductive Ink Market Volume (K Tons) Forecast, by Application 2019 & 2032
- Table 51: Argentina Non-Conductive Ink Market Revenue (Million) Forecast, by Application 2019 & 2032
- Table 52: Argentina Non-Conductive Ink Market Volume (K Tons) Forecast, by Application 2019 & 2032
- Table 53: Rest of South America Non-Conductive Ink Market Revenue (Million) Forecast, by Application 2019 & 2032
- Table 54: Rest of South America Non-Conductive Ink Market Volume (K Tons) Forecast, by Application 2019 & 2032
- Table 55: Global Non-Conductive Ink Market Revenue Million Forecast, by Country 2019 & 2032
- Table 56: Global Non-Conductive Ink Market Volume K Tons Forecast, by Country 2019 & 2032
- Table 57: Middle East Non-Conductive Ink Market Revenue (Million) Forecast, by Application 2019 & 2032
- Table 58: Middle East Non-Conductive Ink Market Volume (K Tons) Forecast, by Application 2019 & 2032
- Table 59: Africa Non-Conductive Ink Market Revenue (Million) Forecast, by Application 2019 & 2032
- Table 60: Africa Non-Conductive Ink Market Volume (K Tons) Forecast, by Application 2019 & 2032
- Table 61: Global Non-Conductive Ink Market Revenue Million Forecast, by Substrate Type 2019 & 2032
- Table 62: Global Non-Conductive Ink Market Volume K Tons Forecast, by Substrate Type 2019 & 2032
- Table 63: Global Non-Conductive Ink Market Revenue Million Forecast, by Application 2019 & 2032
- Table 64: Global Non-Conductive Ink Market Volume K Tons Forecast, by Application 2019 & 2032
- Table 65: Global Non-Conductive Ink Market Revenue Million Forecast, by Country 2019 & 2032
- Table 66: Global Non-Conductive Ink Market Volume K Tons Forecast, by Country 2019 & 2032
- Table 67: China Non-Conductive Ink Market Revenue (Million) Forecast, by Application 2019 & 2032
- Table 68: China Non-Conductive Ink Market Volume (K Tons) Forecast, by Application 2019 & 2032
- Table 69: India Non-Conductive Ink Market Revenue (Million) Forecast, by Application 2019 & 2032
- Table 70: India Non-Conductive Ink Market Volume (K Tons) Forecast, by Application 2019 & 2032
- Table 71: Japan Non-Conductive Ink Market Revenue (Million) Forecast, by Application 2019 & 2032
- Table 72: Japan Non-Conductive Ink Market Volume (K Tons) Forecast, by Application 2019 & 2032
- Table 73: South Korea Non-Conductive Ink Market Revenue (Million) Forecast, by Application 2019 & 2032
- Table 74: South Korea Non-Conductive Ink Market Volume (K Tons) Forecast, by Application 2019 & 2032
- Table 75: Rest of Asia Pacific Non-Conductive Ink Market Revenue (Million) Forecast, by Application 2019 & 2032
- Table 76: Rest of Asia Pacific Non-Conductive Ink Market Volume (K Tons) Forecast, by Application 2019 & 2032
- Table 77: Global Non-Conductive Ink Market Revenue Million Forecast, by Substrate Type 2019 & 2032
- Table 78: Global Non-Conductive Ink Market Volume K Tons Forecast, by Substrate Type 2019 & 2032
- Table 79: Global Non-Conductive Ink Market Revenue Million Forecast, by Application 2019 & 2032
- Table 80: Global Non-Conductive Ink Market Volume K Tons Forecast, by Application 2019 & 2032
- Table 81: Global Non-Conductive Ink Market Revenue Million Forecast, by Country 2019 & 2032
- Table 82: Global Non-Conductive Ink Market Volume K Tons Forecast, by Country 2019 & 2032
- Table 83: United States Non-Conductive Ink Market Revenue (Million) Forecast, by Application 2019 & 2032
- Table 84: United States Non-Conductive Ink Market Volume (K Tons) Forecast, by Application 2019 & 2032
- Table 85: Canada Non-Conductive Ink Market Revenue (Million) Forecast, by Application 2019 & 2032
- Table 86: Canada Non-Conductive Ink Market Volume (K Tons) Forecast, by Application 2019 & 2032
- Table 87: Mexico Non-Conductive Ink Market Revenue (Million) Forecast, by Application 2019 & 2032
- Table 88: Mexico Non-Conductive Ink Market Volume (K Tons) Forecast, by Application 2019 & 2032
- Table 89: Global Non-Conductive Ink Market Revenue Million Forecast, by Substrate Type 2019 & 2032
- Table 90: Global Non-Conductive Ink Market Volume K Tons Forecast, by Substrate Type 2019 & 2032
- Table 91: Global Non-Conductive Ink Market Revenue Million Forecast, by Application 2019 & 2032
- Table 92: Global Non-Conductive Ink Market Volume K Tons Forecast, by Application 2019 & 2032
- Table 93: Global Non-Conductive Ink Market Revenue Million Forecast, by Country 2019 & 2032
- Table 94: Global Non-Conductive Ink Market Volume K Tons Forecast, by Country 2019 & 2032
- Table 95: Germany Non-Conductive Ink Market Revenue (Million) Forecast, by Application 2019 & 2032
- Table 96: Germany Non-Conductive Ink Market Volume (K Tons) Forecast, by Application 2019 & 2032
- Table 97: United Kingdom Non-Conductive Ink Market Revenue (Million) Forecast, by Application 2019 & 2032
- Table 98: United Kingdom Non-Conductive Ink Market Volume (K Tons) Forecast, by Application 2019 & 2032
- Table 99: France Non-Conductive Ink Market Revenue (Million) Forecast, by Application 2019 & 2032
- Table 100: France Non-Conductive Ink Market Volume (K Tons) Forecast, by Application 2019 & 2032
- Table 101: Italy Non-Conductive Ink Market Revenue (Million) Forecast, by Application 2019 & 2032
- Table 102: Italy Non-Conductive Ink Market Volume (K Tons) Forecast, by Application 2019 & 2032
- Table 103: Rest of Europe Non-Conductive Ink Market Revenue (Million) Forecast, by Application 2019 & 2032
- Table 104: Rest of Europe Non-Conductive Ink Market Volume (K Tons) Forecast, by Application 2019 & 2032
- Table 105: Global Non-Conductive Ink Market Revenue Million Forecast, by Substrate Type 2019 & 2032
- Table 106: Global Non-Conductive Ink Market Volume K Tons Forecast, by Substrate Type 2019 & 2032
- Table 107: Global Non-Conductive Ink Market Revenue Million Forecast, by Application 2019 & 2032
- Table 108: Global Non-Conductive Ink Market Volume K Tons Forecast, by Application 2019 & 2032
- Table 109: Global Non-Conductive Ink Market Revenue Million Forecast, by Country 2019 & 2032
- Table 110: Global Non-Conductive Ink Market Volume K Tons Forecast, by Country 2019 & 2032
- Table 111: Brazil Non-Conductive Ink Market Revenue (Million) Forecast, by Application 2019 & 2032
- Table 112: Brazil Non-Conductive Ink Market Volume (K Tons) Forecast, by Application 2019 & 2032
- Table 113: Argentina Non-Conductive Ink Market Revenue (Million) Forecast, by Application 2019 & 2032
- Table 114: Argentina Non-Conductive Ink Market Volume (K Tons) Forecast, by Application 2019 & 2032
- Table 115: Rest of South America Non-Conductive Ink Market Revenue (Million) Forecast, by Application 2019 & 2032
- Table 116: Rest of South America Non-Conductive Ink Market Volume (K Tons) Forecast, by Application 2019 & 2032
- Table 117: Global Non-Conductive Ink Market Revenue Million Forecast, by Substrate Type 2019 & 2032
- Table 118: Global Non-Conductive Ink Market Volume K Tons Forecast, by Substrate Type 2019 & 2032
- Table 119: Global Non-Conductive Ink Market Revenue Million Forecast, by Application 2019 & 2032
- Table 120: Global Non-Conductive Ink Market Volume K Tons Forecast, by Application 2019 & 2032
- Table 121: Global Non-Conductive Ink Market Revenue Million Forecast, by Country 2019 & 2032
- Table 122: Global Non-Conductive Ink Market Volume K Tons Forecast, by Country 2019 & 2032
- Table 123: Saudi Arabia Non-Conductive Ink Market Revenue (Million) Forecast, by Application 2019 & 2032
- Table 124: Saudi Arabia Non-Conductive Ink Market Volume (K Tons) Forecast, by Application 2019 & 2032
- Table 125: South Africa Non-Conductive Ink Market Revenue (Million) Forecast, by Application 2019 & 2032
- Table 126: South Africa Non-Conductive Ink Market Volume (K Tons) Forecast, by Application 2019 & 2032
- Table 127: Rest of Middle East and Africa Non-Conductive Ink Market Revenue (Million) Forecast, by Application 2019 & 2032
- Table 128: Rest of Middle East and Africa Non-Conductive Ink Market Volume (K Tons) Forecast, by Application 2019 & 2032
Frequently Asked Questions
1. What is the projected Compound Annual Growth Rate (CAGR) of the Non-Conductive Ink Market?
The projected CAGR is approximately 6.00%.
2. Which companies are prominent players in the Non-Conductive Ink Market?
Key companies in the market include Poly-ink, Teikoku Printing Inks Mfg Co Ltd, SunChemical, DuPont, Vorbeck Materials, Applied Ink Solutions, Henkel Corporation, Creative Materials Inc, Nagase America LLC, NovaCentrix.
3. What are the main segments of the Non-Conductive Ink Market?
The market segments include Substrate Type, Application.
4. Can you provide details about the market size?
The market size is estimated to be USD XX Million as of 2022.
5. What are some drivers contributing to market growth?
; Increasing Demand for Printed Circuit Boards; Growing Electronic and Electrical Industry.
6. What are the notable trends driving market growth?
Increasing Demand for Printed Circuit Boards.
7. Are there any restraints impacting market growth?
; Fluctuation in Raw Material Pricing; Unfavorable Conditions Arising Due to COVID-19 Outbreak.
8. Can you provide examples of recent developments in the market?
N/A
9. What pricing options are available for accessing the report?
Pricing options include single-user, multi-user, and enterprise licenses priced at USD 4750, USD 5250, and USD 8750 respectively.
10. Is the market size provided in terms of value or volume?
The market size is provided in terms of value, measured in Million and volume, measured in K Tons.
11. Are there any specific market keywords associated with the report?
Yes, the market keyword associated with the report is "Non-Conductive Ink Market," which aids in identifying and referencing the specific market segment covered.
12. How do I determine which pricing option suits my needs best?
The pricing options vary based on user requirements and access needs. Individual users may opt for single-user licenses, while businesses requiring broader access may choose multi-user or enterprise licenses for cost-effective access to the report.
13. Are there any additional resources or data provided in the Non-Conductive Ink Market report?
While the report offers comprehensive insights, it's advisable to review the specific contents or supplementary materials provided to ascertain if additional resources or data are available.
14. How can I stay updated on further developments or reports in the Non-Conductive Ink Market?
To stay informed about further developments, trends, and reports in the Non-Conductive Ink Market, consider subscribing to industry newsletters, following relevant companies and organizations, or regularly checking reputable industry news sources and publications.
Methodology
Step 1 - Identification of Relevant Samples Size from Population Database


Step 2 - Approaches for Defining Global Market Size (Value, Volume* & Price*)

Note*: In applicable scenarios
Step 3 - Data Sources
Primary Research
- Web Analytics
- Survey Reports
- Research Institute
- Latest Research Reports
- Opinion Leaders
Secondary Research
- Annual Reports
- White Paper
- Latest Press Release
- Industry Association
- Paid Database
- Investor Presentations

Step 4 - Data Triangulation
Involves using different sources of information in order to increase the validity of a study
These sources are likely to be stakeholders in a program - participants, other researchers, program staff, other community members, and so on.
Then we put all data in single framework & apply various statistical tools to find out the dynamic on the market.
During the analysis stage, feedback from the stakeholder groups would be compared to determine areas of agreement as well as areas of divergence


