
Key Insights
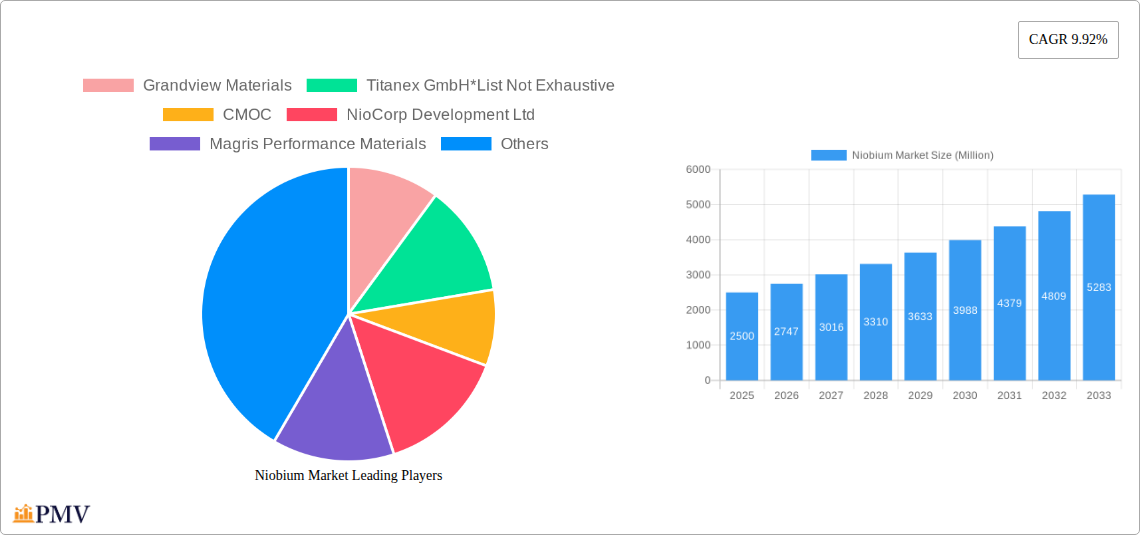
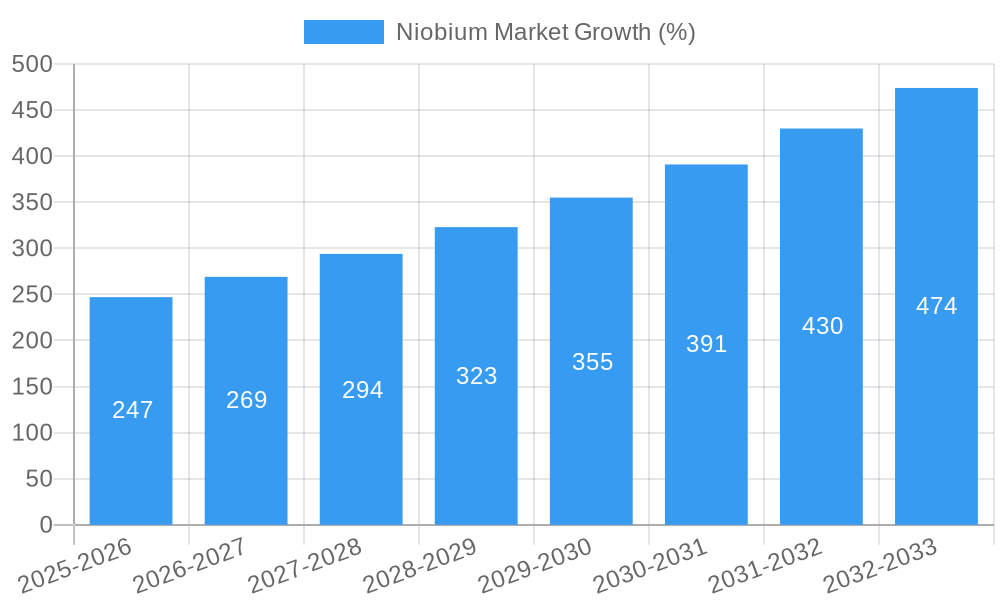
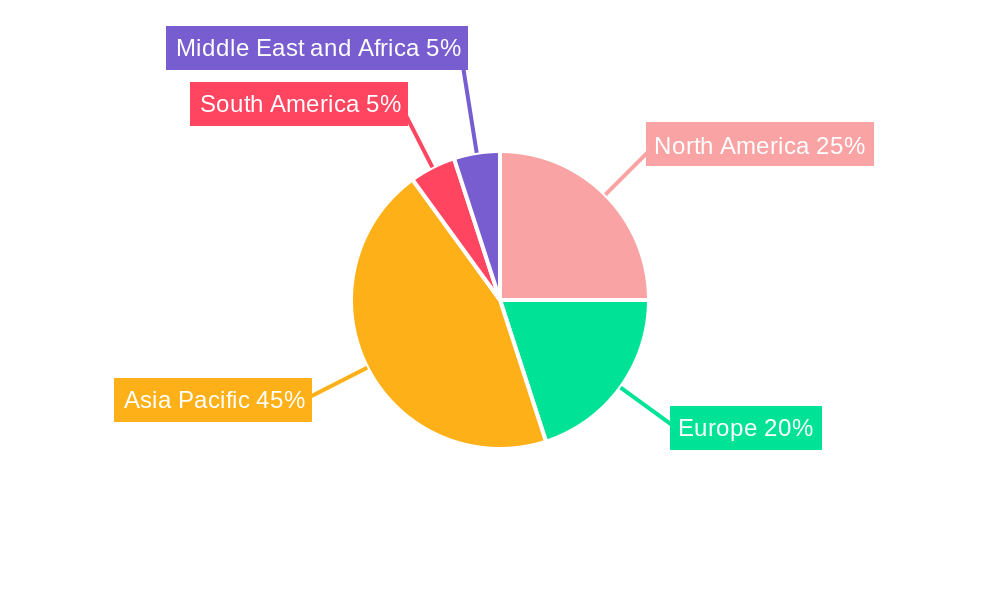
The global niobium market is experiencing robust growth, projected to reach a substantial size by 2033. The 9.92% CAGR indicates significant expansion driven by increasing demand across various sectors. Key drivers include the rising adoption of niobium in high-strength low-alloy (HSLA) steels for construction and automotive applications, its crucial role in superalloys for aerospace and defense, and its burgeoning use in batteries and superconducting magnets. Growing infrastructure development, particularly in rapidly developing economies in Asia-Pacific, further fuels market expansion. The increasing use of niobium in advanced materials for energy-efficient technologies also contributes significantly. While supply chain disruptions and price volatility remain potential restraints, ongoing research and development efforts focused on improving extraction processes and exploring new applications are likely to mitigate these challenges. Segment-wise, ferroniobium currently holds the largest market share due to its extensive use in steel production; however, the niobium oxide and niobium metal segments are witnessing rapid growth, fueled by their applications in high-value sectors such as aerospace and electronics. Geographically, the Asia-Pacific region, driven primarily by China, dominates the market, but North America and Europe are also significant contributors, with substantial growth expected from developing regions in South America and the Middle East and Africa.
The competitive landscape is characterized by a mix of large multinational corporations and smaller specialized players. Key players, including CBMM, are investing heavily in research and development to maintain their market position and capitalize on emerging opportunities. The market's future trajectory is largely dependent on technological advancements, governmental policies supporting sustainable material usage, and the overall economic growth of key end-user industries. The diversity of niobium's applications and its unique properties position it as a key material in the transition to a more sustainable and technologically advanced future. The ongoing diversification into new applications and the continuous improvement in production efficiency ensure its sustained growth prospects over the forecast period.
Niobium Market: A Comprehensive Report (2019-2033)
This detailed report provides a comprehensive analysis of the global Niobium market, covering the period from 2019 to 2033. It offers in-depth insights into market dynamics, competitive landscape, technological advancements, and future growth prospects. The report is designed to equip industry professionals, investors, and researchers with actionable intelligence for strategic decision-making within this rapidly evolving sector. Market values are expressed in Millions.
Niobium Market Structure & Competitive Dynamics
The global niobium market exhibits a moderately concentrated structure, with a few major players holding significant market share. CBMM, for example, commands a substantial portion of global niobium production. However, the market also features several smaller players, including Grandview Materials, Titanex GmbH, CMOC, NioCorp Development Ltd, Magris Performance Materials, Changsha South Tantalum Niobium Co Ltd, Admat Inc, and Australian Strategic Materials Ltd, contributing to a dynamic competitive landscape. Innovation within the niobium industry is driven by the development of new applications, particularly in high-growth sectors like renewable energy and electric vehicles. Regulatory frameworks, varying by region, play a crucial role in shaping market access and sustainability practices. Product substitutes, while limited, exist in specific niche applications. End-user trends, particularly the growing demand for high-strength, lightweight materials in the automotive and aerospace sectors, are significant growth drivers.
M&A activity has been notable, with examples including Kymera International's acquisition of Telex Metals in January 2022, expanding its reach into tantalum and niobium materials. While precise M&A deal values for all transactions are not publicly available for this report, the deals demonstrate a consolidation trend and investment in the sector. Market share data is based on internal research, with CBMM estimated to hold a xx% market share in 2025.
Niobium Market Industry Trends & Insights
The global niobium market is experiencing robust growth, driven by increasing demand from various end-user industries. The compound annual growth rate (CAGR) for the forecast period (2025-2033) is projected to be xx%, surpassing the historical CAGR of xx% (2019-2024). Technological disruptions, particularly advancements in battery technology and high-strength steel manufacturing, are significant growth drivers, enabling market penetration in new sectors. Consumer preferences are shifting towards sustainable and high-performance materials, aligning with the eco-friendly properties and superior strength of niobium alloys. Furthermore, the rise of electric vehicles and renewable energy technologies is creating substantial demand, particularly for niobium-based batteries and superconducting magnets. Competitive dynamics are characterized by ongoing innovation, strategic partnerships, and capacity expansion initiatives by key players. Market penetration in emerging economies is also expected to contribute to overall market expansion, driven by infrastructural development and industrialization.
Dominant Markets & Segments in Niobium Market
- Leading Region: The [Region Name - e.g., Asia-Pacific] region is anticipated to dominate the niobium market throughout the forecast period, driven by rapid industrialization and a surge in demand from the construction and automotive sectors.
- Dominant Occurrence: Carbonatites and associated deposits currently account for the majority of niobium production.
- Leading Type: Ferroniobium remains the dominant type of niobium product, owing to its extensive use in steelmaking. However, the demand for Niobium Oxide is growing rapidly due to its applications in batteries.
- Key Application: Steel remains the leading application for niobium, benefiting from its ability to enhance strength and weldability. However, the superalloys sector is exhibiting strong growth, particularly in the aerospace and defense sectors.
- Major End-user Industry: The automotive and shipbuilding industries are significant consumers of niobium-containing steel. The construction industry also presents a substantial market. Growth is anticipated in aerospace and defense applications due to the requirement for high-performance materials.
Key drivers within these dominant segments include robust economic growth in emerging markets, investments in infrastructure development (particularly in Asia-Pacific), and government support for industries such as automotive and renewable energy. The dominance of specific regions and segments is influenced by factors such as resource availability, manufacturing capabilities, and regulatory environments.
Niobium Market Product Innovations
Recent product innovations in the niobium market focus on enhancing the performance and applications of niobium-based materials. This includes the development of advanced niobium alloys with superior strength, corrosion resistance, and weldability. Furthermore, research and development efforts are aimed at optimizing the use of niobium in next-generation batteries and superconducting magnets, driven by the increasing demand for efficient energy storage and transmission. These innovations are geared towards enhancing market penetration across various industries, leading to improved product performance and greater cost-effectiveness. The competitive advantage is gained through offering unique material properties catering to specific end-user needs.
Report Segmentation & Scope
This report segments the niobium market based on occurrence (Carbonatites and Associates, Columbite-Tantalite), type (Ferroniobium, Niobium Oxide, Niobium Metal, Vacuum-Grade Niobium Alloys), application (Steel, Super Alloys, Superconducting Magnets and Capacitors, Batteries, Other Applications), and end-user industry (Construction, Automotive and Shipbuilding, Aerospace and Defense, Oil and Gas, Other End-user Industries). Each segment's growth projections, market size, and competitive dynamics are analyzed in detail, offering a granular understanding of the market landscape. Growth is projected across all segments, with the fastest growth anticipated in high-technology applications like batteries and superconducting magnets. The competitive intensity varies across different segments, with some experiencing higher levels of competition than others.
Key Drivers of Niobium Market Growth
Several factors are driving the growth of the niobium market. Technological advancements, particularly in battery technology and high-strength steel manufacturing, are creating new applications for niobium. Furthermore, the rising demand for lightweight and high-performance materials in the automotive and aerospace industries is propelling market expansion. Economic factors such as robust growth in emerging markets and increased infrastructure development are also contributing significantly. Lastly, government policies and initiatives promoting the use of sustainable materials and renewable energy further bolster niobium's market trajectory.
Challenges in the Niobium Market Sector
The niobium market faces several challenges. Supply chain disruptions due to geopolitical factors or resource scarcity could impact production and pricing. Fluctuations in raw material costs and energy prices pose a challenge to profitability. The competitive landscape presents challenges, with established players seeking to maintain market share and new entrants emerging. Regulatory hurdles related to environmental concerns and mining operations in specific regions can also influence growth. Price volatility, directly impacted by supply chain intricacies and demand fluctuations, remains a persistent challenge.
Leading Players in the Niobium Market
- Grandview Materials
- Titanex GmbH
- CMOC
- NioCorp Development Ltd
- Magris Performance Materials
- Changsha South Tantalum Niobium Co Ltd
- Admat Inc
- Australian Strategic Materials Ltd
- CBMM
Key Developments in Niobium Market Sector
- December 2022: CBMM announced an USD 80 Million investment to expand its niobium oxide capacity from 500 tons to 3,000 tons by 2024, further expanding to 40,000 tons by 2030.
- March 2022: CBMM partnered with Horwin Brasil, investing 70 million reais, aiming to increase niobium oxide sales to 50,000 tons by 2030 for electric vehicle batteries.
- January 2022: Kymera International acquired Telex Metals, expanding its presence in the niobium market.
These developments showcase significant investment and strategic partnerships, highlighting the industry's growth trajectory and the increasing importance of niobium in various applications.
Strategic Niobium Market Outlook
The niobium market presents significant growth potential, driven by continuous technological advancements and increasing demand across various sectors. Strategic opportunities lie in developing innovative applications of niobium in high-growth areas such as electric vehicles, renewable energy, and advanced materials. Companies focused on research and development, sustainable sourcing, and efficient production processes are well-positioned to capitalize on future market expansion. The global shift towards sustainable practices creates opportunities for niobium to replace less environmentally friendly materials. The long-term outlook for the niobium market remains positive, driven by robust demand and consistent technological innovation.
Niobium Market Segmentation
-
1. Occurrence
- 1.1. Carbonatites and Associates
- 1.2. Columbite-Tantalite
-
2. Type
- 2.1. Ferroniobium
- 2.2. Niobium Oxide
- 2.3. Niobium Metal
- 2.4. Vacuum-Grade Niobium Alloys
-
3. Application
- 3.1. Steel
- 3.2. Super Alloys
- 3.3. Superconducting Magnets and Capacitors
- 3.4. Batteries
- 3.5. Other Applications
-
4. End-user Industry
- 4.1. Construction
- 4.2. Automotive and Shipbuilding
- 4.3. Aerospace and Defense
- 4.4. Oil and Gas
- 4.5. Other End-user Industries
Niobium Market Segmentation By Geography
-
1. Asia Pacific
- 1.1. China
- 1.2. India
- 1.3. Japan
- 1.4. South Korea
- 1.5. Rest of Asia Pacific
-
2. North America
- 2.1. United States
- 2.2. Canada
- 2.3. Mexico
-
3. Europe
- 3.1. Germany
- 3.2. United Kingdom
- 3.3. Russia
- 3.4. Italy
- 3.5. Rest of Europe
-
4. South America
- 4.1. Brazil
- 4.2. Argentina
- 4.3. Rest of South America
-
5. Middle East and Africa
- 5.1. Saudi Arabia
- 5.2. South Africa
- 5.3. Rest of Middle East and Africa
Niobium Market REPORT HIGHLIGHTS
| Aspects | Details |
|---|---|
| Study Period | 2019-2033 |
| Base Year | 2024 |
| Estimated Year | 2025 |
| Forecast Period | 2025-2033 |
| Historical Period | 2019-2024 |
| Growth Rate | CAGR of 9.92% from 2019-2033 |
| Segmentation |
|
Table of Contents
- 1. Introduction
- 1.1. Research Scope
- 1.2. Market Segmentation
- 1.3. Research Methodology
- 1.4. Definitions and Assumptions
- 2. Executive Summary
- 2.1. Introduction
- 3. Market Dynamics
- 3.1. Introduction
- 3.2. Market Drivers
- 3.2.1. Accelerating Usage in Structural Steel; Growing Demand for Lighter-Weight and More Fuel-Efficient Vehicles
- 3.3. Market Restrains
- 3.3.1. Limited Supply Sources; Concerns About Health Issues on Acute Exposure
- 3.4. Market Trends
- 3.4.1. Construction Sector to Dominate the Market
- 4. Market Factor Analysis
- 4.1. Porters Five Forces
- 4.2. Supply/Value Chain
- 4.3. PESTEL analysis
- 4.4. Market Entropy
- 4.5. Patent/Trademark Analysis
- 5. Global Niobium Market Analysis, Insights and Forecast, 2019-2031
- 5.1. Market Analysis, Insights and Forecast - by Occurrence
- 5.1.1. Carbonatites and Associates
- 5.1.2. Columbite-Tantalite
- 5.2. Market Analysis, Insights and Forecast - by Type
- 5.2.1. Ferroniobium
- 5.2.2. Niobium Oxide
- 5.2.3. Niobium Metal
- 5.2.4. Vacuum-Grade Niobium Alloys
- 5.3. Market Analysis, Insights and Forecast - by Application
- 5.3.1. Steel
- 5.3.2. Super Alloys
- 5.3.3. Superconducting Magnets and Capacitors
- 5.3.4. Batteries
- 5.3.5. Other Applications
- 5.4. Market Analysis, Insights and Forecast - by End-user Industry
- 5.4.1. Construction
- 5.4.2. Automotive and Shipbuilding
- 5.4.3. Aerospace and Defense
- 5.4.4. Oil and Gas
- 5.4.5. Other End-user Industries
- 5.5. Market Analysis, Insights and Forecast - by Region
- 5.5.1. Asia Pacific
- 5.5.2. North America
- 5.5.3. Europe
- 5.5.4. South America
- 5.5.5. Middle East and Africa
- 5.1. Market Analysis, Insights and Forecast - by Occurrence
- 6. Asia Pacific Niobium Market Analysis, Insights and Forecast, 2019-2031
- 6.1. Market Analysis, Insights and Forecast - by Occurrence
- 6.1.1. Carbonatites and Associates
- 6.1.2. Columbite-Tantalite
- 6.2. Market Analysis, Insights and Forecast - by Type
- 6.2.1. Ferroniobium
- 6.2.2. Niobium Oxide
- 6.2.3. Niobium Metal
- 6.2.4. Vacuum-Grade Niobium Alloys
- 6.3. Market Analysis, Insights and Forecast - by Application
- 6.3.1. Steel
- 6.3.2. Super Alloys
- 6.3.3. Superconducting Magnets and Capacitors
- 6.3.4. Batteries
- 6.3.5. Other Applications
- 6.4. Market Analysis, Insights and Forecast - by End-user Industry
- 6.4.1. Construction
- 6.4.2. Automotive and Shipbuilding
- 6.4.3. Aerospace and Defense
- 6.4.4. Oil and Gas
- 6.4.5. Other End-user Industries
- 6.1. Market Analysis, Insights and Forecast - by Occurrence
- 7. North America Niobium Market Analysis, Insights and Forecast, 2019-2031
- 7.1. Market Analysis, Insights and Forecast - by Occurrence
- 7.1.1. Carbonatites and Associates
- 7.1.2. Columbite-Tantalite
- 7.2. Market Analysis, Insights and Forecast - by Type
- 7.2.1. Ferroniobium
- 7.2.2. Niobium Oxide
- 7.2.3. Niobium Metal
- 7.2.4. Vacuum-Grade Niobium Alloys
- 7.3. Market Analysis, Insights and Forecast - by Application
- 7.3.1. Steel
- 7.3.2. Super Alloys
- 7.3.3. Superconducting Magnets and Capacitors
- 7.3.4. Batteries
- 7.3.5. Other Applications
- 7.4. Market Analysis, Insights and Forecast - by End-user Industry
- 7.4.1. Construction
- 7.4.2. Automotive and Shipbuilding
- 7.4.3. Aerospace and Defense
- 7.4.4. Oil and Gas
- 7.4.5. Other End-user Industries
- 7.1. Market Analysis, Insights and Forecast - by Occurrence
- 8. Europe Niobium Market Analysis, Insights and Forecast, 2019-2031
- 8.1. Market Analysis, Insights and Forecast - by Occurrence
- 8.1.1. Carbonatites and Associates
- 8.1.2. Columbite-Tantalite
- 8.2. Market Analysis, Insights and Forecast - by Type
- 8.2.1. Ferroniobium
- 8.2.2. Niobium Oxide
- 8.2.3. Niobium Metal
- 8.2.4. Vacuum-Grade Niobium Alloys
- 8.3. Market Analysis, Insights and Forecast - by Application
- 8.3.1. Steel
- 8.3.2. Super Alloys
- 8.3.3. Superconducting Magnets and Capacitors
- 8.3.4. Batteries
- 8.3.5. Other Applications
- 8.4. Market Analysis, Insights and Forecast - by End-user Industry
- 8.4.1. Construction
- 8.4.2. Automotive and Shipbuilding
- 8.4.3. Aerospace and Defense
- 8.4.4. Oil and Gas
- 8.4.5. Other End-user Industries
- 8.1. Market Analysis, Insights and Forecast - by Occurrence
- 9. South America Niobium Market Analysis, Insights and Forecast, 2019-2031
- 9.1. Market Analysis, Insights and Forecast - by Occurrence
- 9.1.1. Carbonatites and Associates
- 9.1.2. Columbite-Tantalite
- 9.2. Market Analysis, Insights and Forecast - by Type
- 9.2.1. Ferroniobium
- 9.2.2. Niobium Oxide
- 9.2.3. Niobium Metal
- 9.2.4. Vacuum-Grade Niobium Alloys
- 9.3. Market Analysis, Insights and Forecast - by Application
- 9.3.1. Steel
- 9.3.2. Super Alloys
- 9.3.3. Superconducting Magnets and Capacitors
- 9.3.4. Batteries
- 9.3.5. Other Applications
- 9.4. Market Analysis, Insights and Forecast - by End-user Industry
- 9.4.1. Construction
- 9.4.2. Automotive and Shipbuilding
- 9.4.3. Aerospace and Defense
- 9.4.4. Oil and Gas
- 9.4.5. Other End-user Industries
- 9.1. Market Analysis, Insights and Forecast - by Occurrence
- 10. Middle East and Africa Niobium Market Analysis, Insights and Forecast, 2019-2031
- 10.1. Market Analysis, Insights and Forecast - by Occurrence
- 10.1.1. Carbonatites and Associates
- 10.1.2. Columbite-Tantalite
- 10.2. Market Analysis, Insights and Forecast - by Type
- 10.2.1. Ferroniobium
- 10.2.2. Niobium Oxide
- 10.2.3. Niobium Metal
- 10.2.4. Vacuum-Grade Niobium Alloys
- 10.3. Market Analysis, Insights and Forecast - by Application
- 10.3.1. Steel
- 10.3.2. Super Alloys
- 10.3.3. Superconducting Magnets and Capacitors
- 10.3.4. Batteries
- 10.3.5. Other Applications
- 10.4. Market Analysis, Insights and Forecast - by End-user Industry
- 10.4.1. Construction
- 10.4.2. Automotive and Shipbuilding
- 10.4.3. Aerospace and Defense
- 10.4.4. Oil and Gas
- 10.4.5. Other End-user Industries
- 10.1. Market Analysis, Insights and Forecast - by Occurrence
- 11. Asia Pacific Niobium Market Analysis, Insights and Forecast, 2019-2031
- 11.1. Market Analysis, Insights and Forecast - By Country/Sub-region
- 11.1.1 China
- 11.1.2 India
- 11.1.3 Japan
- 11.1.4 South Korea
- 11.1.5 Rest of Asia Pacific
- 12. North America Niobium Market Analysis, Insights and Forecast, 2019-2031
- 12.1. Market Analysis, Insights and Forecast - By Country/Sub-region
- 12.1.1 United States
- 12.1.2 Canada
- 12.1.3 Mexico
- 13. Europe Niobium Market Analysis, Insights and Forecast, 2019-2031
- 13.1. Market Analysis, Insights and Forecast - By Country/Sub-region
- 13.1.1 Germany
- 13.1.2 United Kingdom
- 13.1.3 Russia
- 13.1.4 Italy
- 13.1.5 Rest of Europe
- 14. South America Niobium Market Analysis, Insights and Forecast, 2019-2031
- 14.1. Market Analysis, Insights and Forecast - By Country/Sub-region
- 14.1.1 Brazil
- 14.1.2 Argentina
- 14.1.3 Rest of South America
- 15. Middle East and Africa Niobium Market Analysis, Insights and Forecast, 2019-2031
- 15.1. Market Analysis, Insights and Forecast - By Country/Sub-region
- 15.1.1 Saudi Arabia
- 15.1.2 South Africa
- 15.1.3 Rest of Middle East and Africa
- 16. Competitive Analysis
- 16.1. Global Market Share Analysis 2024
- 16.2. Company Profiles
- 16.2.1 Grandview Materials
- 16.2.1.1. Overview
- 16.2.1.2. Products
- 16.2.1.3. SWOT Analysis
- 16.2.1.4. Recent Developments
- 16.2.1.5. Financials (Based on Availability)
- 16.2.2 Titanex GmbH*List Not Exhaustive
- 16.2.2.1. Overview
- 16.2.2.2. Products
- 16.2.2.3. SWOT Analysis
- 16.2.2.4. Recent Developments
- 16.2.2.5. Financials (Based on Availability)
- 16.2.3 CMOC
- 16.2.3.1. Overview
- 16.2.3.2. Products
- 16.2.3.3. SWOT Analysis
- 16.2.3.4. Recent Developments
- 16.2.3.5. Financials (Based on Availability)
- 16.2.4 NioCorp Development Ltd
- 16.2.4.1. Overview
- 16.2.4.2. Products
- 16.2.4.3. SWOT Analysis
- 16.2.4.4. Recent Developments
- 16.2.4.5. Financials (Based on Availability)
- 16.2.5 Magris Performance Materials
- 16.2.5.1. Overview
- 16.2.5.2. Products
- 16.2.5.3. SWOT Analysis
- 16.2.5.4. Recent Developments
- 16.2.5.5. Financials (Based on Availability)
- 16.2.6 Changsha South Tantalum Niobium Co Ltd
- 16.2.6.1. Overview
- 16.2.6.2. Products
- 16.2.6.3. SWOT Analysis
- 16.2.6.4. Recent Developments
- 16.2.6.5. Financials (Based on Availability)
- 16.2.7 Admat Inc
- 16.2.7.1. Overview
- 16.2.7.2. Products
- 16.2.7.3. SWOT Analysis
- 16.2.7.4. Recent Developments
- 16.2.7.5. Financials (Based on Availability)
- 16.2.8 Australian Strategic Materials Ltd
- 16.2.8.1. Overview
- 16.2.8.2. Products
- 16.2.8.3. SWOT Analysis
- 16.2.8.4. Recent Developments
- 16.2.8.5. Financials (Based on Availability)
- 16.2.9 CBMM
- 16.2.9.1. Overview
- 16.2.9.2. Products
- 16.2.9.3. SWOT Analysis
- 16.2.9.4. Recent Developments
- 16.2.9.5. Financials (Based on Availability)
- 16.2.1 Grandview Materials
List of Figures
- Figure 1: Global Niobium Market Revenue Breakdown (Million, %) by Region 2024 & 2032
- Figure 2: Global Niobium Market Volume Breakdown (kilotons, %) by Region 2024 & 2032
- Figure 3: Asia Pacific Niobium Market Revenue (Million), by Country 2024 & 2032
- Figure 4: Asia Pacific Niobium Market Volume (kilotons), by Country 2024 & 2032
- Figure 5: Asia Pacific Niobium Market Revenue Share (%), by Country 2024 & 2032
- Figure 6: Asia Pacific Niobium Market Volume Share (%), by Country 2024 & 2032
- Figure 7: North America Niobium Market Revenue (Million), by Country 2024 & 2032
- Figure 8: North America Niobium Market Volume (kilotons), by Country 2024 & 2032
- Figure 9: North America Niobium Market Revenue Share (%), by Country 2024 & 2032
- Figure 10: North America Niobium Market Volume Share (%), by Country 2024 & 2032
- Figure 11: Europe Niobium Market Revenue (Million), by Country 2024 & 2032
- Figure 12: Europe Niobium Market Volume (kilotons), by Country 2024 & 2032
- Figure 13: Europe Niobium Market Revenue Share (%), by Country 2024 & 2032
- Figure 14: Europe Niobium Market Volume Share (%), by Country 2024 & 2032
- Figure 15: South America Niobium Market Revenue (Million), by Country 2024 & 2032
- Figure 16: South America Niobium Market Volume (kilotons), by Country 2024 & 2032
- Figure 17: South America Niobium Market Revenue Share (%), by Country 2024 & 2032
- Figure 18: South America Niobium Market Volume Share (%), by Country 2024 & 2032
- Figure 19: Middle East and Africa Niobium Market Revenue (Million), by Country 2024 & 2032
- Figure 20: Middle East and Africa Niobium Market Volume (kilotons), by Country 2024 & 2032
- Figure 21: Middle East and Africa Niobium Market Revenue Share (%), by Country 2024 & 2032
- Figure 22: Middle East and Africa Niobium Market Volume Share (%), by Country 2024 & 2032
- Figure 23: Asia Pacific Niobium Market Revenue (Million), by Occurrence 2024 & 2032
- Figure 24: Asia Pacific Niobium Market Volume (kilotons), by Occurrence 2024 & 2032
- Figure 25: Asia Pacific Niobium Market Revenue Share (%), by Occurrence 2024 & 2032
- Figure 26: Asia Pacific Niobium Market Volume Share (%), by Occurrence 2024 & 2032
- Figure 27: Asia Pacific Niobium Market Revenue (Million), by Type 2024 & 2032
- Figure 28: Asia Pacific Niobium Market Volume (kilotons), by Type 2024 & 2032
- Figure 29: Asia Pacific Niobium Market Revenue Share (%), by Type 2024 & 2032
- Figure 30: Asia Pacific Niobium Market Volume Share (%), by Type 2024 & 2032
- Figure 31: Asia Pacific Niobium Market Revenue (Million), by Application 2024 & 2032
- Figure 32: Asia Pacific Niobium Market Volume (kilotons), by Application 2024 & 2032
- Figure 33: Asia Pacific Niobium Market Revenue Share (%), by Application 2024 & 2032
- Figure 34: Asia Pacific Niobium Market Volume Share (%), by Application 2024 & 2032
- Figure 35: Asia Pacific Niobium Market Revenue (Million), by End-user Industry 2024 & 2032
- Figure 36: Asia Pacific Niobium Market Volume (kilotons), by End-user Industry 2024 & 2032
- Figure 37: Asia Pacific Niobium Market Revenue Share (%), by End-user Industry 2024 & 2032
- Figure 38: Asia Pacific Niobium Market Volume Share (%), by End-user Industry 2024 & 2032
- Figure 39: Asia Pacific Niobium Market Revenue (Million), by Country 2024 & 2032
- Figure 40: Asia Pacific Niobium Market Volume (kilotons), by Country 2024 & 2032
- Figure 41: Asia Pacific Niobium Market Revenue Share (%), by Country 2024 & 2032
- Figure 42: Asia Pacific Niobium Market Volume Share (%), by Country 2024 & 2032
- Figure 43: North America Niobium Market Revenue (Million), by Occurrence 2024 & 2032
- Figure 44: North America Niobium Market Volume (kilotons), by Occurrence 2024 & 2032
- Figure 45: North America Niobium Market Revenue Share (%), by Occurrence 2024 & 2032
- Figure 46: North America Niobium Market Volume Share (%), by Occurrence 2024 & 2032
- Figure 47: North America Niobium Market Revenue (Million), by Type 2024 & 2032
- Figure 48: North America Niobium Market Volume (kilotons), by Type 2024 & 2032
- Figure 49: North America Niobium Market Revenue Share (%), by Type 2024 & 2032
- Figure 50: North America Niobium Market Volume Share (%), by Type 2024 & 2032
- Figure 51: North America Niobium Market Revenue (Million), by Application 2024 & 2032
- Figure 52: North America Niobium Market Volume (kilotons), by Application 2024 & 2032
- Figure 53: North America Niobium Market Revenue Share (%), by Application 2024 & 2032
- Figure 54: North America Niobium Market Volume Share (%), by Application 2024 & 2032
- Figure 55: North America Niobium Market Revenue (Million), by End-user Industry 2024 & 2032
- Figure 56: North America Niobium Market Volume (kilotons), by End-user Industry 2024 & 2032
- Figure 57: North America Niobium Market Revenue Share (%), by End-user Industry 2024 & 2032
- Figure 58: North America Niobium Market Volume Share (%), by End-user Industry 2024 & 2032
- Figure 59: North America Niobium Market Revenue (Million), by Country 2024 & 2032
- Figure 60: North America Niobium Market Volume (kilotons), by Country 2024 & 2032
- Figure 61: North America Niobium Market Revenue Share (%), by Country 2024 & 2032
- Figure 62: North America Niobium Market Volume Share (%), by Country 2024 & 2032
- Figure 63: Europe Niobium Market Revenue (Million), by Occurrence 2024 & 2032
- Figure 64: Europe Niobium Market Volume (kilotons), by Occurrence 2024 & 2032
- Figure 65: Europe Niobium Market Revenue Share (%), by Occurrence 2024 & 2032
- Figure 66: Europe Niobium Market Volume Share (%), by Occurrence 2024 & 2032
- Figure 67: Europe Niobium Market Revenue (Million), by Type 2024 & 2032
- Figure 68: Europe Niobium Market Volume (kilotons), by Type 2024 & 2032
- Figure 69: Europe Niobium Market Revenue Share (%), by Type 2024 & 2032
- Figure 70: Europe Niobium Market Volume Share (%), by Type 2024 & 2032
- Figure 71: Europe Niobium Market Revenue (Million), by Application 2024 & 2032
- Figure 72: Europe Niobium Market Volume (kilotons), by Application 2024 & 2032
- Figure 73: Europe Niobium Market Revenue Share (%), by Application 2024 & 2032
- Figure 74: Europe Niobium Market Volume Share (%), by Application 2024 & 2032
- Figure 75: Europe Niobium Market Revenue (Million), by End-user Industry 2024 & 2032
- Figure 76: Europe Niobium Market Volume (kilotons), by End-user Industry 2024 & 2032
- Figure 77: Europe Niobium Market Revenue Share (%), by End-user Industry 2024 & 2032
- Figure 78: Europe Niobium Market Volume Share (%), by End-user Industry 2024 & 2032
- Figure 79: Europe Niobium Market Revenue (Million), by Country 2024 & 2032
- Figure 80: Europe Niobium Market Volume (kilotons), by Country 2024 & 2032
- Figure 81: Europe Niobium Market Revenue Share (%), by Country 2024 & 2032
- Figure 82: Europe Niobium Market Volume Share (%), by Country 2024 & 2032
- Figure 83: South America Niobium Market Revenue (Million), by Occurrence 2024 & 2032
- Figure 84: South America Niobium Market Volume (kilotons), by Occurrence 2024 & 2032
- Figure 85: South America Niobium Market Revenue Share (%), by Occurrence 2024 & 2032
- Figure 86: South America Niobium Market Volume Share (%), by Occurrence 2024 & 2032
- Figure 87: South America Niobium Market Revenue (Million), by Type 2024 & 2032
- Figure 88: South America Niobium Market Volume (kilotons), by Type 2024 & 2032
- Figure 89: South America Niobium Market Revenue Share (%), by Type 2024 & 2032
- Figure 90: South America Niobium Market Volume Share (%), by Type 2024 & 2032
- Figure 91: South America Niobium Market Revenue (Million), by Application 2024 & 2032
- Figure 92: South America Niobium Market Volume (kilotons), by Application 2024 & 2032
- Figure 93: South America Niobium Market Revenue Share (%), by Application 2024 & 2032
- Figure 94: South America Niobium Market Volume Share (%), by Application 2024 & 2032
- Figure 95: South America Niobium Market Revenue (Million), by End-user Industry 2024 & 2032
- Figure 96: South America Niobium Market Volume (kilotons), by End-user Industry 2024 & 2032
- Figure 97: South America Niobium Market Revenue Share (%), by End-user Industry 2024 & 2032
- Figure 98: South America Niobium Market Volume Share (%), by End-user Industry 2024 & 2032
- Figure 99: South America Niobium Market Revenue (Million), by Country 2024 & 2032
- Figure 100: South America Niobium Market Volume (kilotons), by Country 2024 & 2032
- Figure 101: South America Niobium Market Revenue Share (%), by Country 2024 & 2032
- Figure 102: South America Niobium Market Volume Share (%), by Country 2024 & 2032
- Figure 103: Middle East and Africa Niobium Market Revenue (Million), by Occurrence 2024 & 2032
- Figure 104: Middle East and Africa Niobium Market Volume (kilotons), by Occurrence 2024 & 2032
- Figure 105: Middle East and Africa Niobium Market Revenue Share (%), by Occurrence 2024 & 2032
- Figure 106: Middle East and Africa Niobium Market Volume Share (%), by Occurrence 2024 & 2032
- Figure 107: Middle East and Africa Niobium Market Revenue (Million), by Type 2024 & 2032
- Figure 108: Middle East and Africa Niobium Market Volume (kilotons), by Type 2024 & 2032
- Figure 109: Middle East and Africa Niobium Market Revenue Share (%), by Type 2024 & 2032
- Figure 110: Middle East and Africa Niobium Market Volume Share (%), by Type 2024 & 2032
- Figure 111: Middle East and Africa Niobium Market Revenue (Million), by Application 2024 & 2032
- Figure 112: Middle East and Africa Niobium Market Volume (kilotons), by Application 2024 & 2032
- Figure 113: Middle East and Africa Niobium Market Revenue Share (%), by Application 2024 & 2032
- Figure 114: Middle East and Africa Niobium Market Volume Share (%), by Application 2024 & 2032
- Figure 115: Middle East and Africa Niobium Market Revenue (Million), by End-user Industry 2024 & 2032
- Figure 116: Middle East and Africa Niobium Market Volume (kilotons), by End-user Industry 2024 & 2032
- Figure 117: Middle East and Africa Niobium Market Revenue Share (%), by End-user Industry 2024 & 2032
- Figure 118: Middle East and Africa Niobium Market Volume Share (%), by End-user Industry 2024 & 2032
- Figure 119: Middle East and Africa Niobium Market Revenue (Million), by Country 2024 & 2032
- Figure 120: Middle East and Africa Niobium Market Volume (kilotons), by Country 2024 & 2032
- Figure 121: Middle East and Africa Niobium Market Revenue Share (%), by Country 2024 & 2032
- Figure 122: Middle East and Africa Niobium Market Volume Share (%), by Country 2024 & 2032
List of Tables
- Table 1: Global Niobium Market Revenue Million Forecast, by Region 2019 & 2032
- Table 2: Global Niobium Market Volume kilotons Forecast, by Region 2019 & 2032
- Table 3: Global Niobium Market Revenue Million Forecast, by Occurrence 2019 & 2032
- Table 4: Global Niobium Market Volume kilotons Forecast, by Occurrence 2019 & 2032
- Table 5: Global Niobium Market Revenue Million Forecast, by Type 2019 & 2032
- Table 6: Global Niobium Market Volume kilotons Forecast, by Type 2019 & 2032
- Table 7: Global Niobium Market Revenue Million Forecast, by Application 2019 & 2032
- Table 8: Global Niobium Market Volume kilotons Forecast, by Application 2019 & 2032
- Table 9: Global Niobium Market Revenue Million Forecast, by End-user Industry 2019 & 2032
- Table 10: Global Niobium Market Volume kilotons Forecast, by End-user Industry 2019 & 2032
- Table 11: Global Niobium Market Revenue Million Forecast, by Region 2019 & 2032
- Table 12: Global Niobium Market Volume kilotons Forecast, by Region 2019 & 2032
- Table 13: Global Niobium Market Revenue Million Forecast, by Country 2019 & 2032
- Table 14: Global Niobium Market Volume kilotons Forecast, by Country 2019 & 2032
- Table 15: China Niobium Market Revenue (Million) Forecast, by Application 2019 & 2032
- Table 16: China Niobium Market Volume (kilotons) Forecast, by Application 2019 & 2032
- Table 17: India Niobium Market Revenue (Million) Forecast, by Application 2019 & 2032
- Table 18: India Niobium Market Volume (kilotons) Forecast, by Application 2019 & 2032
- Table 19: Japan Niobium Market Revenue (Million) Forecast, by Application 2019 & 2032
- Table 20: Japan Niobium Market Volume (kilotons) Forecast, by Application 2019 & 2032
- Table 21: South Korea Niobium Market Revenue (Million) Forecast, by Application 2019 & 2032
- Table 22: South Korea Niobium Market Volume (kilotons) Forecast, by Application 2019 & 2032
- Table 23: Rest of Asia Pacific Niobium Market Revenue (Million) Forecast, by Application 2019 & 2032
- Table 24: Rest of Asia Pacific Niobium Market Volume (kilotons) Forecast, by Application 2019 & 2032
- Table 25: Global Niobium Market Revenue Million Forecast, by Country 2019 & 2032
- Table 26: Global Niobium Market Volume kilotons Forecast, by Country 2019 & 2032
- Table 27: United States Niobium Market Revenue (Million) Forecast, by Application 2019 & 2032
- Table 28: United States Niobium Market Volume (kilotons) Forecast, by Application 2019 & 2032
- Table 29: Canada Niobium Market Revenue (Million) Forecast, by Application 2019 & 2032
- Table 30: Canada Niobium Market Volume (kilotons) Forecast, by Application 2019 & 2032
- Table 31: Mexico Niobium Market Revenue (Million) Forecast, by Application 2019 & 2032
- Table 32: Mexico Niobium Market Volume (kilotons) Forecast, by Application 2019 & 2032
- Table 33: Global Niobium Market Revenue Million Forecast, by Country 2019 & 2032
- Table 34: Global Niobium Market Volume kilotons Forecast, by Country 2019 & 2032
- Table 35: Germany Niobium Market Revenue (Million) Forecast, by Application 2019 & 2032
- Table 36: Germany Niobium Market Volume (kilotons) Forecast, by Application 2019 & 2032
- Table 37: United Kingdom Niobium Market Revenue (Million) Forecast, by Application 2019 & 2032
- Table 38: United Kingdom Niobium Market Volume (kilotons) Forecast, by Application 2019 & 2032
- Table 39: Russia Niobium Market Revenue (Million) Forecast, by Application 2019 & 2032
- Table 40: Russia Niobium Market Volume (kilotons) Forecast, by Application 2019 & 2032
- Table 41: Italy Niobium Market Revenue (Million) Forecast, by Application 2019 & 2032
- Table 42: Italy Niobium Market Volume (kilotons) Forecast, by Application 2019 & 2032
- Table 43: Rest of Europe Niobium Market Revenue (Million) Forecast, by Application 2019 & 2032
- Table 44: Rest of Europe Niobium Market Volume (kilotons) Forecast, by Application 2019 & 2032
- Table 45: Global Niobium Market Revenue Million Forecast, by Country 2019 & 2032
- Table 46: Global Niobium Market Volume kilotons Forecast, by Country 2019 & 2032
- Table 47: Brazil Niobium Market Revenue (Million) Forecast, by Application 2019 & 2032
- Table 48: Brazil Niobium Market Volume (kilotons) Forecast, by Application 2019 & 2032
- Table 49: Argentina Niobium Market Revenue (Million) Forecast, by Application 2019 & 2032
- Table 50: Argentina Niobium Market Volume (kilotons) Forecast, by Application 2019 & 2032
- Table 51: Rest of South America Niobium Market Revenue (Million) Forecast, by Application 2019 & 2032
- Table 52: Rest of South America Niobium Market Volume (kilotons) Forecast, by Application 2019 & 2032
- Table 53: Global Niobium Market Revenue Million Forecast, by Country 2019 & 2032
- Table 54: Global Niobium Market Volume kilotons Forecast, by Country 2019 & 2032
- Table 55: Saudi Arabia Niobium Market Revenue (Million) Forecast, by Application 2019 & 2032
- Table 56: Saudi Arabia Niobium Market Volume (kilotons) Forecast, by Application 2019 & 2032
- Table 57: South Africa Niobium Market Revenue (Million) Forecast, by Application 2019 & 2032
- Table 58: South Africa Niobium Market Volume (kilotons) Forecast, by Application 2019 & 2032
- Table 59: Rest of Middle East and Africa Niobium Market Revenue (Million) Forecast, by Application 2019 & 2032
- Table 60: Rest of Middle East and Africa Niobium Market Volume (kilotons) Forecast, by Application 2019 & 2032
- Table 61: Global Niobium Market Revenue Million Forecast, by Occurrence 2019 & 2032
- Table 62: Global Niobium Market Volume kilotons Forecast, by Occurrence 2019 & 2032
- Table 63: Global Niobium Market Revenue Million Forecast, by Type 2019 & 2032
- Table 64: Global Niobium Market Volume kilotons Forecast, by Type 2019 & 2032
- Table 65: Global Niobium Market Revenue Million Forecast, by Application 2019 & 2032
- Table 66: Global Niobium Market Volume kilotons Forecast, by Application 2019 & 2032
- Table 67: Global Niobium Market Revenue Million Forecast, by End-user Industry 2019 & 2032
- Table 68: Global Niobium Market Volume kilotons Forecast, by End-user Industry 2019 & 2032
- Table 69: Global Niobium Market Revenue Million Forecast, by Country 2019 & 2032
- Table 70: Global Niobium Market Volume kilotons Forecast, by Country 2019 & 2032
- Table 71: China Niobium Market Revenue (Million) Forecast, by Application 2019 & 2032
- Table 72: China Niobium Market Volume (kilotons) Forecast, by Application 2019 & 2032
- Table 73: India Niobium Market Revenue (Million) Forecast, by Application 2019 & 2032
- Table 74: India Niobium Market Volume (kilotons) Forecast, by Application 2019 & 2032
- Table 75: Japan Niobium Market Revenue (Million) Forecast, by Application 2019 & 2032
- Table 76: Japan Niobium Market Volume (kilotons) Forecast, by Application 2019 & 2032
- Table 77: South Korea Niobium Market Revenue (Million) Forecast, by Application 2019 & 2032
- Table 78: South Korea Niobium Market Volume (kilotons) Forecast, by Application 2019 & 2032
- Table 79: Rest of Asia Pacific Niobium Market Revenue (Million) Forecast, by Application 2019 & 2032
- Table 80: Rest of Asia Pacific Niobium Market Volume (kilotons) Forecast, by Application 2019 & 2032
- Table 81: Global Niobium Market Revenue Million Forecast, by Occurrence 2019 & 2032
- Table 82: Global Niobium Market Volume kilotons Forecast, by Occurrence 2019 & 2032
- Table 83: Global Niobium Market Revenue Million Forecast, by Type 2019 & 2032
- Table 84: Global Niobium Market Volume kilotons Forecast, by Type 2019 & 2032
- Table 85: Global Niobium Market Revenue Million Forecast, by Application 2019 & 2032
- Table 86: Global Niobium Market Volume kilotons Forecast, by Application 2019 & 2032
- Table 87: Global Niobium Market Revenue Million Forecast, by End-user Industry 2019 & 2032
- Table 88: Global Niobium Market Volume kilotons Forecast, by End-user Industry 2019 & 2032
- Table 89: Global Niobium Market Revenue Million Forecast, by Country 2019 & 2032
- Table 90: Global Niobium Market Volume kilotons Forecast, by Country 2019 & 2032
- Table 91: United States Niobium Market Revenue (Million) Forecast, by Application 2019 & 2032
- Table 92: United States Niobium Market Volume (kilotons) Forecast, by Application 2019 & 2032
- Table 93: Canada Niobium Market Revenue (Million) Forecast, by Application 2019 & 2032
- Table 94: Canada Niobium Market Volume (kilotons) Forecast, by Application 2019 & 2032
- Table 95: Mexico Niobium Market Revenue (Million) Forecast, by Application 2019 & 2032
- Table 96: Mexico Niobium Market Volume (kilotons) Forecast, by Application 2019 & 2032
- Table 97: Global Niobium Market Revenue Million Forecast, by Occurrence 2019 & 2032
- Table 98: Global Niobium Market Volume kilotons Forecast, by Occurrence 2019 & 2032
- Table 99: Global Niobium Market Revenue Million Forecast, by Type 2019 & 2032
- Table 100: Global Niobium Market Volume kilotons Forecast, by Type 2019 & 2032
- Table 101: Global Niobium Market Revenue Million Forecast, by Application 2019 & 2032
- Table 102: Global Niobium Market Volume kilotons Forecast, by Application 2019 & 2032
- Table 103: Global Niobium Market Revenue Million Forecast, by End-user Industry 2019 & 2032
- Table 104: Global Niobium Market Volume kilotons Forecast, by End-user Industry 2019 & 2032
- Table 105: Global Niobium Market Revenue Million Forecast, by Country 2019 & 2032
- Table 106: Global Niobium Market Volume kilotons Forecast, by Country 2019 & 2032
- Table 107: Germany Niobium Market Revenue (Million) Forecast, by Application 2019 & 2032
- Table 108: Germany Niobium Market Volume (kilotons) Forecast, by Application 2019 & 2032
- Table 109: United Kingdom Niobium Market Revenue (Million) Forecast, by Application 2019 & 2032
- Table 110: United Kingdom Niobium Market Volume (kilotons) Forecast, by Application 2019 & 2032
- Table 111: Russia Niobium Market Revenue (Million) Forecast, by Application 2019 & 2032
- Table 112: Russia Niobium Market Volume (kilotons) Forecast, by Application 2019 & 2032
- Table 113: Italy Niobium Market Revenue (Million) Forecast, by Application 2019 & 2032
- Table 114: Italy Niobium Market Volume (kilotons) Forecast, by Application 2019 & 2032
- Table 115: Rest of Europe Niobium Market Revenue (Million) Forecast, by Application 2019 & 2032
- Table 116: Rest of Europe Niobium Market Volume (kilotons) Forecast, by Application 2019 & 2032
- Table 117: Global Niobium Market Revenue Million Forecast, by Occurrence 2019 & 2032
- Table 118: Global Niobium Market Volume kilotons Forecast, by Occurrence 2019 & 2032
- Table 119: Global Niobium Market Revenue Million Forecast, by Type 2019 & 2032
- Table 120: Global Niobium Market Volume kilotons Forecast, by Type 2019 & 2032
- Table 121: Global Niobium Market Revenue Million Forecast, by Application 2019 & 2032
- Table 122: Global Niobium Market Volume kilotons Forecast, by Application 2019 & 2032
- Table 123: Global Niobium Market Revenue Million Forecast, by End-user Industry 2019 & 2032
- Table 124: Global Niobium Market Volume kilotons Forecast, by End-user Industry 2019 & 2032
- Table 125: Global Niobium Market Revenue Million Forecast, by Country 2019 & 2032
- Table 126: Global Niobium Market Volume kilotons Forecast, by Country 2019 & 2032
- Table 127: Brazil Niobium Market Revenue (Million) Forecast, by Application 2019 & 2032
- Table 128: Brazil Niobium Market Volume (kilotons) Forecast, by Application 2019 & 2032
- Table 129: Argentina Niobium Market Revenue (Million) Forecast, by Application 2019 & 2032
- Table 130: Argentina Niobium Market Volume (kilotons) Forecast, by Application 2019 & 2032
- Table 131: Rest of South America Niobium Market Revenue (Million) Forecast, by Application 2019 & 2032
- Table 132: Rest of South America Niobium Market Volume (kilotons) Forecast, by Application 2019 & 2032
- Table 133: Global Niobium Market Revenue Million Forecast, by Occurrence 2019 & 2032
- Table 134: Global Niobium Market Volume kilotons Forecast, by Occurrence 2019 & 2032
- Table 135: Global Niobium Market Revenue Million Forecast, by Type 2019 & 2032
- Table 136: Global Niobium Market Volume kilotons Forecast, by Type 2019 & 2032
- Table 137: Global Niobium Market Revenue Million Forecast, by Application 2019 & 2032
- Table 138: Global Niobium Market Volume kilotons Forecast, by Application 2019 & 2032
- Table 139: Global Niobium Market Revenue Million Forecast, by End-user Industry 2019 & 2032
- Table 140: Global Niobium Market Volume kilotons Forecast, by End-user Industry 2019 & 2032
- Table 141: Global Niobium Market Revenue Million Forecast, by Country 2019 & 2032
- Table 142: Global Niobium Market Volume kilotons Forecast, by Country 2019 & 2032
- Table 143: Saudi Arabia Niobium Market Revenue (Million) Forecast, by Application 2019 & 2032
- Table 144: Saudi Arabia Niobium Market Volume (kilotons) Forecast, by Application 2019 & 2032
- Table 145: South Africa Niobium Market Revenue (Million) Forecast, by Application 2019 & 2032
- Table 146: South Africa Niobium Market Volume (kilotons) Forecast, by Application 2019 & 2032
- Table 147: Rest of Middle East and Africa Niobium Market Revenue (Million) Forecast, by Application 2019 & 2032
- Table 148: Rest of Middle East and Africa Niobium Market Volume (kilotons) Forecast, by Application 2019 & 2032
Frequently Asked Questions
1. What is the projected Compound Annual Growth Rate (CAGR) of the Niobium Market?
The projected CAGR is approximately 9.92%.
2. Which companies are prominent players in the Niobium Market?
Key companies in the market include Grandview Materials, Titanex GmbH*List Not Exhaustive, CMOC, NioCorp Development Ltd, Magris Performance Materials, Changsha South Tantalum Niobium Co Ltd, Admat Inc, Australian Strategic Materials Ltd, CBMM.
3. What are the main segments of the Niobium Market?
The market segments include Occurrence, Type, Application, End-user Industry.
4. Can you provide details about the market size?
The market size is estimated to be USD XX Million as of 2022.
5. What are some drivers contributing to market growth?
Accelerating Usage in Structural Steel; Growing Demand for Lighter-Weight and More Fuel-Efficient Vehicles.
6. What are the notable trends driving market growth?
Construction Sector to Dominate the Market.
7. Are there any restraints impacting market growth?
Limited Supply Sources; Concerns About Health Issues on Acute Exposure.
8. Can you provide examples of recent developments in the market?
December 2022: CBMM announced a significant investment of USD 80 million to expand its niobium oxide capacity from 500 tons to 3,000 tons by 2024. Collaborating with Echion Technologies, CBMM plans to establish a niobium oxide facility at its Araxá plant in Minas Gerais, Brazil, aligning with its goal of achieving a niobium oxide capacity of 40,000 tons by 2030.
9. What pricing options are available for accessing the report?
Pricing options include single-user, multi-user, and enterprise licenses priced at USD 4750, USD 5250, and USD 8750 respectively.
10. Is the market size provided in terms of value or volume?
The market size is provided in terms of value, measured in Million and volume, measured in kilotons.
11. Are there any specific market keywords associated with the report?
Yes, the market keyword associated with the report is "Niobium Market," which aids in identifying and referencing the specific market segment covered.
12. How do I determine which pricing option suits my needs best?
The pricing options vary based on user requirements and access needs. Individual users may opt for single-user licenses, while businesses requiring broader access may choose multi-user or enterprise licenses for cost-effective access to the report.
13. Are there any additional resources or data provided in the Niobium Market report?
While the report offers comprehensive insights, it's advisable to review the specific contents or supplementary materials provided to ascertain if additional resources or data are available.
14. How can I stay updated on further developments or reports in the Niobium Market?
To stay informed about further developments, trends, and reports in the Niobium Market, consider subscribing to industry newsletters, following relevant companies and organizations, or regularly checking reputable industry news sources and publications.
Methodology
Step 1 - Identification of Relevant Samples Size from Population Database


Step 2 - Approaches for Defining Global Market Size (Value, Volume* & Price*)

Note*: In applicable scenarios
Step 3 - Data Sources
Primary Research
- Web Analytics
- Survey Reports
- Research Institute
- Latest Research Reports
- Opinion Leaders
Secondary Research
- Annual Reports
- White Paper
- Latest Press Release
- Industry Association
- Paid Database
- Investor Presentations

Step 4 - Data Triangulation
Involves using different sources of information in order to increase the validity of a study
These sources are likely to be stakeholders in a program - participants, other researchers, program staff, other community members, and so on.
Then we put all data in single framework & apply various statistical tools to find out the dynamic on the market.
During the analysis stage, feedback from the stakeholder groups would be compared to determine areas of agreement as well as areas of divergence


