

Key Insights
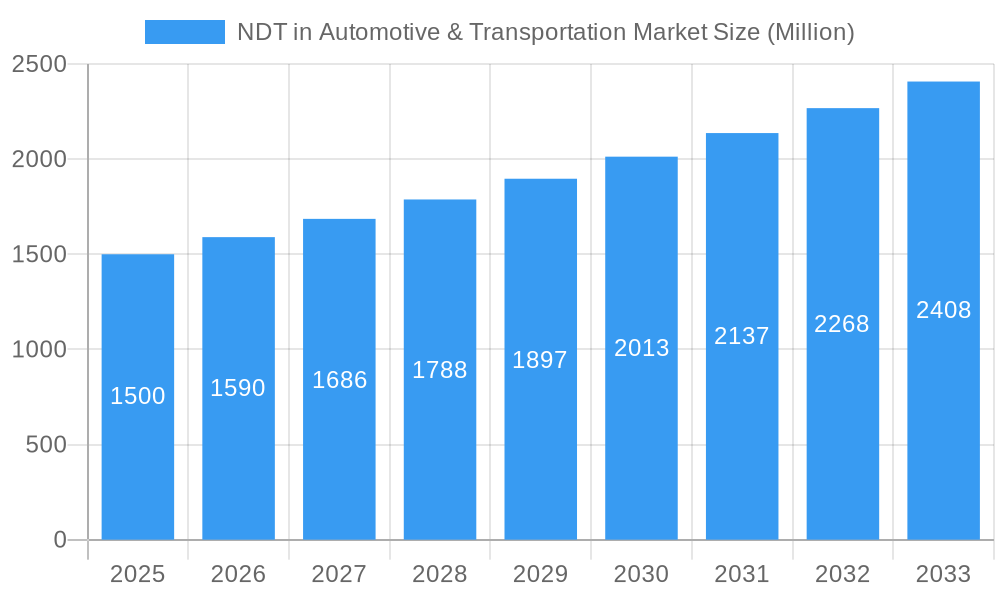
The Non-Destructive Testing (NDT) market within the automotive and transportation sector is experiencing robust growth, driven by stringent safety regulations, increasing demand for high-quality vehicles, and the rising adoption of advanced manufacturing techniques. The market, estimated at $XX million in 2025, is projected to exhibit a Compound Annual Growth Rate (CAGR) of 5.80% from 2025 to 2033. This growth is fueled by the increasing complexity of automotive components and the need for thorough quality control throughout the manufacturing process. The integration of automation and digitalization in NDT methods, such as automated ultrasonic testing and advanced image analysis in radiography, further enhances efficiency and accuracy, driving market expansion. Key segments within the market include equipment (e.g., ultrasonic testing devices, radiography systems) and services (e.g., NDT inspections, training, and certifications). Radiography testing and ultrasonic testing currently dominate the testing technology segment, but other techniques like magnetic particle testing and liquid penetrant testing are also gaining traction due to their suitability for specific applications. The North American and European regions are presently leading the market, driven by established automotive industries and robust regulatory frameworks. However, Asia-Pacific, particularly China and India, show significant growth potential due to expanding automotive manufacturing and infrastructure development. Challenges include the high initial investment required for advanced NDT equipment and the need for skilled personnel to operate and interpret the results.
NDT in Automotive & Transportation Market Market Size (In Billion)
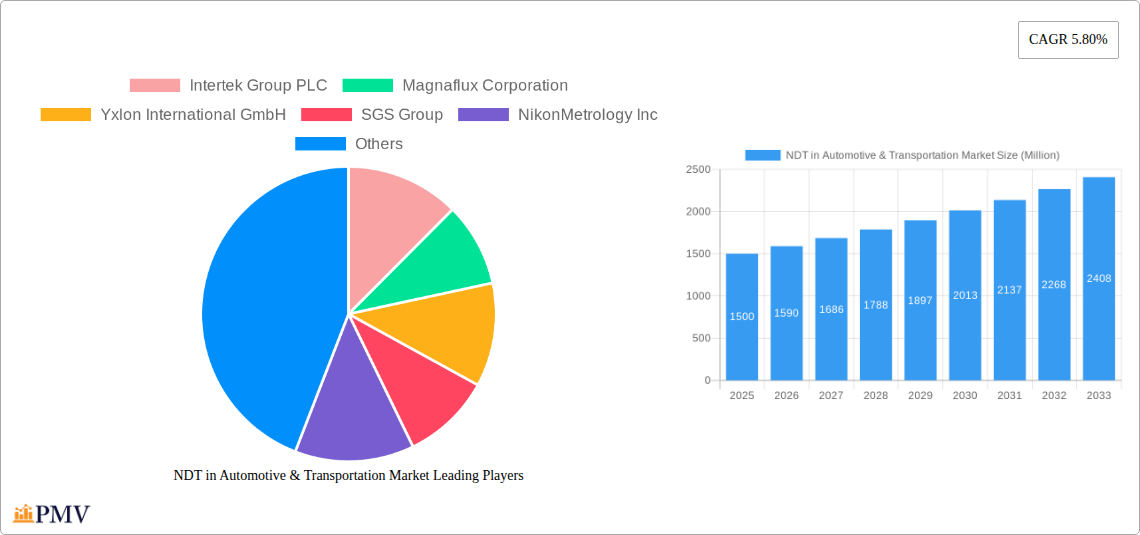
The competitive landscape comprises a mix of global players, including Intertek, Magnaflux, Yxlon, SGS, and others, offering a diverse portfolio of NDT equipment, services, and solutions. These companies are focusing on strategic partnerships, technological advancements, and geographical expansion to strengthen their market position. The increasing adoption of electric vehicles (EVs) presents both opportunities and challenges. While EVs have unique NDT requirements, the focus on battery inspection and high-voltage component testing creates new avenues for growth. Overall, the NDT market in the automotive and transportation industry is poised for continued expansion, driven by technological innovations, stringent safety standards, and the global surge in vehicle production and infrastructure investment. Further market segmentation by vehicle type (passenger cars, commercial vehicles) and specific NDT application (welding inspection, material characterization) will provide a more granular understanding of market dynamics.
NDT in Automotive & Transportation Market Company Market Share
NDT in Automotive & Transportation Market: A Comprehensive Report (2019-2033)
This detailed report provides a comprehensive analysis of the Non-Destructive Testing (NDT) market within the automotive and transportation sectors, covering the period from 2019 to 2033. The report offers invaluable insights into market dynamics, competitive landscapes, technological advancements, and future growth projections, making it an essential resource for industry stakeholders, investors, and researchers. The market is valued at xx Million in 2025 and is projected to reach xx Million by 2033, exhibiting a CAGR of xx% during the forecast period (2025-2033).
NDT in Automotive & Transportation Market Market Structure & Competitive Dynamics
The NDT market in the automotive and transportation sectors is characterized by a moderately concentrated structure with several key players dominating the landscape. Major companies like Intertek Group PLC, Magnaflux Corporation, Yxlon International GmbH, SGS Group, Nikon Metrology Inc, Mistras Group, Olympus Corporation, TÜV Rheinland AG, Applus Services S.A., and Baker Hughes (GE) hold significant market share, often competing based on technological innovation, service offerings, and geographic reach. The market share of these leading players is estimated to be approximately xx%.
The industry's innovation ecosystem is vibrant, driven by continuous advancements in testing technologies and the increasing demand for higher quality and safety standards in vehicles. Stringent regulatory frameworks, particularly concerning vehicle safety and emissions, significantly influence market growth. Furthermore, the increasing adoption of alternative fuel vehicles and electric vehicles (EVs) necessitates advanced NDT techniques, creating new opportunities.
The market witnesses significant M&A activity, with companies strategically acquiring smaller players to expand their service portfolios and geographical presence. Recent M&A deals have involved values ranging from xx Million to xx Million. Product substitutes, such as advanced imaging techniques, are emerging, but they haven't yet significantly impacted the market dominance of traditional NDT methods. End-user trends increasingly favor non-destructive techniques that are faster, more efficient, and provide more detailed information.
- Market Concentration: Moderately Concentrated
- Key Players Market Share: xx%
- M&A Deal Values: xx Million - xx Million
NDT in Automotive & Transportation Market Industry Trends & Insights
The NDT market in automotive and transportation is experiencing robust growth, driven primarily by the escalating demand for enhanced vehicle safety, increased production volumes, and the stringent regulations imposed by government bodies worldwide. The market’s CAGR during the historical period (2019-2024) is estimated at xx%, reflecting consistent growth. The rising adoption of advanced driver-assistance systems (ADAS) and autonomous driving technologies necessitates more comprehensive and sophisticated NDT methods to ensure reliable performance and safety.
Technological disruptions, such as the development of advanced imaging techniques like computed tomography (CT) and phased array ultrasonic testing (PAUT), are significantly enhancing the accuracy and efficiency of NDT procedures. Consumer preferences are shifting towards higher-quality, longer-lasting vehicles, further fueling the demand for advanced NDT solutions. Competitive dynamics are characterized by continuous innovation, strategic partnerships, and geographic expansion by leading players. Market penetration for advanced NDT techniques like PAUT and CT is gradually increasing, reaching an estimated xx% in 2025.
Dominant Markets & Segments in NDT in Automotive & Transportation Market
The NDT market demonstrates significant regional variations, with North America and Europe currently holding dominant positions, driven by robust automotive manufacturing sectors and stringent regulatory standards. Within these regions, countries like the USA, Germany, and Japan stand out as key markets. However, the Asia-Pacific region is exhibiting rapid growth, fueled by expanding automotive production and infrastructure development.
By Type: The "Services" segment currently dominates the market, accounting for approximately xx% of the total revenue in 2025, driven by the outsourcing of NDT needs by automotive manufacturers. However, the "Equipment" segment shows promising growth potential, driven by technological advancements.
By Testing Technology: Ultrasonic Testing and Radiography Testing are the dominant testing technologies, together accounting for approximately xx% of the market in 2025. The adoption of other techniques like Eddy Current and Magnetic Particle Testing is also growing steadily.
Key Drivers (Regional):
- North America & Europe: Stringent safety regulations, established automotive manufacturing base.
- Asia-Pacific: Growing automotive production, increasing infrastructure investments.
NDT in Automotive & Transportation Market Product Innovations
Recent product innovations focus on enhancing the speed, accuracy, and portability of NDT equipment. Olympus's enhanced OmniScan X3 64 fault detector, with improved PAUT capabilities and faster TFM imaging, represents a significant advancement. YXLON International's new YXLON UX50 CT system, designed for the automotive and foundry industries, highlights the focus on adapting NDT technologies to evolving manufacturing processes and materials (e.g., those used in electric vehicles). These innovations are driven by the demand for faster inspection times, higher accuracy, and improved data analysis capabilities.
Report Segmentation & Scope
This report segments the NDT market in automotive and transportation in two primary ways: By Type (Equipment, Services) and By Testing Technology (Radiography Testing, Ultrasonic Testing, Magnetic Particle Testing and Electromagnetic Testing, Liquid Penetrant Testing, Visual Inspection, Eddy Current, Others). Each segment's market size, growth projections, and competitive dynamics are thoroughly analyzed, offering a granular understanding of the market structure. For instance, the Ultrasonic Testing segment is projected to experience the fastest growth due to its versatility and increasing adoption in various automotive applications. The Services segment is expected to maintain its market dominance due to the increased outsourcing trend by automobile manufacturers.
Key Drivers of NDT in Automotive & Transportation Market Growth
Several factors are driving growth in the NDT market, including:
- Stringent Safety Regulations: Governments worldwide are implementing stricter safety regulations for vehicles, creating a significant demand for comprehensive NDT solutions.
- Technological Advancements: Continuous innovations in NDT technologies are enhancing speed, accuracy, and efficiency, making them more attractive to automotive manufacturers.
- Growing Vehicle Production: The global increase in automotive production is directly translating to higher demand for NDT services and equipment.
- Rise of Electric Vehicles: The increasing adoption of electric vehicles necessitates the use of new materials and manufacturing processes, driving the need for advanced NDT solutions.
Challenges in the NDT in Automotive & Transportation Market Sector
Despite promising growth, the NDT market faces challenges:
- High Initial Investment Costs: Advanced NDT equipment can be expensive, potentially hindering adoption by smaller companies.
- Specialized Skilled Labor: The operation and interpretation of NDT results require highly skilled personnel, creating a potential skills gap.
- Supply Chain Disruptions: Global supply chain vulnerabilities can impact the availability of NDT equipment and materials.
- Competitive Pressures: Intense competition among existing and emerging players puts pressure on pricing and margins.
Leading Players in the NDT in Automotive & Transportation Market Market
- Intertek Group PLC
- Magnaflux Corporation
- Yxlon International GmbH
- SGS Group
- Nikon Metrology Inc
- Mistras Group
- Olympus Corporation
- Tuv Rheinland Ag
- Applus Services S A
- Baker Hughes (GE)
Key Developments in NDT in Automotive & Transportation Market Sector
February 2022: Olympus launched the enhanced OmniScan X3 64 fault detector, improving PAUT capabilities and TFM imaging speed. This signifies a significant advancement in ultrasonic testing technology, enhancing efficiency and accuracy.
February 2022: YXLON International unveiled the YXLON UX50 computed tomography system, specifically designed for the automotive and foundry industries. This new system caters to the growing demand for advanced inspection techniques in the manufacturing of traditional and electric vehicle components.
Strategic NDT in Automotive & Transportation Market Market Outlook
The future of the NDT market in the automotive and transportation sector looks promising. Continued advancements in technology, particularly in areas like artificial intelligence (AI) and machine learning (ML), are poised to further enhance the efficiency and accuracy of NDT processes. The increasing demand for electric vehicles and autonomous driving systems will also create significant growth opportunities. Strategic partnerships and investments in research and development will be crucial for companies seeking to maintain a competitive edge in this rapidly evolving market. The focus on improving data analytics from NDT processes will also be a key driver for growth.
NDT in Automotive & Transportation Market Segmentation
-
1. Type
- 1.1. Equipment
- 1.2. Services
-
2. Testing Technology
- 2.1. Radiography Testing
- 2.2. Ultrasonic Testing
- 2.3. Magnetic
- 2.4. Liquid Penetrant Testing
- 2.5. Visual Inspection
- 2.6. Eddy Current
- 2.7. Others
NDT in Automotive & Transportation Market Segmentation By Geography
-
1. North America
- 1.1. United States
- 1.2. Canada
-
2. Europe
- 2.1. United Kingdm
- 2.2. Germany
- 2.3. France
- 2.4. Rest of Europe
-
3. Asia Pacific
- 3.1. China
- 3.2. Japan
- 3.3. India
- 3.4. South Korea
- 3.5. Rest of Asia Pacific
-
4. Latin America
- 4.1. Brazil
- 4.2. Mexico
- 4.3. Rest of Latin America
- 5. Middle East
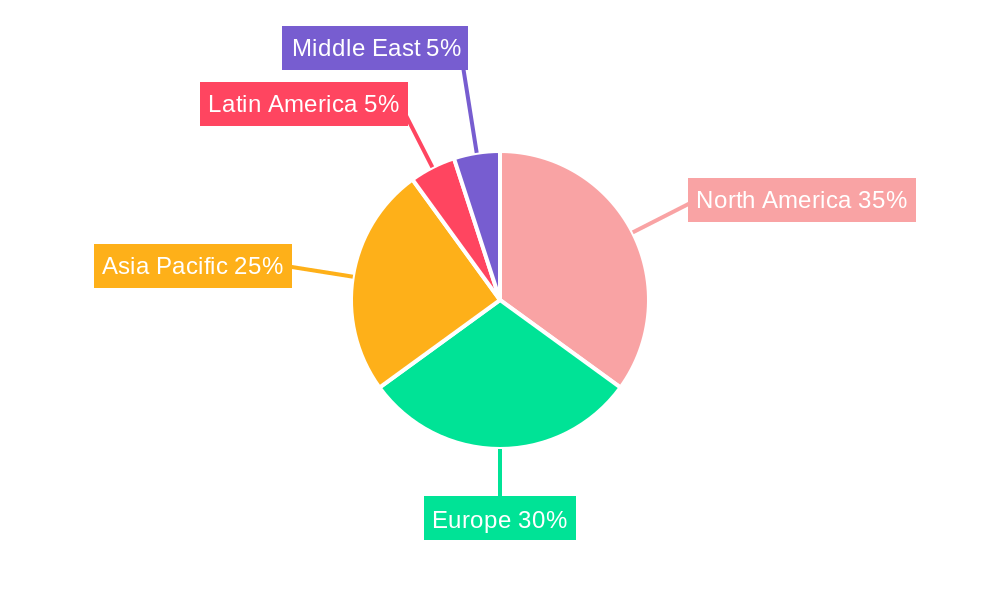
NDT in Automotive & Transportation Market Regional Market Share
Geographic Coverage of NDT in Automotive & Transportation Market
NDT in Automotive & Transportation Market REPORT HIGHLIGHTS
| Aspects | Details |
|---|---|
| Study Period | 2020-2034 |
| Base Year | 2025 |
| Estimated Year | 2026 |
| Forecast Period | 2026-2034 |
| Historical Period | 2020-2025 |
| Growth Rate | CAGR of 6.9% from 2020-2034 |
| Segmentation |
|
Table of Contents
- 1. Introduction
- 1.1. Research Scope
- 1.2. Market Segmentation
- 1.3. Research Objective
- 1.4. Definitions and Assumptions
- 2. Executive Summary
- 2.1. Market Snapshot
- 3. Market Dynamics
- 3.1. Market Drivers
- 3.2. Market Restrains
- 3.3. Market Trends
- 3.4. Market Opportunities
- 4. Market Factor Analysis
- 4.1. Porters Five Forces
- 4.1.1. Bargaining Power of Suppliers
- 4.1.2. Bargaining Power of Buyers
- 4.1.3. Threat of New Entrants
- 4.1.4. Threat of Substitutes
- 4.1.5. Competitive Rivalry
- 4.2. PESTEL analysis
- 4.3. BCG Analysis
- 4.3.1. Stars (High Growth, High Market Share)
- 4.3.2. Cash Cows (Low Growth, High Market Share)
- 4.3.3. Question Mark (High Growth, Low Market Share)
- 4.3.4. Dogs (Low Growth, Low Market Share)
- 4.4. Ansoff Matrix Analysis
- 4.5. Supply Chain Analysis
- 4.6. Regulatory Landscape
- 4.7. Current Market Potential and Opportunity Assessment (TAM–SAM–SOM Framework)
- 4.8. PMV Analyst Note
- 4.1. Porters Five Forces
- 5. Market Analysis, Insights and Forecast 2021-2033
- 5.1. Market Analysis, Insights and Forecast - by Type
- 5.1.1. Equipment
- 5.1.2. Services
- 5.2. Market Analysis, Insights and Forecast - by Testing Technology
- 5.2.1. Radiography Testing
- 5.2.2. Ultrasonic Testing
- 5.2.3. Magnetic
- 5.2.4. Liquid Penetrant Testing
- 5.2.5. Visual Inspection
- 5.2.6. Eddy Current
- 5.2.7. Others
- 5.3. Market Analysis, Insights and Forecast - by Region
- 5.3.1. North America
- 5.3.2. Europe
- 5.3.3. Asia Pacific
- 5.3.4. Latin America
- 5.3.5. Middle East
- 5.1. Market Analysis, Insights and Forecast - by Type
- 6. Global NDT in Automotive & Transportation Market Analysis, Insights and Forecast, 2021-2033
- 6.1. Market Analysis, Insights and Forecast - by Type
- 6.1.1. Equipment
- 6.1.2. Services
- 6.2. Market Analysis, Insights and Forecast - by Testing Technology
- 6.2.1. Radiography Testing
- 6.2.2. Ultrasonic Testing
- 6.2.3. Magnetic
- 6.2.4. Liquid Penetrant Testing
- 6.2.5. Visual Inspection
- 6.2.6. Eddy Current
- 6.2.7. Others
- 6.1. Market Analysis, Insights and Forecast - by Type
- 7. North America NDT in Automotive & Transportation Market Analysis, Insights and Forecast, 2020-2032
- 7.1. Market Analysis, Insights and Forecast - by Type
- 7.1.1. Equipment
- 7.1.2. Services
- 7.2. Market Analysis, Insights and Forecast - by Testing Technology
- 7.2.1. Radiography Testing
- 7.2.2. Ultrasonic Testing
- 7.2.3. Magnetic
- 7.2.4. Liquid Penetrant Testing
- 7.2.5. Visual Inspection
- 7.2.6. Eddy Current
- 7.2.7. Others
- 7.1. Market Analysis, Insights and Forecast - by Type
- 8. Europe NDT in Automotive & Transportation Market Analysis, Insights and Forecast, 2020-2032
- 8.1. Market Analysis, Insights and Forecast - by Type
- 8.1.1. Equipment
- 8.1.2. Services
- 8.2. Market Analysis, Insights and Forecast - by Testing Technology
- 8.2.1. Radiography Testing
- 8.2.2. Ultrasonic Testing
- 8.2.3. Magnetic
- 8.2.4. Liquid Penetrant Testing
- 8.2.5. Visual Inspection
- 8.2.6. Eddy Current
- 8.2.7. Others
- 8.1. Market Analysis, Insights and Forecast - by Type
- 9. Asia Pacific NDT in Automotive & Transportation Market Analysis, Insights and Forecast, 2020-2032
- 9.1. Market Analysis, Insights and Forecast - by Type
- 9.1.1. Equipment
- 9.1.2. Services
- 9.2. Market Analysis, Insights and Forecast - by Testing Technology
- 9.2.1. Radiography Testing
- 9.2.2. Ultrasonic Testing
- 9.2.3. Magnetic
- 9.2.4. Liquid Penetrant Testing
- 9.2.5. Visual Inspection
- 9.2.6. Eddy Current
- 9.2.7. Others
- 9.1. Market Analysis, Insights and Forecast - by Type
- 10. Latin America NDT in Automotive & Transportation Market Analysis, Insights and Forecast, 2020-2032
- 10.1. Market Analysis, Insights and Forecast - by Type
- 10.1.1. Equipment
- 10.1.2. Services
- 10.2. Market Analysis, Insights and Forecast - by Testing Technology
- 10.2.1. Radiography Testing
- 10.2.2. Ultrasonic Testing
- 10.2.3. Magnetic
- 10.2.4. Liquid Penetrant Testing
- 10.2.5. Visual Inspection
- 10.2.6. Eddy Current
- 10.2.7. Others
- 10.1. Market Analysis, Insights and Forecast - by Type
- 11. Middle East NDT in Automotive & Transportation Market Analysis, Insights and Forecast, 2020-2032
- 11.1. Market Analysis, Insights and Forecast - by Type
- 11.1.1. Equipment
- 11.1.2. Services
- 11.2. Market Analysis, Insights and Forecast - by Testing Technology
- 11.2.1. Radiography Testing
- 11.2.2. Ultrasonic Testing
- 11.2.3. Magnetic
- 11.2.4. Liquid Penetrant Testing
- 11.2.5. Visual Inspection
- 11.2.6. Eddy Current
- 11.2.7. Others
- 11.1. Market Analysis, Insights and Forecast - by Type
- 12. Competitive Analysis
- 12.1. Company Profiles
- 12.1.1 Intertek Group PLC
- 12.1.1.1. Company Overview
- 12.1.1.2. Products
- 12.1.1.3. Company Financials
- 12.1.1.4. SWOT Analysis
- 12.1.2 Magnaflux Corporation
- 12.1.2.1. Company Overview
- 12.1.2.2. Products
- 12.1.2.3. Company Financials
- 12.1.2.4. SWOT Analysis
- 12.1.3 Yxlon International GmbH
- 12.1.3.1. Company Overview
- 12.1.3.2. Products
- 12.1.3.3. Company Financials
- 12.1.3.4. SWOT Analysis
- 12.1.4 SGS Group
- 12.1.4.1. Company Overview
- 12.1.4.2. Products
- 12.1.4.3. Company Financials
- 12.1.4.4. SWOT Analysis
- 12.1.5 NikonMetrology Inc
- 12.1.5.1. Company Overview
- 12.1.5.2. Products
- 12.1.5.3. Company Financials
- 12.1.5.4. SWOT Analysis
- 12.1.6 Mistras Group
- 12.1.6.1. Company Overview
- 12.1.6.2. Products
- 12.1.6.3. Company Financials
- 12.1.6.4. SWOT Analysis
- 12.1.7 Olympus Corporation
- 12.1.7.1. Company Overview
- 12.1.7.2. Products
- 12.1.7.3. Company Financials
- 12.1.7.4. SWOT Analysis
- 12.1.8 Tuv Rheinland Ag*List Not Exhaustive
- 12.1.8.1. Company Overview
- 12.1.8.2. Products
- 12.1.8.3. Company Financials
- 12.1.8.4. SWOT Analysis
- 12.1.9 Applus Services S A
- 12.1.9.1. Company Overview
- 12.1.9.2. Products
- 12.1.9.3. Company Financials
- 12.1.9.4. SWOT Analysis
- 12.1.10 Baker Hughes(GE)
- 12.1.10.1. Company Overview
- 12.1.10.2. Products
- 12.1.10.3. Company Financials
- 12.1.10.4. SWOT Analysis
- 12.1.1 Intertek Group PLC
- 12.2. Market Entropy
- 12.2.1 Company's Key Areas Served
- 12.2.2 Recent Developments
- 12.3. Company Market Share Analysis 2025
- 12.3.1 Top 5 Companies Market Share Analysis
- 12.3.2 Top 3 Companies Market Share Analysis
- 12.4. List of Potential Customers
- 13. Research Methodology
List of Figures
- Figure 1: Global NDT in Automotive & Transportation Market Revenue Breakdown (undefined, %) by Region 2025 & 2033
- Figure 2: North America NDT in Automotive & Transportation Market Revenue (undefined), by Type 2025 & 2033
- Figure 3: North America NDT in Automotive & Transportation Market Revenue Share (%), by Type 2025 & 2033
- Figure 4: North America NDT in Automotive & Transportation Market Revenue (undefined), by Testing Technology 2025 & 2033
- Figure 5: North America NDT in Automotive & Transportation Market Revenue Share (%), by Testing Technology 2025 & 2033
- Figure 6: North America NDT in Automotive & Transportation Market Revenue (undefined), by Country 2025 & 2033
- Figure 7: North America NDT in Automotive & Transportation Market Revenue Share (%), by Country 2025 & 2033
- Figure 8: Europe NDT in Automotive & Transportation Market Revenue (undefined), by Type 2025 & 2033
- Figure 9: Europe NDT in Automotive & Transportation Market Revenue Share (%), by Type 2025 & 2033
- Figure 10: Europe NDT in Automotive & Transportation Market Revenue (undefined), by Testing Technology 2025 & 2033
- Figure 11: Europe NDT in Automotive & Transportation Market Revenue Share (%), by Testing Technology 2025 & 2033
- Figure 12: Europe NDT in Automotive & Transportation Market Revenue (undefined), by Country 2025 & 2033
- Figure 13: Europe NDT in Automotive & Transportation Market Revenue Share (%), by Country 2025 & 2033
- Figure 14: Asia Pacific NDT in Automotive & Transportation Market Revenue (undefined), by Type 2025 & 2033
- Figure 15: Asia Pacific NDT in Automotive & Transportation Market Revenue Share (%), by Type 2025 & 2033
- Figure 16: Asia Pacific NDT in Automotive & Transportation Market Revenue (undefined), by Testing Technology 2025 & 2033
- Figure 17: Asia Pacific NDT in Automotive & Transportation Market Revenue Share (%), by Testing Technology 2025 & 2033
- Figure 18: Asia Pacific NDT in Automotive & Transportation Market Revenue (undefined), by Country 2025 & 2033
- Figure 19: Asia Pacific NDT in Automotive & Transportation Market Revenue Share (%), by Country 2025 & 2033
- Figure 20: Latin America NDT in Automotive & Transportation Market Revenue (undefined), by Type 2025 & 2033
- Figure 21: Latin America NDT in Automotive & Transportation Market Revenue Share (%), by Type 2025 & 2033
- Figure 22: Latin America NDT in Automotive & Transportation Market Revenue (undefined), by Testing Technology 2025 & 2033
- Figure 23: Latin America NDT in Automotive & Transportation Market Revenue Share (%), by Testing Technology 2025 & 2033
- Figure 24: Latin America NDT in Automotive & Transportation Market Revenue (undefined), by Country 2025 & 2033
- Figure 25: Latin America NDT in Automotive & Transportation Market Revenue Share (%), by Country 2025 & 2033
- Figure 26: Middle East NDT in Automotive & Transportation Market Revenue (undefined), by Type 2025 & 2033
- Figure 27: Middle East NDT in Automotive & Transportation Market Revenue Share (%), by Type 2025 & 2033
- Figure 28: Middle East NDT in Automotive & Transportation Market Revenue (undefined), by Testing Technology 2025 & 2033
- Figure 29: Middle East NDT in Automotive & Transportation Market Revenue Share (%), by Testing Technology 2025 & 2033
- Figure 30: Middle East NDT in Automotive & Transportation Market Revenue (undefined), by Country 2025 & 2033
- Figure 31: Middle East NDT in Automotive & Transportation Market Revenue Share (%), by Country 2025 & 2033
List of Tables
- Table 1: Global NDT in Automotive & Transportation Market Revenue undefined Forecast, by Type 2020 & 2033
- Table 2: Global NDT in Automotive & Transportation Market Revenue undefined Forecast, by Testing Technology 2020 & 2033
- Table 3: Global NDT in Automotive & Transportation Market Revenue undefined Forecast, by Region 2020 & 2033
- Table 4: Global NDT in Automotive & Transportation Market Revenue undefined Forecast, by Type 2020 & 2033
- Table 5: Global NDT in Automotive & Transportation Market Revenue undefined Forecast, by Testing Technology 2020 & 2033
- Table 6: Global NDT in Automotive & Transportation Market Revenue undefined Forecast, by Country 2020 & 2033
- Table 7: United States NDT in Automotive & Transportation Market Revenue (undefined) Forecast, by Application 2020 & 2033
- Table 8: Canada NDT in Automotive & Transportation Market Revenue (undefined) Forecast, by Application 2020 & 2033
- Table 9: Global NDT in Automotive & Transportation Market Revenue undefined Forecast, by Type 2020 & 2033
- Table 10: Global NDT in Automotive & Transportation Market Revenue undefined Forecast, by Testing Technology 2020 & 2033
- Table 11: Global NDT in Automotive & Transportation Market Revenue undefined Forecast, by Country 2020 & 2033
- Table 12: United Kingdm NDT in Automotive & Transportation Market Revenue (undefined) Forecast, by Application 2020 & 2033
- Table 13: Germany NDT in Automotive & Transportation Market Revenue (undefined) Forecast, by Application 2020 & 2033
- Table 14: France NDT in Automotive & Transportation Market Revenue (undefined) Forecast, by Application 2020 & 2033
- Table 15: Rest of Europe NDT in Automotive & Transportation Market Revenue (undefined) Forecast, by Application 2020 & 2033
- Table 16: Global NDT in Automotive & Transportation Market Revenue undefined Forecast, by Type 2020 & 2033
- Table 17: Global NDT in Automotive & Transportation Market Revenue undefined Forecast, by Testing Technology 2020 & 2033
- Table 18: Global NDT in Automotive & Transportation Market Revenue undefined Forecast, by Country 2020 & 2033
- Table 19: China NDT in Automotive & Transportation Market Revenue (undefined) Forecast, by Application 2020 & 2033
- Table 20: Japan NDT in Automotive & Transportation Market Revenue (undefined) Forecast, by Application 2020 & 2033
- Table 21: India NDT in Automotive & Transportation Market Revenue (undefined) Forecast, by Application 2020 & 2033
- Table 22: South Korea NDT in Automotive & Transportation Market Revenue (undefined) Forecast, by Application 2020 & 2033
- Table 23: Rest of Asia Pacific NDT in Automotive & Transportation Market Revenue (undefined) Forecast, by Application 2020 & 2033
- Table 24: Global NDT in Automotive & Transportation Market Revenue undefined Forecast, by Type 2020 & 2033
- Table 25: Global NDT in Automotive & Transportation Market Revenue undefined Forecast, by Testing Technology 2020 & 2033
- Table 26: Global NDT in Automotive & Transportation Market Revenue undefined Forecast, by Country 2020 & 2033
- Table 27: Brazil NDT in Automotive & Transportation Market Revenue (undefined) Forecast, by Application 2020 & 2033
- Table 28: Mexico NDT in Automotive & Transportation Market Revenue (undefined) Forecast, by Application 2020 & 2033
- Table 29: Rest of Latin America NDT in Automotive & Transportation Market Revenue (undefined) Forecast, by Application 2020 & 2033
- Table 30: Global NDT in Automotive & Transportation Market Revenue undefined Forecast, by Type 2020 & 2033
- Table 31: Global NDT in Automotive & Transportation Market Revenue undefined Forecast, by Testing Technology 2020 & 2033
- Table 32: Global NDT in Automotive & Transportation Market Revenue undefined Forecast, by Country 2020 & 2033
Frequently Asked Questions
1. What is the projected Compound Annual Growth Rate (CAGR) of the NDT in Automotive & Transportation Market?
The projected CAGR is approximately 6.9%.
2. Which companies are prominent players in the NDT in Automotive & Transportation Market?
Key companies in the market include Intertek Group PLC, Magnaflux Corporation, Yxlon International GmbH, SGS Group, NikonMetrology Inc, Mistras Group, Olympus Corporation, Tuv Rheinland Ag*List Not Exhaustive, Applus Services S A, Baker Hughes(GE).
3. What are the main segments of the NDT in Automotive & Transportation Market?
The market segments include Type, Testing Technology.
4. Can you provide details about the market size?
The market size is estimated to be USD XXX N/A as of 2022.
5. What are some drivers contributing to market growth?
Upsurge in the Demand for EVs; Increase in Demand for Flaw Detection to Reduce Repair Cost.
6. What are the notable trends driving market growth?
Eddy Current Testing Technology is Expected to Drive Growth.
7. Are there any restraints impacting market growth?
Lack of Skilled Workforce.
8. Can you provide examples of recent developments in the market?
February 2022 - The field-proven phased array ultrasonic testing (PAUT) product line from Olympus received improved power and performance from the new OmniScan X3 64 fault detector. The total focusing method (TFM) imaging data acquisition speed can be increased using this 64-channel instrument's pulse capacity to drive phased array (PA) probes with more elements.
9. What pricing options are available for accessing the report?
Pricing options include single-user, multi-user, and enterprise licenses priced at USD 4750, USD 5250, and USD 8750 respectively.
10. Is the market size provided in terms of value or volume?
The market size is provided in terms of value, measured in N/A.
11. Are there any specific market keywords associated with the report?
Yes, the market keyword associated with the report is "NDT in Automotive & Transportation Market," which aids in identifying and referencing the specific market segment covered.
12. How do I determine which pricing option suits my needs best?
The pricing options vary based on user requirements and access needs. Individual users may opt for single-user licenses, while businesses requiring broader access may choose multi-user or enterprise licenses for cost-effective access to the report.
13. Are there any additional resources or data provided in the NDT in Automotive & Transportation Market report?
While the report offers comprehensive insights, it's advisable to review the specific contents or supplementary materials provided to ascertain if additional resources or data are available.
14. How can I stay updated on further developments or reports in the NDT in Automotive & Transportation Market?
To stay informed about further developments, trends, and reports in the NDT in Automotive & Transportation Market, consider subscribing to industry newsletters, following relevant companies and organizations, or regularly checking reputable industry news sources and publications.
Methodology
Step 1 - Identification of Relevant Samples Size from Population Database


Step 2 - Approaches for Defining Global Market Size (Value, Volume* & Price*)

Note*: In applicable scenarios
Step 3 - Data Sources
Primary Research
- Web Analytics
- Survey Reports
- Research Institute
- Latest Research Reports
- Opinion Leaders
Secondary Research
- Annual Reports
- White Paper
- Latest Press Release
- Industry Association
- Paid Database
- Investor Presentations

Step 4 - Data Triangulation
Involves using different sources of information in order to increase the validity of a study
These sources are likely to be stakeholders in a program - participants, other researchers, program staff, other community members, and so on.
Then we put all data in single framework & apply various statistical tools to find out the dynamic on the market.
During the analysis stage, feedback from the stakeholder groups would be compared to determine areas of agreement as well as areas of divergence