


Key Insights
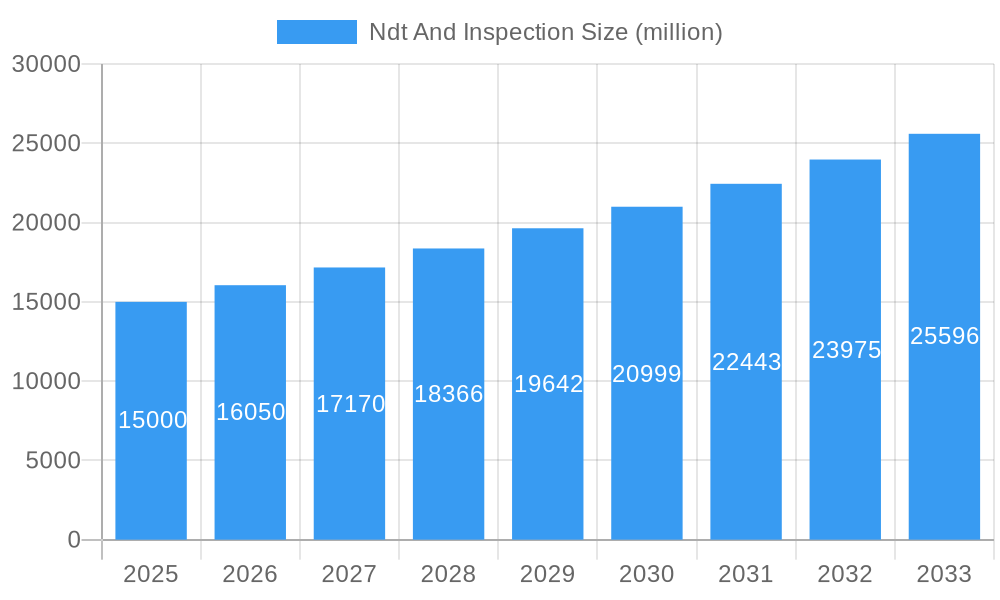
The Non-Destructive Testing (NDT) and Inspection market is experiencing robust growth, driven by increasing demand for ensuring product quality and safety across diverse industries. The market, estimated at $15 billion in 2025, is projected to expand at a Compound Annual Growth Rate (CAGR) of 7% from 2025 to 2033, reaching approximately $25 billion by 2033. This growth is fueled by several key factors: the burgeoning infrastructure development globally necessitating rigorous quality checks; rising adoption of advanced NDT techniques like ultrasonic and eddy current testing for enhanced accuracy and efficiency; stringent regulatory compliance mandates in sectors like aerospace, automotive, and energy; and increasing focus on predictive maintenance strategies to minimize downtime and operational costs. The market’s segmentation reveals strong demand across various applications, including inspection services, training, equipment rental, and calibration services. Ultrasonic and radiographic testing currently dominate the type segment, but other methods like eddy current and liquid penetrant testing are witnessing significant adoption due to their specific application advantages. Geographical analysis indicates a significant market presence in North America and Europe, driven by established industrial bases and technological advancements. However, rapidly industrializing economies in Asia-Pacific are poised for significant growth in the coming years, contributing substantially to the overall market expansion.
Ndt And Inspection Market Size (In Billion)

Despite the significant growth potential, the NDT and Inspection market faces certain challenges. High initial investment costs associated with advanced NDT equipment can be a barrier to entry for smaller companies. Moreover, the need for skilled and certified personnel to operate and interpret the results from complex NDT techniques presents a skilled labor shortage. Technological advancements are continually evolving, necessitating continuous training and upskilling to maintain proficiency. Despite these restraints, the overall positive outlook for the industry, driven by rising industrialization, increased safety regulations, and growing awareness of the importance of quality control, is expected to outweigh these challenges, ensuring sustained market expansion. The presence of numerous established players and emerging companies indicates a competitive but dynamic landscape, fostering innovation and driving further market growth.
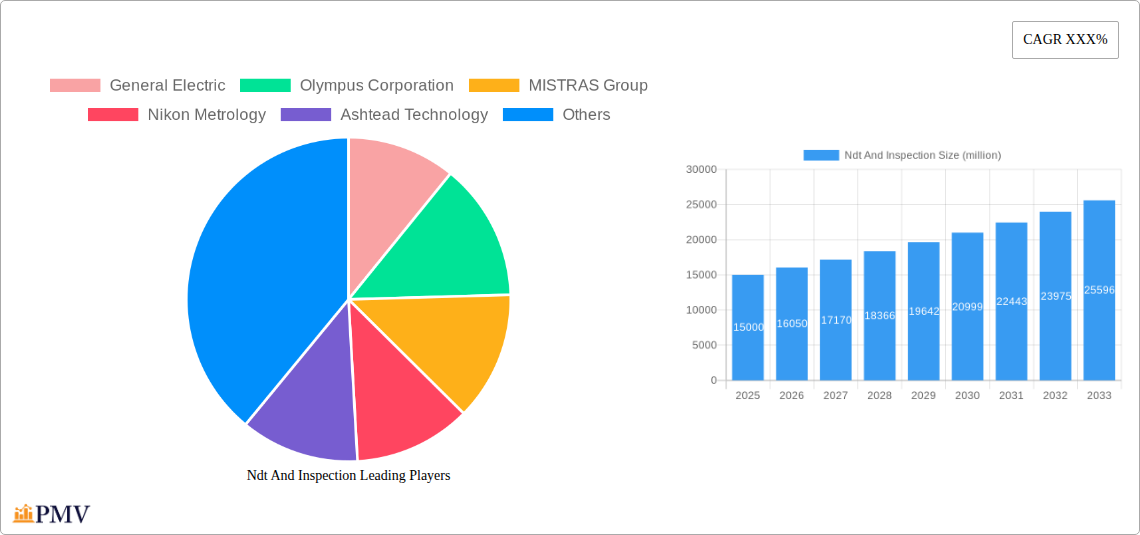
Ndt And Inspection Company Market Share
Nondestructive Testing (NDT) and Inspection Market Report: 2019-2033
This comprehensive report provides an in-depth analysis of the global NDT and Inspection market, projecting a market value exceeding $xx million by 2033. The report covers the period 2019-2033, with a base year of 2025 and a forecast period of 2025-2033. It offers actionable insights into market trends, competitive dynamics, and future growth potential, making it an invaluable resource for industry professionals, investors, and strategic decision-makers.
Ndt And Inspection Market Structure & Competitive Dynamics
The global NDT and Inspection market exhibits a moderately consolidated structure, with key players like General Electric, Olympus Corporation, MISTRAS Group, Nikon Metrology, Ashtead Technology, YXLON International, Sonatest, Bosello High Technology srl, Eddyfi, Cygnus Instruments, and NDT Global GmbH holding significant market share. The combined market share of the top five players is estimated at xx%.
Innovation ecosystems are dynamic, driven by advancements in sensor technology, AI-powered data analytics, and robotic automation. Regulatory frameworks, such as those mandated by ASME and ISO, significantly influence the adoption of NDT methods. The market witnesses considerable substitution among different NDT techniques based on application requirements and cost-effectiveness. End-user trends indicate a growing preference for non-destructive, rapid, and automated inspection processes. Mergers and acquisitions (M&A) activity has been notable in recent years, with deal values exceeding $xx million in the historical period (2019-2024). For example, the acquisition of Company X by Company Y in 2022 resulted in a significant market share shift.
Ndt And Inspection Industry Trends & Insights
The NDT and Inspection market is experiencing robust growth, driven by several key factors. The increasing demand for improved infrastructure across various sectors like energy, aerospace, and manufacturing is a significant driver. The rising focus on safety and quality control, coupled with stringent regulatory compliance, further fuels market expansion. Technological advancements, such as the integration of AI and machine learning for automated defect detection and analysis, are revolutionizing inspection processes, improving accuracy and efficiency. The market has witnessed a substantial increase in the adoption of advanced NDT techniques like phased array ultrasonic testing (PAUT) and advanced electromagnetic testing.
Consumer preferences are shifting towards more cost-effective, rapid, and portable NDT equipment. This trend is evident in the rising demand for handheld and portable devices. The market is experiencing a CAGR of xx% during the forecast period (2025-2033), with market penetration steadily increasing in developing economies. Competitive dynamics are characterized by intense rivalry, particularly amongst the leading players who invest heavily in research and development, and expand their service offerings geographically.
Dominant Markets & Segments in Ndt And Inspection
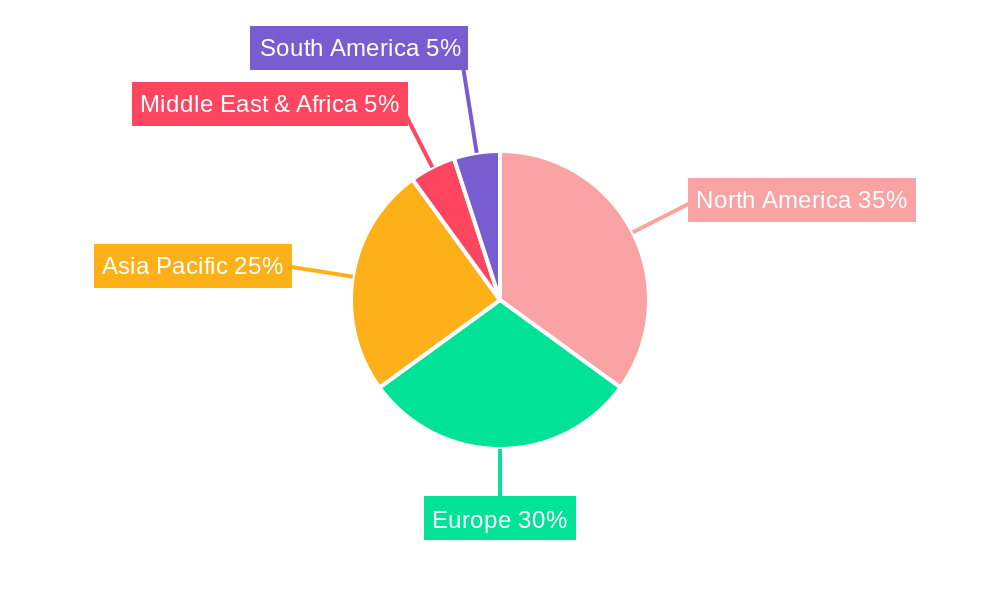
The North American region currently holds the largest market share in the global NDT and Inspection industry, driven primarily by robust industrial activity and stringent quality standards. Within this region, the United States dominates, owing to factors such as the significant presence of key players, substantial infrastructure investments, and strong government support for technological advancements.
- Key Drivers in North America:
- Robust industrial activity across sectors like aerospace, energy, and manufacturing.
- Stringent safety regulations and quality control standards.
- Significant investment in infrastructure development projects.
- Strong government support for technological innovation and R&D.
In terms of application, Inspection Services account for the largest segment, followed by Equipment Rental Services. Within NDT types, Ultrasonic Testing and Radiographic Testing hold significant market share, primarily due to their versatility and reliability across diverse applications.
The Equipment Rental Services segment demonstrates high growth due to the increasing preference for cost-effective solutions.
Ndt And Inspection Product Innovations
Recent product innovations focus on enhancing the speed, accuracy, and portability of NDT equipment. Miniaturized sensors, advanced data processing algorithms, and automated reporting features are becoming increasingly common. The integration of AI and machine learning capabilities is enabling real-time defect identification and analysis, resulting in significant improvements in inspection efficiency and reduced human error. These innovations are driving a paradigm shift towards proactive and predictive maintenance strategies, leading to significant cost savings and enhanced safety.
Report Segmentation & Scope
The report segments the NDT and Inspection market by Application (Inspection Services, Training Services, Equipment Rental Services, Calibration services) and by Type (Ultrasonic Testing, Visual Testing, Magnetic Particle Testing, Liquid Penetrant Testing, Eddy-Current Testing, Radiographic Testing, Acoustic Emission Testing, Other). Each segment's growth projections, market sizes, and competitive dynamics are analyzed in detail, providing a comprehensive overview of market opportunities and challenges. For example, the Inspection Services segment is projected to experience substantial growth due to increasing industrial activity. In contrast, the Training Services segment will witness moderate growth driven by the need for skilled professionals in the field.
Key Drivers of Ndt And Inspection Growth
Several factors contribute to the growth of the NDT and Inspection market. Stringent safety regulations and quality control standards across various industries necessitate thorough and reliable inspection methods. The increasing demand for improved infrastructure in developing countries fuels demand for sophisticated NDT equipment. Advancements in sensor technology, AI-powered data analytics, and robotic automation are improving the efficiency and accuracy of inspections. Government initiatives promoting industrial automation and digitalization create a favorable environment for market growth.
Challenges in the Ndt And Inspection Sector
The NDT and Inspection sector faces certain challenges. High initial investment costs for advanced NDT equipment can be a barrier for smaller companies. The need for skilled and certified personnel is a significant constraint, particularly in developing countries. Maintaining data integrity and ensuring compliance with stringent data security regulations pose additional challenges. Furthermore, intense competition among established players creates pressure on profit margins. This pressure is compounded by the increasing cost of raw materials and supply chain disruptions. The projected impact of these challenges on overall market growth is approximately xx%.
Leading Players in the Ndt And Inspection Market
- General Electric
- Olympus Corporation
- MISTRAS Group
- Nikon Metrology
- Ashtead Technology
- YXLON International
- Sonatest
- Bosello High Technology srl
- Eddyfi
- Cygnus Instruments
- NDT Global GmbH
Key Developments in Ndt And Inspection Sector
- 2022 Q4: General Electric launched a new line of advanced ultrasonic testing equipment.
- 2023 Q1: Olympus Corporation acquired a smaller NDT equipment manufacturer, expanding its market share.
- 2023 Q3: A significant regulatory update impacted the certification processes for NDT technicians.
Strategic Ndt And Inspection Market Outlook
The NDT and Inspection market is poised for substantial growth over the forecast period, driven by the continued adoption of advanced technologies and increasing demand across diverse industries. Strategic opportunities exist for companies focused on developing innovative NDT solutions that incorporate AI and machine learning. Expanding into emerging markets and forging strategic partnerships with key players in related sectors are likely to offer lucrative avenues for future growth. The rising focus on digital transformation within the industry creates opportunities for companies providing data analytics and cloud-based solutions for NDT data management and analysis.
Ndt And Inspection Segmentation
-
1. Application
- 1.1. Inspection Services
- 1.2. Training Services
- 1.3. Equipment Rental Services
- 1.4. Calibration services
-
2. Type
- 2.1. Ultrasonic Testing
- 2.2. Visual Testing
- 2.3. Magnetic Particle Testing
- 2.4. Liquid Penetrant Testing
- 2.5. Eddy-Current Testing
- 2.6. Radiographic Testing
- 2.7. Acoustic Emission Testing
- 2.8. Other
Ndt And Inspection Segmentation By Geography
-
1. North America
- 1.1. United States
- 1.2. Canada
- 1.3. Mexico
-
2. South America
- 2.1. Brazil
- 2.2. Argentina
- 2.3. Rest of South America
-
3. Europe
- 3.1. United Kingdom
- 3.2. Germany
- 3.3. France
- 3.4. Italy
- 3.5. Spain
- 3.6. Russia
- 3.7. Benelux
- 3.8. Nordics
- 3.9. Rest of Europe
-
4. Middle East & Africa
- 4.1. Turkey
- 4.2. Israel
- 4.3. GCC
- 4.4. North Africa
- 4.5. South Africa
- 4.6. Rest of Middle East & Africa
-
5. Asia Pacific
- 5.1. China
- 5.2. India
- 5.3. Japan
- 5.4. South Korea
- 5.5. ASEAN
- 5.6. Oceania
- 5.7. Rest of Asia Pacific
Ndt And Inspection Regional Market Share
Geographic Coverage of Ndt And Inspection
Ndt And Inspection REPORT HIGHLIGHTS
| Aspects | Details |
|---|---|
| Study Period | 2020-2034 |
| Base Year | 2025 |
| Estimated Year | 2026 |
| Forecast Period | 2026-2034 |
| Historical Period | 2020-2025 |
| Growth Rate | CAGR of XXX% from 2020-2034 |
| Segmentation |
|
Table of Contents
- 1. Introduction
- 1.1. Research Scope
- 1.2. Market Segmentation
- 1.3. Research Methodology
- 1.4. Definitions and Assumptions
- 2. Executive Summary
- 2.1. Introduction
- 3. Market Dynamics
- 3.1. Introduction
- 3.2. Market Drivers
- 3.3. Market Restrains
- 3.4. Market Trends
- 4. Market Factor Analysis
- 4.1. Porters Five Forces
- 4.2. Supply/Value Chain
- 4.3. PESTEL analysis
- 4.4. Market Entropy
- 4.5. Patent/Trademark Analysis
- 5. Global Ndt And Inspection Analysis, Insights and Forecast, 2020-2032
- 5.1. Market Analysis, Insights and Forecast - by Application
- 5.1.1. Inspection Services
- 5.1.2. Training Services
- 5.1.3. Equipment Rental Services
- 5.1.4. Calibration services
- 5.2. Market Analysis, Insights and Forecast - by Type
- 5.2.1. Ultrasonic Testing
- 5.2.2. Visual Testing
- 5.2.3. Magnetic Particle Testing
- 5.2.4. Liquid Penetrant Testing
- 5.2.5. Eddy-Current Testing
- 5.2.6. Radiographic Testing
- 5.2.7. Acoustic Emission Testing
- 5.2.8. Other
- 5.3. Market Analysis, Insights and Forecast - by Region
- 5.3.1. North America
- 5.3.2. South America
- 5.3.3. Europe
- 5.3.4. Middle East & Africa
- 5.3.5. Asia Pacific
- 5.1. Market Analysis, Insights and Forecast - by Application
- 6. North America Ndt And Inspection Analysis, Insights and Forecast, 2020-2032
- 6.1. Market Analysis, Insights and Forecast - by Application
- 6.1.1. Inspection Services
- 6.1.2. Training Services
- 6.1.3. Equipment Rental Services
- 6.1.4. Calibration services
- 6.2. Market Analysis, Insights and Forecast - by Type
- 6.2.1. Ultrasonic Testing
- 6.2.2. Visual Testing
- 6.2.3. Magnetic Particle Testing
- 6.2.4. Liquid Penetrant Testing
- 6.2.5. Eddy-Current Testing
- 6.2.6. Radiographic Testing
- 6.2.7. Acoustic Emission Testing
- 6.2.8. Other
- 6.1. Market Analysis, Insights and Forecast - by Application
- 7. South America Ndt And Inspection Analysis, Insights and Forecast, 2020-2032
- 7.1. Market Analysis, Insights and Forecast - by Application
- 7.1.1. Inspection Services
- 7.1.2. Training Services
- 7.1.3. Equipment Rental Services
- 7.1.4. Calibration services
- 7.2. Market Analysis, Insights and Forecast - by Type
- 7.2.1. Ultrasonic Testing
- 7.2.2. Visual Testing
- 7.2.3. Magnetic Particle Testing
- 7.2.4. Liquid Penetrant Testing
- 7.2.5. Eddy-Current Testing
- 7.2.6. Radiographic Testing
- 7.2.7. Acoustic Emission Testing
- 7.2.8. Other
- 7.1. Market Analysis, Insights and Forecast - by Application
- 8. Europe Ndt And Inspection Analysis, Insights and Forecast, 2020-2032
- 8.1. Market Analysis, Insights and Forecast - by Application
- 8.1.1. Inspection Services
- 8.1.2. Training Services
- 8.1.3. Equipment Rental Services
- 8.1.4. Calibration services
- 8.2. Market Analysis, Insights and Forecast - by Type
- 8.2.1. Ultrasonic Testing
- 8.2.2. Visual Testing
- 8.2.3. Magnetic Particle Testing
- 8.2.4. Liquid Penetrant Testing
- 8.2.5. Eddy-Current Testing
- 8.2.6. Radiographic Testing
- 8.2.7. Acoustic Emission Testing
- 8.2.8. Other
- 8.1. Market Analysis, Insights and Forecast - by Application
- 9. Middle East & Africa Ndt And Inspection Analysis, Insights and Forecast, 2020-2032
- 9.1. Market Analysis, Insights and Forecast - by Application
- 9.1.1. Inspection Services
- 9.1.2. Training Services
- 9.1.3. Equipment Rental Services
- 9.1.4. Calibration services
- 9.2. Market Analysis, Insights and Forecast - by Type
- 9.2.1. Ultrasonic Testing
- 9.2.2. Visual Testing
- 9.2.3. Magnetic Particle Testing
- 9.2.4. Liquid Penetrant Testing
- 9.2.5. Eddy-Current Testing
- 9.2.6. Radiographic Testing
- 9.2.7. Acoustic Emission Testing
- 9.2.8. Other
- 9.1. Market Analysis, Insights and Forecast - by Application
- 10. Asia Pacific Ndt And Inspection Analysis, Insights and Forecast, 2020-2032
- 10.1. Market Analysis, Insights and Forecast - by Application
- 10.1.1. Inspection Services
- 10.1.2. Training Services
- 10.1.3. Equipment Rental Services
- 10.1.4. Calibration services
- 10.2. Market Analysis, Insights and Forecast - by Type
- 10.2.1. Ultrasonic Testing
- 10.2.2. Visual Testing
- 10.2.3. Magnetic Particle Testing
- 10.2.4. Liquid Penetrant Testing
- 10.2.5. Eddy-Current Testing
- 10.2.6. Radiographic Testing
- 10.2.7. Acoustic Emission Testing
- 10.2.8. Other
- 10.1. Market Analysis, Insights and Forecast - by Application
- 11. Competitive Analysis
- 11.1. Global Market Share Analysis 2025
- 11.2. Company Profiles
- 11.2.1 General Electric
- 11.2.1.1. Overview
- 11.2.1.2. Products
- 11.2.1.3. SWOT Analysis
- 11.2.1.4. Recent Developments
- 11.2.1.5. Financials (Based on Availability)
- 11.2.2 Olympus Corporation
- 11.2.2.1. Overview
- 11.2.2.2. Products
- 11.2.2.3. SWOT Analysis
- 11.2.2.4. Recent Developments
- 11.2.2.5. Financials (Based on Availability)
- 11.2.3 MISTRAS Group
- 11.2.3.1. Overview
- 11.2.3.2. Products
- 11.2.3.3. SWOT Analysis
- 11.2.3.4. Recent Developments
- 11.2.3.5. Financials (Based on Availability)
- 11.2.4 Nikon Metrology
- 11.2.4.1. Overview
- 11.2.4.2. Products
- 11.2.4.3. SWOT Analysis
- 11.2.4.4. Recent Developments
- 11.2.4.5. Financials (Based on Availability)
- 11.2.5 Ashtead Technology
- 11.2.5.1. Overview
- 11.2.5.2. Products
- 11.2.5.3. SWOT Analysis
- 11.2.5.4. Recent Developments
- 11.2.5.5. Financials (Based on Availability)
- 11.2.6 YXLON International
- 11.2.6.1. Overview
- 11.2.6.2. Products
- 11.2.6.3. SWOT Analysis
- 11.2.6.4. Recent Developments
- 11.2.6.5. Financials (Based on Availability)
- 11.2.7 Sonatest
- 11.2.7.1. Overview
- 11.2.7.2. Products
- 11.2.7.3. SWOT Analysis
- 11.2.7.4. Recent Developments
- 11.2.7.5. Financials (Based on Availability)
- 11.2.8 Bosello High Technology srl
- 11.2.8.1. Overview
- 11.2.8.2. Products
- 11.2.8.3. SWOT Analysis
- 11.2.8.4. Recent Developments
- 11.2.8.5. Financials (Based on Availability)
- 11.2.9 Eddyfi
- 11.2.9.1. Overview
- 11.2.9.2. Products
- 11.2.9.3. SWOT Analysis
- 11.2.9.4. Recent Developments
- 11.2.9.5. Financials (Based on Availability)
- 11.2.10 Cygnus Instruments
- 11.2.10.1. Overview
- 11.2.10.2. Products
- 11.2.10.3. SWOT Analysis
- 11.2.10.4. Recent Developments
- 11.2.10.5. Financials (Based on Availability)
- 11.2.11 NDT Global GmbH
- 11.2.11.1. Overview
- 11.2.11.2. Products
- 11.2.11.3. SWOT Analysis
- 11.2.11.4. Recent Developments
- 11.2.11.5. Financials (Based on Availability)
- 11.2.1 General Electric
List of Figures
- Figure 1: Global Ndt And Inspection Revenue Breakdown (million, %) by Region 2025 & 2033
- Figure 2: North America Ndt And Inspection Revenue (million), by Application 2025 & 2033
- Figure 3: North America Ndt And Inspection Revenue Share (%), by Application 2025 & 2033
- Figure 4: North America Ndt And Inspection Revenue (million), by Type 2025 & 2033
- Figure 5: North America Ndt And Inspection Revenue Share (%), by Type 2025 & 2033
- Figure 6: North America Ndt And Inspection Revenue (million), by Country 2025 & 2033
- Figure 7: North America Ndt And Inspection Revenue Share (%), by Country 2025 & 2033
- Figure 8: South America Ndt And Inspection Revenue (million), by Application 2025 & 2033
- Figure 9: South America Ndt And Inspection Revenue Share (%), by Application 2025 & 2033
- Figure 10: South America Ndt And Inspection Revenue (million), by Type 2025 & 2033
- Figure 11: South America Ndt And Inspection Revenue Share (%), by Type 2025 & 2033
- Figure 12: South America Ndt And Inspection Revenue (million), by Country 2025 & 2033
- Figure 13: South America Ndt And Inspection Revenue Share (%), by Country 2025 & 2033
- Figure 14: Europe Ndt And Inspection Revenue (million), by Application 2025 & 2033
- Figure 15: Europe Ndt And Inspection Revenue Share (%), by Application 2025 & 2033
- Figure 16: Europe Ndt And Inspection Revenue (million), by Type 2025 & 2033
- Figure 17: Europe Ndt And Inspection Revenue Share (%), by Type 2025 & 2033
- Figure 18: Europe Ndt And Inspection Revenue (million), by Country 2025 & 2033
- Figure 19: Europe Ndt And Inspection Revenue Share (%), by Country 2025 & 2033
- Figure 20: Middle East & Africa Ndt And Inspection Revenue (million), by Application 2025 & 2033
- Figure 21: Middle East & Africa Ndt And Inspection Revenue Share (%), by Application 2025 & 2033
- Figure 22: Middle East & Africa Ndt And Inspection Revenue (million), by Type 2025 & 2033
- Figure 23: Middle East & Africa Ndt And Inspection Revenue Share (%), by Type 2025 & 2033
- Figure 24: Middle East & Africa Ndt And Inspection Revenue (million), by Country 2025 & 2033
- Figure 25: Middle East & Africa Ndt And Inspection Revenue Share (%), by Country 2025 & 2033
- Figure 26: Asia Pacific Ndt And Inspection Revenue (million), by Application 2025 & 2033
- Figure 27: Asia Pacific Ndt And Inspection Revenue Share (%), by Application 2025 & 2033
- Figure 28: Asia Pacific Ndt And Inspection Revenue (million), by Type 2025 & 2033
- Figure 29: Asia Pacific Ndt And Inspection Revenue Share (%), by Type 2025 & 2033
- Figure 30: Asia Pacific Ndt And Inspection Revenue (million), by Country 2025 & 2033
- Figure 31: Asia Pacific Ndt And Inspection Revenue Share (%), by Country 2025 & 2033
List of Tables
- Table 1: Global Ndt And Inspection Revenue million Forecast, by Application 2020 & 2033
- Table 2: Global Ndt And Inspection Revenue million Forecast, by Type 2020 & 2033
- Table 3: Global Ndt And Inspection Revenue million Forecast, by Region 2020 & 2033
- Table 4: Global Ndt And Inspection Revenue million Forecast, by Application 2020 & 2033
- Table 5: Global Ndt And Inspection Revenue million Forecast, by Type 2020 & 2033
- Table 6: Global Ndt And Inspection Revenue million Forecast, by Country 2020 & 2033
- Table 7: United States Ndt And Inspection Revenue (million) Forecast, by Application 2020 & 2033
- Table 8: Canada Ndt And Inspection Revenue (million) Forecast, by Application 2020 & 2033
- Table 9: Mexico Ndt And Inspection Revenue (million) Forecast, by Application 2020 & 2033
- Table 10: Global Ndt And Inspection Revenue million Forecast, by Application 2020 & 2033
- Table 11: Global Ndt And Inspection Revenue million Forecast, by Type 2020 & 2033
- Table 12: Global Ndt And Inspection Revenue million Forecast, by Country 2020 & 2033
- Table 13: Brazil Ndt And Inspection Revenue (million) Forecast, by Application 2020 & 2033
- Table 14: Argentina Ndt And Inspection Revenue (million) Forecast, by Application 2020 & 2033
- Table 15: Rest of South America Ndt And Inspection Revenue (million) Forecast, by Application 2020 & 2033
- Table 16: Global Ndt And Inspection Revenue million Forecast, by Application 2020 & 2033
- Table 17: Global Ndt And Inspection Revenue million Forecast, by Type 2020 & 2033
- Table 18: Global Ndt And Inspection Revenue million Forecast, by Country 2020 & 2033
- Table 19: United Kingdom Ndt And Inspection Revenue (million) Forecast, by Application 2020 & 2033
- Table 20: Germany Ndt And Inspection Revenue (million) Forecast, by Application 2020 & 2033
- Table 21: France Ndt And Inspection Revenue (million) Forecast, by Application 2020 & 2033
- Table 22: Italy Ndt And Inspection Revenue (million) Forecast, by Application 2020 & 2033
- Table 23: Spain Ndt And Inspection Revenue (million) Forecast, by Application 2020 & 2033
- Table 24: Russia Ndt And Inspection Revenue (million) Forecast, by Application 2020 & 2033
- Table 25: Benelux Ndt And Inspection Revenue (million) Forecast, by Application 2020 & 2033
- Table 26: Nordics Ndt And Inspection Revenue (million) Forecast, by Application 2020 & 2033
- Table 27: Rest of Europe Ndt And Inspection Revenue (million) Forecast, by Application 2020 & 2033
- Table 28: Global Ndt And Inspection Revenue million Forecast, by Application 2020 & 2033
- Table 29: Global Ndt And Inspection Revenue million Forecast, by Type 2020 & 2033
- Table 30: Global Ndt And Inspection Revenue million Forecast, by Country 2020 & 2033
- Table 31: Turkey Ndt And Inspection Revenue (million) Forecast, by Application 2020 & 2033
- Table 32: Israel Ndt And Inspection Revenue (million) Forecast, by Application 2020 & 2033
- Table 33: GCC Ndt And Inspection Revenue (million) Forecast, by Application 2020 & 2033
- Table 34: North Africa Ndt And Inspection Revenue (million) Forecast, by Application 2020 & 2033
- Table 35: South Africa Ndt And Inspection Revenue (million) Forecast, by Application 2020 & 2033
- Table 36: Rest of Middle East & Africa Ndt And Inspection Revenue (million) Forecast, by Application 2020 & 2033
- Table 37: Global Ndt And Inspection Revenue million Forecast, by Application 2020 & 2033
- Table 38: Global Ndt And Inspection Revenue million Forecast, by Type 2020 & 2033
- Table 39: Global Ndt And Inspection Revenue million Forecast, by Country 2020 & 2033
- Table 40: China Ndt And Inspection Revenue (million) Forecast, by Application 2020 & 2033
- Table 41: India Ndt And Inspection Revenue (million) Forecast, by Application 2020 & 2033
- Table 42: Japan Ndt And Inspection Revenue (million) Forecast, by Application 2020 & 2033
- Table 43: South Korea Ndt And Inspection Revenue (million) Forecast, by Application 2020 & 2033
- Table 44: ASEAN Ndt And Inspection Revenue (million) Forecast, by Application 2020 & 2033
- Table 45: Oceania Ndt And Inspection Revenue (million) Forecast, by Application 2020 & 2033
- Table 46: Rest of Asia Pacific Ndt And Inspection Revenue (million) Forecast, by Application 2020 & 2033
Frequently Asked Questions
1. What is the projected Compound Annual Growth Rate (CAGR) of the Ndt And Inspection?
The projected CAGR is approximately XXX%.
2. Which companies are prominent players in the Ndt And Inspection?
Key companies in the market include General Electric, Olympus Corporation, MISTRAS Group, Nikon Metrology, Ashtead Technology, YXLON International, Sonatest, Bosello High Technology srl, Eddyfi, Cygnus Instruments, NDT Global GmbH.
3. What are the main segments of the Ndt And Inspection?
The market segments include Application, Type.
4. Can you provide details about the market size?
The market size is estimated to be USD XXX million as of 2022.
5. What are some drivers contributing to market growth?
N/A
6. What are the notable trends driving market growth?
N/A
7. Are there any restraints impacting market growth?
N/A
8. Can you provide examples of recent developments in the market?
N/A
9. What pricing options are available for accessing the report?
Pricing options include single-user, multi-user, and enterprise licenses priced at USD 4250.00, USD 6375.00, and USD 8500.00 respectively.
10. Is the market size provided in terms of value or volume?
The market size is provided in terms of value, measured in million.
11. Are there any specific market keywords associated with the report?
Yes, the market keyword associated with the report is "Ndt And Inspection," which aids in identifying and referencing the specific market segment covered.
12. How do I determine which pricing option suits my needs best?
The pricing options vary based on user requirements and access needs. Individual users may opt for single-user licenses, while businesses requiring broader access may choose multi-user or enterprise licenses for cost-effective access to the report.
13. Are there any additional resources or data provided in the Ndt And Inspection report?
While the report offers comprehensive insights, it's advisable to review the specific contents or supplementary materials provided to ascertain if additional resources or data are available.
14. How can I stay updated on further developments or reports in the Ndt And Inspection?
To stay informed about further developments, trends, and reports in the Ndt And Inspection, consider subscribing to industry newsletters, following relevant companies and organizations, or regularly checking reputable industry news sources and publications.
Methodology
Step 1 - Identification of Relevant Samples Size from Population Database


Step 2 - Approaches for Defining Global Market Size (Value, Volume* & Price*)

Note*: In applicable scenarios
Step 3 - Data Sources
Primary Research
- Web Analytics
- Survey Reports
- Research Institute
- Latest Research Reports
- Opinion Leaders
Secondary Research
- Annual Reports
- White Paper
- Latest Press Release
- Industry Association
- Paid Database
- Investor Presentations

Step 4 - Data Triangulation
Involves using different sources of information in order to increase the validity of a study
These sources are likely to be stakeholders in a program - participants, other researchers, program staff, other community members, and so on.
Then we put all data in single framework & apply various statistical tools to find out the dynamic on the market.
During the analysis stage, feedback from the stakeholder groups would be compared to determine areas of agreement as well as areas of divergence