
Key Insights
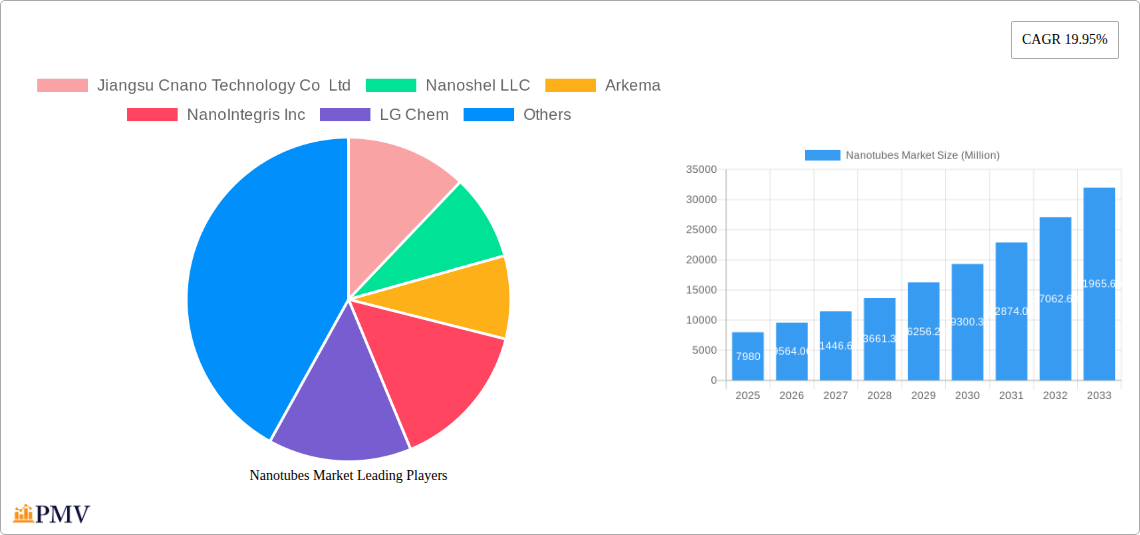
The global nanotubes market, valued at $7.98 billion in 2025, is projected to experience robust growth, driven by a Compound Annual Growth Rate (CAGR) of 19.95% from 2025 to 2033. This expansion is fueled by the increasing adoption of nanotubes across diverse sectors. The surging demand for lightweight yet high-strength materials in the automotive and aerospace industries is a significant driver. Furthermore, the electronics sector's continuous pursuit of miniaturization and enhanced performance is propelling the demand for nanotubes in advanced electronic components like Li-ion batteries, sensors, and semiconductor devices. The burgeoning healthcare industry also contributes substantially, with applications in drug delivery systems, biosensors, and polymeric biomaterials showing significant promise. Technological advancements leading to improved production efficiency and reduced costs further contribute to market expansion. While challenges like scalability and standardization exist, ongoing research and development efforts are actively addressing these hurdles, ensuring sustained market growth.
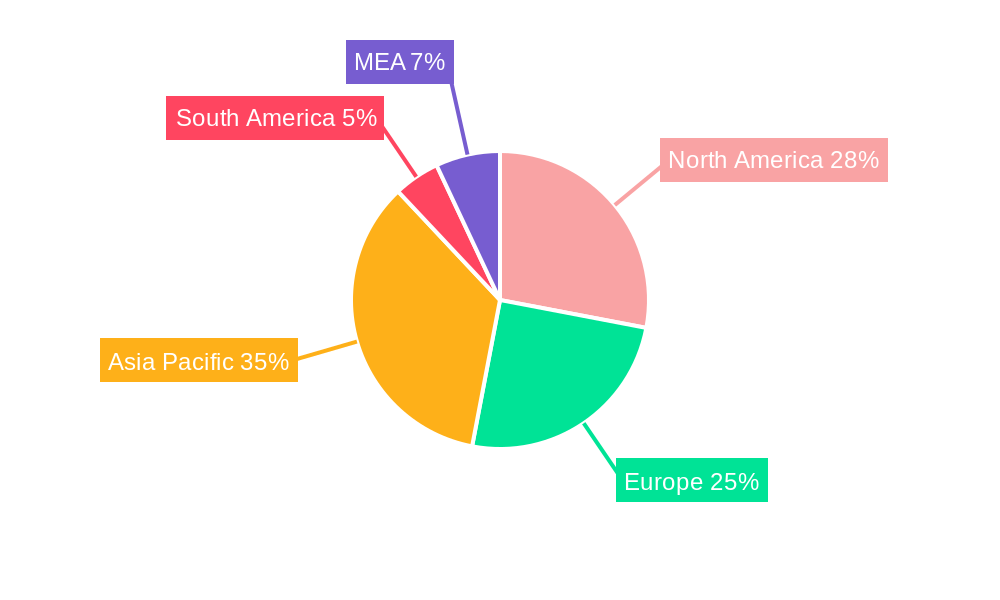
The market segmentation reveals key opportunities. Carbon nanotubes currently dominate the types segment, but silicon and other innovative types are gaining traction, driven by specific application requirements. In terms of structure, both non-polymer organic and polymeric nanomaterials contribute significantly, with their relative market share influenced by the targeted application. The end-user industry analysis highlights the strong influence of electronics, healthcare, and energy sectors, although automotive, aerospace, and textile industries are showing significant growth potential. Geographically, Asia Pacific, particularly China, is expected to lead the market due to significant manufacturing activities and increasing research investments. North America and Europe maintain significant market shares, primarily driven by strong technological advancements and established industries. The competitive landscape is marked by a mix of established players and emerging companies, fostering innovation and competition within the market.
Nanotubes Market: A Comprehensive Report (2019-2033)
This in-depth report provides a comprehensive analysis of the global nanotubes market, covering market size, growth drivers, competitive landscape, and future outlook from 2019 to 2033. The study period spans 2019-2033, with 2025 as the base and estimated year, and the forecast period from 2025-2033. The historical period analyzed is 2019-2024. This report is crucial for businesses, investors, and researchers seeking a detailed understanding of this rapidly evolving market.
Nanotubes Market Market Structure & Competitive Dynamics
The nanotubes market exhibits a moderately consolidated structure with several key players holding significant market share. Market concentration is influenced by factors such as technological advancements, economies of scale, and strategic mergers and acquisitions (M&A). The competitive landscape is characterized by intense innovation, with companies focusing on developing advanced nanotube materials with enhanced properties for various applications. Regulatory frameworks, particularly concerning the safety and environmental impact of nanotubes, play a crucial role in shaping market dynamics. The presence of product substitutes, such as graphene and other nanomaterials, also impacts the competitive landscape. End-user trends, particularly in the electronics, energy, and healthcare sectors, are driving demand for specialized nanotubes with specific properties. Recent M&A activities, such as Birla Carbon’s acquisition of Nanocyl SA, underscore the consolidation trend and highlight the strategic importance of the nanotubes market.
- Market Concentration: Moderately consolidated, with top 10 players holding approximately xx% of the market share in 2025.
- Innovation Ecosystems: Strong emphasis on R&D, collaborations, and partnerships to develop advanced nanotube materials.
- Regulatory Frameworks: Growing regulatory scrutiny concerning environmental and health implications of nanotube production and use.
- Product Substitutes: Competition from graphene and other advanced nanomaterials.
- M&A Activities: Significant M&A activity, indicating a trend towards market consolidation. The Birla Carbon acquisition of Nanocyl SA in October 2023, valued at approximately xx Million, is a prime example. Further M&A activity is expected, with potential deal values reaching xx Million annually over the forecast period.
Nanotubes Market Industry Trends & Insights
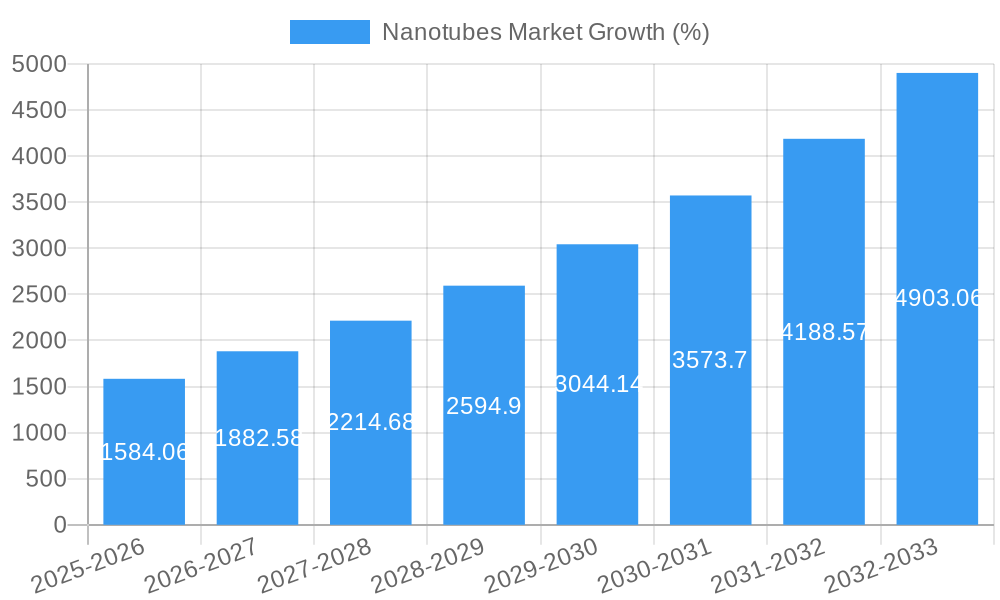
The global nanotubes market is experiencing robust growth, driven by the increasing adoption of nanotubes in various high-growth industries. The market's Compound Annual Growth Rate (CAGR) is projected to be xx% from 2025 to 2033. Technological advancements, such as the development of high-quality, cost-effective nanotube production methods, are fueling market expansion. Consumer preferences for sustainable and high-performance products are also contributing to market growth. The competitive dynamics within the industry are characterized by intense innovation, collaborations, and strategic partnerships. Market penetration is increasing across diverse applications, particularly in the electronics, energy storage, and healthcare sectors. Significant investments in R&D are driving the development of novel nanotube-based materials with improved properties. However, challenges remain, including the high cost of production and potential health and environmental concerns associated with nanotube handling.
Dominant Markets & Segments in Nanotubes Market
The global nanotubes market is segmented by type (Carbon Nanotubes, Silicon Nanotubes, Inorganic Nanotubes, Other Types), structure type (Non-polymer Organic Nanomaterials, Polymeric Nanomaterials), application (Hydrogen Storage Devices, Sensors, Polymeric Biomaterials, Li-ion Batteries, Luminescent Display Devices, Biosensors, Nanoelectrodes, Water Purification Filters, Semiconductor Devices, Conductive Plastics), and end-user industry (Healthcare, Electronics, Energy, Automotive, Aerospace and Defense, Textile, Other End-user Industries).
- Dominant Region/Country: Asia-Pacific is expected to be the dominant region, driven by rapid industrialization and significant investments in advanced materials research. China and Japan are expected to be key contributors.
- Dominant Segment: Carbon Nanotubes constitute the largest segment by type, driven by their superior properties and wider range of applications.
- Key Drivers:
- Electronics: Increasing demand for high-performance electronics components.
- Energy: Growing adoption of nanotubes in energy storage devices (e.g., Li-ion batteries).
- Healthcare: Rising demand for advanced medical devices and drug delivery systems.
Dominance Analysis: The dominance of carbon nanotubes stems from their superior electrical conductivity, high tensile strength, and relatively lower cost compared to other types. The Asia-Pacific region's dominance is fueled by the high concentration of manufacturing activities and strong government support for advanced materials development. Further, the strong growth in the electronics industry in this region is contributing to the demand for carbon nanotubes.
Nanotubes Market Product Innovations
Significant advancements in nanotube production techniques have led to improved quality, reduced costs, and expanded applications. Novel functionalization methods enable tailoring nanotube properties for specific applications. The focus is on creating high-performance, cost-effective nanotubes suitable for various applications, including energy storage, electronics, and biomedical engineering. This translates into stronger competitive advantages for companies that can effectively innovate and deliver tailored solutions to meet specific end-user demands.
Report Segmentation & Scope
This report provides a detailed segmentation of the nanotubes market across various categories:
- Type: Carbon nanotubes are projected to account for xx Million of market value by 2033, with significant growth expected in silicon and inorganic nanotubes as well.
- Structure Type: Non-polymer organic nanomaterials currently dominate, but polymeric nanomaterials are showing high growth potential.
- Application: Li-ion batteries, sensors, and conductive plastics are major application segments with considerable growth potential for other applications.
- End-user Industry: The electronics sector is a major contributor, followed by energy and healthcare.
Each segment's analysis includes growth projections, market sizes, and an assessment of competitive dynamics.
Key Drivers of Nanotubes Market Growth
The nanotubes market's growth is driven by several factors: increasing demand for lightweight, high-strength materials in various industries; advancements in nanotube production technologies resulting in lower costs and improved quality; rising demand for energy-efficient and environmentally friendly solutions; growing investments in research and development, particularly in the areas of nanoelectronics and energy storage; supportive government policies and initiatives to promote the development and adoption of advanced nanomaterials.
Challenges in the Nanotubes Market Sector
Despite significant potential, the nanotubes market faces challenges including high production costs, potential health and environmental concerns, the need for consistent quality control, difficulties in scaling up production to meet increasing demand, and strong competition from alternative materials like graphene. These factors can limit market penetration and affect overall growth trajectory. The xx Million projected investment required for improving production scalability reflects the magnitude of this challenge.
Leading Players in the Nanotubes Market Market
- Jiangsu Cnano Technology Co Ltd
- Nanoshel LLC
- Arkema
- NanoIntegris Inc
- LG Chem
- Cheap Tubes
- Carbon Solutions Inc
- Hyperion Catalysis International
- Resonac Holdings Corporation
- Nano-C
- Thomas Swan & Co Ltd
- Nanocyl SA (Birla Carbon)
Key Developments in Nanotubes Market Sector
- October 2023: Birla Carbon (Aditya Birla Group) acquired Nanocyl SA, strengthening its position in the lithium-ion battery materials market. This acquisition is expected to significantly boost Birla Carbon's nanotubes business segment.
- May 2023: LG Chem commenced construction of its fourth carbon nanotube (CNT) plant, slated for operation in 2025. This expansion will double LG Chem’s annual CNT production capacity to 6,100 tons.
Strategic Nanotubes Market Market Outlook
The nanotubes market presents significant growth opportunities, particularly in the areas of energy storage, electronics, and healthcare. Strategic investments in R&D, coupled with technological advancements, will be crucial for driving market expansion. The focus on developing sustainable and cost-effective production methods, along with addressing concerns regarding environmental impact, will be essential for unlocking the full potential of the nanotubes market. Further consolidation through M&A activity is expected, shaping the competitive landscape and accelerating innovation.
Nanotubes Market Segmentation
-
1. Type
- 1.1. Carbon Nanotubes
- 1.2. Silicon Nanotubes
- 1.3. Inorganic Nanotubes
- 1.4. Other Types (Membrane Nanotubes, Etc.)
-
2. Structure Type
- 2.1. Non-polymer Organic Nanomaterials
- 2.2. Polymeric Nanomaterials
-
3. Application
- 3.1. Hydrogen Storage Devices
- 3.2. Sensors
- 3.3. Polymeric Biomaterials
- 3.4. Li-ion Batteries
- 3.5. Luminescent Display Devices
- 3.6. Biosensors
- 3.7. Nanoelectrodes
- 3.8. Water Purification Filters
- 3.9. Semiconductor Devices
- 3.10. Conductive Plastics
-
4. End-user Industry
- 4.1. Healthcare
- 4.2. Electronics
- 4.3. Energy
- 4.4. Automotive
- 4.5. Aerospace and Defense
- 4.6. Textile
- 4.7. Other En
Nanotubes Market Segmentation By Geography
-
1. Asia Pacific
- 1.1. China
- 1.2. India
- 1.3. Japan
- 1.4. South Korea
- 1.5. Rest of Asia Pacific
-
2. North America
- 2.1. United States
- 2.2. Canada
- 2.3. Mexico
-
3. Europe
- 3.1. Germany
- 3.2. United Kingdom
- 3.3. France
- 3.4. Italy
- 3.5. Rest of Europe
-
4. South America
- 4.1. Brazil
- 4.2. Argentina
- 4.3. Rest of South America
-
5. Middle East and Africa
- 5.1. Saudi Arabia
- 5.2. South Africa
- 5.3. Rest of Middle East and Africa
Nanotubes Market REPORT HIGHLIGHTS
| Aspects | Details |
|---|---|
| Study Period | 2019-2033 |
| Base Year | 2024 |
| Estimated Year | 2025 |
| Forecast Period | 2025-2033 |
| Historical Period | 2019-2024 |
| Growth Rate | CAGR of 19.95% from 2019-2033 |
| Segmentation |
|
Table of Contents
- 1. Introduction
- 1.1. Research Scope
- 1.2. Market Segmentation
- 1.3. Research Methodology
- 1.4. Definitions and Assumptions
- 2. Executive Summary
- 2.1. Introduction
- 3. Market Dynamics
- 3.1. Introduction
- 3.2. Market Drivers
- 3.2.1. Advancement in Nanotubes Technologies; Growing Adoption of Carbon Nanotubes; Other Drivers
- 3.3. Market Restrains
- 3.3.1. High Manufacturing and R&D Cost; Other Restraints
- 3.4. Market Trends
- 3.4.1. Electronics and Semiconductor Segment to Dominate the Market Demand
- 4. Market Factor Analysis
- 4.1. Porters Five Forces
- 4.2. Supply/Value Chain
- 4.3. PESTEL analysis
- 4.4. Market Entropy
- 4.5. Patent/Trademark Analysis
- 5. Global Nanotubes Market Analysis, Insights and Forecast, 2019-2031
- 5.1. Market Analysis, Insights and Forecast - by Type
- 5.1.1. Carbon Nanotubes
- 5.1.2. Silicon Nanotubes
- 5.1.3. Inorganic Nanotubes
- 5.1.4. Other Types (Membrane Nanotubes, Etc.)
- 5.2. Market Analysis, Insights and Forecast - by Structure Type
- 5.2.1. Non-polymer Organic Nanomaterials
- 5.2.2. Polymeric Nanomaterials
- 5.3. Market Analysis, Insights and Forecast - by Application
- 5.3.1. Hydrogen Storage Devices
- 5.3.2. Sensors
- 5.3.3. Polymeric Biomaterials
- 5.3.4. Li-ion Batteries
- 5.3.5. Luminescent Display Devices
- 5.3.6. Biosensors
- 5.3.7. Nanoelectrodes
- 5.3.8. Water Purification Filters
- 5.3.9. Semiconductor Devices
- 5.3.10. Conductive Plastics
- 5.4. Market Analysis, Insights and Forecast - by End-user Industry
- 5.4.1. Healthcare
- 5.4.2. Electronics
- 5.4.3. Energy
- 5.4.4. Automotive
- 5.4.5. Aerospace and Defense
- 5.4.6. Textile
- 5.4.7. Other En
- 5.5. Market Analysis, Insights and Forecast - by Region
- 5.5.1. Asia Pacific
- 5.5.2. North America
- 5.5.3. Europe
- 5.5.4. South America
- 5.5.5. Middle East and Africa
- 5.1. Market Analysis, Insights and Forecast - by Type
- 6. Asia Pacific Nanotubes Market Analysis, Insights and Forecast, 2019-2031
- 6.1. Market Analysis, Insights and Forecast - by Type
- 6.1.1. Carbon Nanotubes
- 6.1.2. Silicon Nanotubes
- 6.1.3. Inorganic Nanotubes
- 6.1.4. Other Types (Membrane Nanotubes, Etc.)
- 6.2. Market Analysis, Insights and Forecast - by Structure Type
- 6.2.1. Non-polymer Organic Nanomaterials
- 6.2.2. Polymeric Nanomaterials
- 6.3. Market Analysis, Insights and Forecast - by Application
- 6.3.1. Hydrogen Storage Devices
- 6.3.2. Sensors
- 6.3.3. Polymeric Biomaterials
- 6.3.4. Li-ion Batteries
- 6.3.5. Luminescent Display Devices
- 6.3.6. Biosensors
- 6.3.7. Nanoelectrodes
- 6.3.8. Water Purification Filters
- 6.3.9. Semiconductor Devices
- 6.3.10. Conductive Plastics
- 6.4. Market Analysis, Insights and Forecast - by End-user Industry
- 6.4.1. Healthcare
- 6.4.2. Electronics
- 6.4.3. Energy
- 6.4.4. Automotive
- 6.4.5. Aerospace and Defense
- 6.4.6. Textile
- 6.4.7. Other En
- 6.1. Market Analysis, Insights and Forecast - by Type
- 7. North America Nanotubes Market Analysis, Insights and Forecast, 2019-2031
- 7.1. Market Analysis, Insights and Forecast - by Type
- 7.1.1. Carbon Nanotubes
- 7.1.2. Silicon Nanotubes
- 7.1.3. Inorganic Nanotubes
- 7.1.4. Other Types (Membrane Nanotubes, Etc.)
- 7.2. Market Analysis, Insights and Forecast - by Structure Type
- 7.2.1. Non-polymer Organic Nanomaterials
- 7.2.2. Polymeric Nanomaterials
- 7.3. Market Analysis, Insights and Forecast - by Application
- 7.3.1. Hydrogen Storage Devices
- 7.3.2. Sensors
- 7.3.3. Polymeric Biomaterials
- 7.3.4. Li-ion Batteries
- 7.3.5. Luminescent Display Devices
- 7.3.6. Biosensors
- 7.3.7. Nanoelectrodes
- 7.3.8. Water Purification Filters
- 7.3.9. Semiconductor Devices
- 7.3.10. Conductive Plastics
- 7.4. Market Analysis, Insights and Forecast - by End-user Industry
- 7.4.1. Healthcare
- 7.4.2. Electronics
- 7.4.3. Energy
- 7.4.4. Automotive
- 7.4.5. Aerospace and Defense
- 7.4.6. Textile
- 7.4.7. Other En
- 7.1. Market Analysis, Insights and Forecast - by Type
- 8. Europe Nanotubes Market Analysis, Insights and Forecast, 2019-2031
- 8.1. Market Analysis, Insights and Forecast - by Type
- 8.1.1. Carbon Nanotubes
- 8.1.2. Silicon Nanotubes
- 8.1.3. Inorganic Nanotubes
- 8.1.4. Other Types (Membrane Nanotubes, Etc.)
- 8.2. Market Analysis, Insights and Forecast - by Structure Type
- 8.2.1. Non-polymer Organic Nanomaterials
- 8.2.2. Polymeric Nanomaterials
- 8.3. Market Analysis, Insights and Forecast - by Application
- 8.3.1. Hydrogen Storage Devices
- 8.3.2. Sensors
- 8.3.3. Polymeric Biomaterials
- 8.3.4. Li-ion Batteries
- 8.3.5. Luminescent Display Devices
- 8.3.6. Biosensors
- 8.3.7. Nanoelectrodes
- 8.3.8. Water Purification Filters
- 8.3.9. Semiconductor Devices
- 8.3.10. Conductive Plastics
- 8.4. Market Analysis, Insights and Forecast - by End-user Industry
- 8.4.1. Healthcare
- 8.4.2. Electronics
- 8.4.3. Energy
- 8.4.4. Automotive
- 8.4.5. Aerospace and Defense
- 8.4.6. Textile
- 8.4.7. Other En
- 8.1. Market Analysis, Insights and Forecast - by Type
- 9. South America Nanotubes Market Analysis, Insights and Forecast, 2019-2031
- 9.1. Market Analysis, Insights and Forecast - by Type
- 9.1.1. Carbon Nanotubes
- 9.1.2. Silicon Nanotubes
- 9.1.3. Inorganic Nanotubes
- 9.1.4. Other Types (Membrane Nanotubes, Etc.)
- 9.2. Market Analysis, Insights and Forecast - by Structure Type
- 9.2.1. Non-polymer Organic Nanomaterials
- 9.2.2. Polymeric Nanomaterials
- 9.3. Market Analysis, Insights and Forecast - by Application
- 9.3.1. Hydrogen Storage Devices
- 9.3.2. Sensors
- 9.3.3. Polymeric Biomaterials
- 9.3.4. Li-ion Batteries
- 9.3.5. Luminescent Display Devices
- 9.3.6. Biosensors
- 9.3.7. Nanoelectrodes
- 9.3.8. Water Purification Filters
- 9.3.9. Semiconductor Devices
- 9.3.10. Conductive Plastics
- 9.4. Market Analysis, Insights and Forecast - by End-user Industry
- 9.4.1. Healthcare
- 9.4.2. Electronics
- 9.4.3. Energy
- 9.4.4. Automotive
- 9.4.5. Aerospace and Defense
- 9.4.6. Textile
- 9.4.7. Other En
- 9.1. Market Analysis, Insights and Forecast - by Type
- 10. Middle East and Africa Nanotubes Market Analysis, Insights and Forecast, 2019-2031
- 10.1. Market Analysis, Insights and Forecast - by Type
- 10.1.1. Carbon Nanotubes
- 10.1.2. Silicon Nanotubes
- 10.1.3. Inorganic Nanotubes
- 10.1.4. Other Types (Membrane Nanotubes, Etc.)
- 10.2. Market Analysis, Insights and Forecast - by Structure Type
- 10.2.1. Non-polymer Organic Nanomaterials
- 10.2.2. Polymeric Nanomaterials
- 10.3. Market Analysis, Insights and Forecast - by Application
- 10.3.1. Hydrogen Storage Devices
- 10.3.2. Sensors
- 10.3.3. Polymeric Biomaterials
- 10.3.4. Li-ion Batteries
- 10.3.5. Luminescent Display Devices
- 10.3.6. Biosensors
- 10.3.7. Nanoelectrodes
- 10.3.8. Water Purification Filters
- 10.3.9. Semiconductor Devices
- 10.3.10. Conductive Plastics
- 10.4. Market Analysis, Insights and Forecast - by End-user Industry
- 10.4.1. Healthcare
- 10.4.2. Electronics
- 10.4.3. Energy
- 10.4.4. Automotive
- 10.4.5. Aerospace and Defense
- 10.4.6. Textile
- 10.4.7. Other En
- 10.1. Market Analysis, Insights and Forecast - by Type
- 11. North America Nanotubes Market Analysis, Insights and Forecast, 2019-2031
- 11.1. Market Analysis, Insights and Forecast - By Country/Sub-region
- 11.1.1 United States
- 11.1.2 Canada
- 11.1.3 Mexico
- 12. Europe Nanotubes Market Analysis, Insights and Forecast, 2019-2031
- 12.1. Market Analysis, Insights and Forecast - By Country/Sub-region
- 12.1.1 Germany
- 12.1.2 France
- 12.1.3 Italy
- 12.1.4 United Kingdom
- 12.1.5 Netherlands
- 12.1.6 Rest of Europe
- 13. Asia Pacific Nanotubes Market Analysis, Insights and Forecast, 2019-2031
- 13.1. Market Analysis, Insights and Forecast - By Country/Sub-region
- 13.1.1 China
- 13.1.2 Japan
- 13.1.3 India
- 13.1.4 South Korea
- 13.1.5 Taiwan
- 13.1.6 Australia
- 13.1.7 Rest of Asia-Pacific
- 14. South America Nanotubes Market Analysis, Insights and Forecast, 2019-2031
- 14.1. Market Analysis, Insights and Forecast - By Country/Sub-region
- 14.1.1 Brazil
- 14.1.2 Argentina
- 14.1.3 Rest of South America
- 15. MEA Nanotubes Market Analysis, Insights and Forecast, 2019-2031
- 15.1. Market Analysis, Insights and Forecast - By Country/Sub-region
- 15.1.1 Middle East
- 15.1.2 Africa
- 16. Competitive Analysis
- 16.1. Global Market Share Analysis 2024
- 16.2. Company Profiles
- 16.2.1 Jiangsu Cnano Technology Co Ltd
- 16.2.1.1. Overview
- 16.2.1.2. Products
- 16.2.1.3. SWOT Analysis
- 16.2.1.4. Recent Developments
- 16.2.1.5. Financials (Based on Availability)
- 16.2.2 Nanoshel LLC
- 16.2.2.1. Overview
- 16.2.2.2. Products
- 16.2.2.3. SWOT Analysis
- 16.2.2.4. Recent Developments
- 16.2.2.5. Financials (Based on Availability)
- 16.2.3 Arkema
- 16.2.3.1. Overview
- 16.2.3.2. Products
- 16.2.3.3. SWOT Analysis
- 16.2.3.4. Recent Developments
- 16.2.3.5. Financials (Based on Availability)
- 16.2.4 NanoIntegris Inc
- 16.2.4.1. Overview
- 16.2.4.2. Products
- 16.2.4.3. SWOT Analysis
- 16.2.4.4. Recent Developments
- 16.2.4.5. Financials (Based on Availability)
- 16.2.5 LG Chem
- 16.2.5.1. Overview
- 16.2.5.2. Products
- 16.2.5.3. SWOT Analysis
- 16.2.5.4. Recent Developments
- 16.2.5.5. Financials (Based on Availability)
- 16.2.6 Cheap Tubes
- 16.2.6.1. Overview
- 16.2.6.2. Products
- 16.2.6.3. SWOT Analysis
- 16.2.6.4. Recent Developments
- 16.2.6.5. Financials (Based on Availability)
- 16.2.7 Carbon Solutions Inc
- 16.2.7.1. Overview
- 16.2.7.2. Products
- 16.2.7.3. SWOT Analysis
- 16.2.7.4. Recent Developments
- 16.2.7.5. Financials (Based on Availability)
- 16.2.8 Hyperion Catalysis International
- 16.2.8.1. Overview
- 16.2.8.2. Products
- 16.2.8.3. SWOT Analysis
- 16.2.8.4. Recent Developments
- 16.2.8.5. Financials (Based on Availability)
- 16.2.9 Resonac Holdings Corporation
- 16.2.9.1. Overview
- 16.2.9.2. Products
- 16.2.9.3. SWOT Analysis
- 16.2.9.4. Recent Developments
- 16.2.9.5. Financials (Based on Availability)
- 16.2.10 Nano-C
- 16.2.10.1. Overview
- 16.2.10.2. Products
- 16.2.10.3. SWOT Analysis
- 16.2.10.4. Recent Developments
- 16.2.10.5. Financials (Based on Availability)
- 16.2.11 Thomas Swan & Co Ltd
- 16.2.11.1. Overview
- 16.2.11.2. Products
- 16.2.11.3. SWOT Analysis
- 16.2.11.4. Recent Developments
- 16.2.11.5. Financials (Based on Availability)
- 16.2.12 Nanocyl SA (Birla Carbon)
- 16.2.12.1. Overview
- 16.2.12.2. Products
- 16.2.12.3. SWOT Analysis
- 16.2.12.4. Recent Developments
- 16.2.12.5. Financials (Based on Availability)
- 16.2.1 Jiangsu Cnano Technology Co Ltd
List of Figures
- Figure 1: Global Nanotubes Market Revenue Breakdown (Million, %) by Region 2024 & 2032
- Figure 2: Global Nanotubes Market Volume Breakdown (K Tons, %) by Region 2024 & 2032
- Figure 3: North America Nanotubes Market Revenue (Million), by Country 2024 & 2032
- Figure 4: North America Nanotubes Market Volume (K Tons), by Country 2024 & 2032
- Figure 5: North America Nanotubes Market Revenue Share (%), by Country 2024 & 2032
- Figure 6: North America Nanotubes Market Volume Share (%), by Country 2024 & 2032
- Figure 7: Europe Nanotubes Market Revenue (Million), by Country 2024 & 2032
- Figure 8: Europe Nanotubes Market Volume (K Tons), by Country 2024 & 2032
- Figure 9: Europe Nanotubes Market Revenue Share (%), by Country 2024 & 2032
- Figure 10: Europe Nanotubes Market Volume Share (%), by Country 2024 & 2032
- Figure 11: Asia Pacific Nanotubes Market Revenue (Million), by Country 2024 & 2032
- Figure 12: Asia Pacific Nanotubes Market Volume (K Tons), by Country 2024 & 2032
- Figure 13: Asia Pacific Nanotubes Market Revenue Share (%), by Country 2024 & 2032
- Figure 14: Asia Pacific Nanotubes Market Volume Share (%), by Country 2024 & 2032
- Figure 15: South America Nanotubes Market Revenue (Million), by Country 2024 & 2032
- Figure 16: South America Nanotubes Market Volume (K Tons), by Country 2024 & 2032
- Figure 17: South America Nanotubes Market Revenue Share (%), by Country 2024 & 2032
- Figure 18: South America Nanotubes Market Volume Share (%), by Country 2024 & 2032
- Figure 19: MEA Nanotubes Market Revenue (Million), by Country 2024 & 2032
- Figure 20: MEA Nanotubes Market Volume (K Tons), by Country 2024 & 2032
- Figure 21: MEA Nanotubes Market Revenue Share (%), by Country 2024 & 2032
- Figure 22: MEA Nanotubes Market Volume Share (%), by Country 2024 & 2032
- Figure 23: Asia Pacific Nanotubes Market Revenue (Million), by Type 2024 & 2032
- Figure 24: Asia Pacific Nanotubes Market Volume (K Tons), by Type 2024 & 2032
- Figure 25: Asia Pacific Nanotubes Market Revenue Share (%), by Type 2024 & 2032
- Figure 26: Asia Pacific Nanotubes Market Volume Share (%), by Type 2024 & 2032
- Figure 27: Asia Pacific Nanotubes Market Revenue (Million), by Structure Type 2024 & 2032
- Figure 28: Asia Pacific Nanotubes Market Volume (K Tons), by Structure Type 2024 & 2032
- Figure 29: Asia Pacific Nanotubes Market Revenue Share (%), by Structure Type 2024 & 2032
- Figure 30: Asia Pacific Nanotubes Market Volume Share (%), by Structure Type 2024 & 2032
- Figure 31: Asia Pacific Nanotubes Market Revenue (Million), by Application 2024 & 2032
- Figure 32: Asia Pacific Nanotubes Market Volume (K Tons), by Application 2024 & 2032
- Figure 33: Asia Pacific Nanotubes Market Revenue Share (%), by Application 2024 & 2032
- Figure 34: Asia Pacific Nanotubes Market Volume Share (%), by Application 2024 & 2032
- Figure 35: Asia Pacific Nanotubes Market Revenue (Million), by End-user Industry 2024 & 2032
- Figure 36: Asia Pacific Nanotubes Market Volume (K Tons), by End-user Industry 2024 & 2032
- Figure 37: Asia Pacific Nanotubes Market Revenue Share (%), by End-user Industry 2024 & 2032
- Figure 38: Asia Pacific Nanotubes Market Volume Share (%), by End-user Industry 2024 & 2032
- Figure 39: Asia Pacific Nanotubes Market Revenue (Million), by Country 2024 & 2032
- Figure 40: Asia Pacific Nanotubes Market Volume (K Tons), by Country 2024 & 2032
- Figure 41: Asia Pacific Nanotubes Market Revenue Share (%), by Country 2024 & 2032
- Figure 42: Asia Pacific Nanotubes Market Volume Share (%), by Country 2024 & 2032
- Figure 43: North America Nanotubes Market Revenue (Million), by Type 2024 & 2032
- Figure 44: North America Nanotubes Market Volume (K Tons), by Type 2024 & 2032
- Figure 45: North America Nanotubes Market Revenue Share (%), by Type 2024 & 2032
- Figure 46: North America Nanotubes Market Volume Share (%), by Type 2024 & 2032
- Figure 47: North America Nanotubes Market Revenue (Million), by Structure Type 2024 & 2032
- Figure 48: North America Nanotubes Market Volume (K Tons), by Structure Type 2024 & 2032
- Figure 49: North America Nanotubes Market Revenue Share (%), by Structure Type 2024 & 2032
- Figure 50: North America Nanotubes Market Volume Share (%), by Structure Type 2024 & 2032
- Figure 51: North America Nanotubes Market Revenue (Million), by Application 2024 & 2032
- Figure 52: North America Nanotubes Market Volume (K Tons), by Application 2024 & 2032
- Figure 53: North America Nanotubes Market Revenue Share (%), by Application 2024 & 2032
- Figure 54: North America Nanotubes Market Volume Share (%), by Application 2024 & 2032
- Figure 55: North America Nanotubes Market Revenue (Million), by End-user Industry 2024 & 2032
- Figure 56: North America Nanotubes Market Volume (K Tons), by End-user Industry 2024 & 2032
- Figure 57: North America Nanotubes Market Revenue Share (%), by End-user Industry 2024 & 2032
- Figure 58: North America Nanotubes Market Volume Share (%), by End-user Industry 2024 & 2032
- Figure 59: North America Nanotubes Market Revenue (Million), by Country 2024 & 2032
- Figure 60: North America Nanotubes Market Volume (K Tons), by Country 2024 & 2032
- Figure 61: North America Nanotubes Market Revenue Share (%), by Country 2024 & 2032
- Figure 62: North America Nanotubes Market Volume Share (%), by Country 2024 & 2032
- Figure 63: Europe Nanotubes Market Revenue (Million), by Type 2024 & 2032
- Figure 64: Europe Nanotubes Market Volume (K Tons), by Type 2024 & 2032
- Figure 65: Europe Nanotubes Market Revenue Share (%), by Type 2024 & 2032
- Figure 66: Europe Nanotubes Market Volume Share (%), by Type 2024 & 2032
- Figure 67: Europe Nanotubes Market Revenue (Million), by Structure Type 2024 & 2032
- Figure 68: Europe Nanotubes Market Volume (K Tons), by Structure Type 2024 & 2032
- Figure 69: Europe Nanotubes Market Revenue Share (%), by Structure Type 2024 & 2032
- Figure 70: Europe Nanotubes Market Volume Share (%), by Structure Type 2024 & 2032
- Figure 71: Europe Nanotubes Market Revenue (Million), by Application 2024 & 2032
- Figure 72: Europe Nanotubes Market Volume (K Tons), by Application 2024 & 2032
- Figure 73: Europe Nanotubes Market Revenue Share (%), by Application 2024 & 2032
- Figure 74: Europe Nanotubes Market Volume Share (%), by Application 2024 & 2032
- Figure 75: Europe Nanotubes Market Revenue (Million), by End-user Industry 2024 & 2032
- Figure 76: Europe Nanotubes Market Volume (K Tons), by End-user Industry 2024 & 2032
- Figure 77: Europe Nanotubes Market Revenue Share (%), by End-user Industry 2024 & 2032
- Figure 78: Europe Nanotubes Market Volume Share (%), by End-user Industry 2024 & 2032
- Figure 79: Europe Nanotubes Market Revenue (Million), by Country 2024 & 2032
- Figure 80: Europe Nanotubes Market Volume (K Tons), by Country 2024 & 2032
- Figure 81: Europe Nanotubes Market Revenue Share (%), by Country 2024 & 2032
- Figure 82: Europe Nanotubes Market Volume Share (%), by Country 2024 & 2032
- Figure 83: South America Nanotubes Market Revenue (Million), by Type 2024 & 2032
- Figure 84: South America Nanotubes Market Volume (K Tons), by Type 2024 & 2032
- Figure 85: South America Nanotubes Market Revenue Share (%), by Type 2024 & 2032
- Figure 86: South America Nanotubes Market Volume Share (%), by Type 2024 & 2032
- Figure 87: South America Nanotubes Market Revenue (Million), by Structure Type 2024 & 2032
- Figure 88: South America Nanotubes Market Volume (K Tons), by Structure Type 2024 & 2032
- Figure 89: South America Nanotubes Market Revenue Share (%), by Structure Type 2024 & 2032
- Figure 90: South America Nanotubes Market Volume Share (%), by Structure Type 2024 & 2032
- Figure 91: South America Nanotubes Market Revenue (Million), by Application 2024 & 2032
- Figure 92: South America Nanotubes Market Volume (K Tons), by Application 2024 & 2032
- Figure 93: South America Nanotubes Market Revenue Share (%), by Application 2024 & 2032
- Figure 94: South America Nanotubes Market Volume Share (%), by Application 2024 & 2032
- Figure 95: South America Nanotubes Market Revenue (Million), by End-user Industry 2024 & 2032
- Figure 96: South America Nanotubes Market Volume (K Tons), by End-user Industry 2024 & 2032
- Figure 97: South America Nanotubes Market Revenue Share (%), by End-user Industry 2024 & 2032
- Figure 98: South America Nanotubes Market Volume Share (%), by End-user Industry 2024 & 2032
- Figure 99: South America Nanotubes Market Revenue (Million), by Country 2024 & 2032
- Figure 100: South America Nanotubes Market Volume (K Tons), by Country 2024 & 2032
- Figure 101: South America Nanotubes Market Revenue Share (%), by Country 2024 & 2032
- Figure 102: South America Nanotubes Market Volume Share (%), by Country 2024 & 2032
- Figure 103: Middle East and Africa Nanotubes Market Revenue (Million), by Type 2024 & 2032
- Figure 104: Middle East and Africa Nanotubes Market Volume (K Tons), by Type 2024 & 2032
- Figure 105: Middle East and Africa Nanotubes Market Revenue Share (%), by Type 2024 & 2032
- Figure 106: Middle East and Africa Nanotubes Market Volume Share (%), by Type 2024 & 2032
- Figure 107: Middle East and Africa Nanotubes Market Revenue (Million), by Structure Type 2024 & 2032
- Figure 108: Middle East and Africa Nanotubes Market Volume (K Tons), by Structure Type 2024 & 2032
- Figure 109: Middle East and Africa Nanotubes Market Revenue Share (%), by Structure Type 2024 & 2032
- Figure 110: Middle East and Africa Nanotubes Market Volume Share (%), by Structure Type 2024 & 2032
- Figure 111: Middle East and Africa Nanotubes Market Revenue (Million), by Application 2024 & 2032
- Figure 112: Middle East and Africa Nanotubes Market Volume (K Tons), by Application 2024 & 2032
- Figure 113: Middle East and Africa Nanotubes Market Revenue Share (%), by Application 2024 & 2032
- Figure 114: Middle East and Africa Nanotubes Market Volume Share (%), by Application 2024 & 2032
- Figure 115: Middle East and Africa Nanotubes Market Revenue (Million), by End-user Industry 2024 & 2032
- Figure 116: Middle East and Africa Nanotubes Market Volume (K Tons), by End-user Industry 2024 & 2032
- Figure 117: Middle East and Africa Nanotubes Market Revenue Share (%), by End-user Industry 2024 & 2032
- Figure 118: Middle East and Africa Nanotubes Market Volume Share (%), by End-user Industry 2024 & 2032
- Figure 119: Middle East and Africa Nanotubes Market Revenue (Million), by Country 2024 & 2032
- Figure 120: Middle East and Africa Nanotubes Market Volume (K Tons), by Country 2024 & 2032
- Figure 121: Middle East and Africa Nanotubes Market Revenue Share (%), by Country 2024 & 2032
- Figure 122: Middle East and Africa Nanotubes Market Volume Share (%), by Country 2024 & 2032
List of Tables
- Table 1: Global Nanotubes Market Revenue Million Forecast, by Region 2019 & 2032
- Table 2: Global Nanotubes Market Volume K Tons Forecast, by Region 2019 & 2032
- Table 3: Global Nanotubes Market Revenue Million Forecast, by Type 2019 & 2032
- Table 4: Global Nanotubes Market Volume K Tons Forecast, by Type 2019 & 2032
- Table 5: Global Nanotubes Market Revenue Million Forecast, by Structure Type 2019 & 2032
- Table 6: Global Nanotubes Market Volume K Tons Forecast, by Structure Type 2019 & 2032
- Table 7: Global Nanotubes Market Revenue Million Forecast, by Application 2019 & 2032
- Table 8: Global Nanotubes Market Volume K Tons Forecast, by Application 2019 & 2032
- Table 9: Global Nanotubes Market Revenue Million Forecast, by End-user Industry 2019 & 2032
- Table 10: Global Nanotubes Market Volume K Tons Forecast, by End-user Industry 2019 & 2032
- Table 11: Global Nanotubes Market Revenue Million Forecast, by Region 2019 & 2032
- Table 12: Global Nanotubes Market Volume K Tons Forecast, by Region 2019 & 2032
- Table 13: Global Nanotubes Market Revenue Million Forecast, by Country 2019 & 2032
- Table 14: Global Nanotubes Market Volume K Tons Forecast, by Country 2019 & 2032
- Table 15: United States Nanotubes Market Revenue (Million) Forecast, by Application 2019 & 2032
- Table 16: United States Nanotubes Market Volume (K Tons) Forecast, by Application 2019 & 2032
- Table 17: Canada Nanotubes Market Revenue (Million) Forecast, by Application 2019 & 2032
- Table 18: Canada Nanotubes Market Volume (K Tons) Forecast, by Application 2019 & 2032
- Table 19: Mexico Nanotubes Market Revenue (Million) Forecast, by Application 2019 & 2032
- Table 20: Mexico Nanotubes Market Volume (K Tons) Forecast, by Application 2019 & 2032
- Table 21: Global Nanotubes Market Revenue Million Forecast, by Country 2019 & 2032
- Table 22: Global Nanotubes Market Volume K Tons Forecast, by Country 2019 & 2032
- Table 23: Germany Nanotubes Market Revenue (Million) Forecast, by Application 2019 & 2032
- Table 24: Germany Nanotubes Market Volume (K Tons) Forecast, by Application 2019 & 2032
- Table 25: France Nanotubes Market Revenue (Million) Forecast, by Application 2019 & 2032
- Table 26: France Nanotubes Market Volume (K Tons) Forecast, by Application 2019 & 2032
- Table 27: Italy Nanotubes Market Revenue (Million) Forecast, by Application 2019 & 2032
- Table 28: Italy Nanotubes Market Volume (K Tons) Forecast, by Application 2019 & 2032
- Table 29: United Kingdom Nanotubes Market Revenue (Million) Forecast, by Application 2019 & 2032
- Table 30: United Kingdom Nanotubes Market Volume (K Tons) Forecast, by Application 2019 & 2032
- Table 31: Netherlands Nanotubes Market Revenue (Million) Forecast, by Application 2019 & 2032
- Table 32: Netherlands Nanotubes Market Volume (K Tons) Forecast, by Application 2019 & 2032
- Table 33: Rest of Europe Nanotubes Market Revenue (Million) Forecast, by Application 2019 & 2032
- Table 34: Rest of Europe Nanotubes Market Volume (K Tons) Forecast, by Application 2019 & 2032
- Table 35: Global Nanotubes Market Revenue Million Forecast, by Country 2019 & 2032
- Table 36: Global Nanotubes Market Volume K Tons Forecast, by Country 2019 & 2032
- Table 37: China Nanotubes Market Revenue (Million) Forecast, by Application 2019 & 2032
- Table 38: China Nanotubes Market Volume (K Tons) Forecast, by Application 2019 & 2032
- Table 39: Japan Nanotubes Market Revenue (Million) Forecast, by Application 2019 & 2032
- Table 40: Japan Nanotubes Market Volume (K Tons) Forecast, by Application 2019 & 2032
- Table 41: India Nanotubes Market Revenue (Million) Forecast, by Application 2019 & 2032
- Table 42: India Nanotubes Market Volume (K Tons) Forecast, by Application 2019 & 2032
- Table 43: South Korea Nanotubes Market Revenue (Million) Forecast, by Application 2019 & 2032
- Table 44: South Korea Nanotubes Market Volume (K Tons) Forecast, by Application 2019 & 2032
- Table 45: Taiwan Nanotubes Market Revenue (Million) Forecast, by Application 2019 & 2032
- Table 46: Taiwan Nanotubes Market Volume (K Tons) Forecast, by Application 2019 & 2032
- Table 47: Australia Nanotubes Market Revenue (Million) Forecast, by Application 2019 & 2032
- Table 48: Australia Nanotubes Market Volume (K Tons) Forecast, by Application 2019 & 2032
- Table 49: Rest of Asia-Pacific Nanotubes Market Revenue (Million) Forecast, by Application 2019 & 2032
- Table 50: Rest of Asia-Pacific Nanotubes Market Volume (K Tons) Forecast, by Application 2019 & 2032
- Table 51: Global Nanotubes Market Revenue Million Forecast, by Country 2019 & 2032
- Table 52: Global Nanotubes Market Volume K Tons Forecast, by Country 2019 & 2032
- Table 53: Brazil Nanotubes Market Revenue (Million) Forecast, by Application 2019 & 2032
- Table 54: Brazil Nanotubes Market Volume (K Tons) Forecast, by Application 2019 & 2032
- Table 55: Argentina Nanotubes Market Revenue (Million) Forecast, by Application 2019 & 2032
- Table 56: Argentina Nanotubes Market Volume (K Tons) Forecast, by Application 2019 & 2032
- Table 57: Rest of South America Nanotubes Market Revenue (Million) Forecast, by Application 2019 & 2032
- Table 58: Rest of South America Nanotubes Market Volume (K Tons) Forecast, by Application 2019 & 2032
- Table 59: Global Nanotubes Market Revenue Million Forecast, by Country 2019 & 2032
- Table 60: Global Nanotubes Market Volume K Tons Forecast, by Country 2019 & 2032
- Table 61: Middle East Nanotubes Market Revenue (Million) Forecast, by Application 2019 & 2032
- Table 62: Middle East Nanotubes Market Volume (K Tons) Forecast, by Application 2019 & 2032
- Table 63: Africa Nanotubes Market Revenue (Million) Forecast, by Application 2019 & 2032
- Table 64: Africa Nanotubes Market Volume (K Tons) Forecast, by Application 2019 & 2032
- Table 65: Global Nanotubes Market Revenue Million Forecast, by Type 2019 & 2032
- Table 66: Global Nanotubes Market Volume K Tons Forecast, by Type 2019 & 2032
- Table 67: Global Nanotubes Market Revenue Million Forecast, by Structure Type 2019 & 2032
- Table 68: Global Nanotubes Market Volume K Tons Forecast, by Structure Type 2019 & 2032
- Table 69: Global Nanotubes Market Revenue Million Forecast, by Application 2019 & 2032
- Table 70: Global Nanotubes Market Volume K Tons Forecast, by Application 2019 & 2032
- Table 71: Global Nanotubes Market Revenue Million Forecast, by End-user Industry 2019 & 2032
- Table 72: Global Nanotubes Market Volume K Tons Forecast, by End-user Industry 2019 & 2032
- Table 73: Global Nanotubes Market Revenue Million Forecast, by Country 2019 & 2032
- Table 74: Global Nanotubes Market Volume K Tons Forecast, by Country 2019 & 2032
- Table 75: China Nanotubes Market Revenue (Million) Forecast, by Application 2019 & 2032
- Table 76: China Nanotubes Market Volume (K Tons) Forecast, by Application 2019 & 2032
- Table 77: India Nanotubes Market Revenue (Million) Forecast, by Application 2019 & 2032
- Table 78: India Nanotubes Market Volume (K Tons) Forecast, by Application 2019 & 2032
- Table 79: Japan Nanotubes Market Revenue (Million) Forecast, by Application 2019 & 2032
- Table 80: Japan Nanotubes Market Volume (K Tons) Forecast, by Application 2019 & 2032
- Table 81: South Korea Nanotubes Market Revenue (Million) Forecast, by Application 2019 & 2032
- Table 82: South Korea Nanotubes Market Volume (K Tons) Forecast, by Application 2019 & 2032
- Table 83: Rest of Asia Pacific Nanotubes Market Revenue (Million) Forecast, by Application 2019 & 2032
- Table 84: Rest of Asia Pacific Nanotubes Market Volume (K Tons) Forecast, by Application 2019 & 2032
- Table 85: Global Nanotubes Market Revenue Million Forecast, by Type 2019 & 2032
- Table 86: Global Nanotubes Market Volume K Tons Forecast, by Type 2019 & 2032
- Table 87: Global Nanotubes Market Revenue Million Forecast, by Structure Type 2019 & 2032
- Table 88: Global Nanotubes Market Volume K Tons Forecast, by Structure Type 2019 & 2032
- Table 89: Global Nanotubes Market Revenue Million Forecast, by Application 2019 & 2032
- Table 90: Global Nanotubes Market Volume K Tons Forecast, by Application 2019 & 2032
- Table 91: Global Nanotubes Market Revenue Million Forecast, by End-user Industry 2019 & 2032
- Table 92: Global Nanotubes Market Volume K Tons Forecast, by End-user Industry 2019 & 2032
- Table 93: Global Nanotubes Market Revenue Million Forecast, by Country 2019 & 2032
- Table 94: Global Nanotubes Market Volume K Tons Forecast, by Country 2019 & 2032
- Table 95: United States Nanotubes Market Revenue (Million) Forecast, by Application 2019 & 2032
- Table 96: United States Nanotubes Market Volume (K Tons) Forecast, by Application 2019 & 2032
- Table 97: Canada Nanotubes Market Revenue (Million) Forecast, by Application 2019 & 2032
- Table 98: Canada Nanotubes Market Volume (K Tons) Forecast, by Application 2019 & 2032
- Table 99: Mexico Nanotubes Market Revenue (Million) Forecast, by Application 2019 & 2032
- Table 100: Mexico Nanotubes Market Volume (K Tons) Forecast, by Application 2019 & 2032
- Table 101: Global Nanotubes Market Revenue Million Forecast, by Type 2019 & 2032
- Table 102: Global Nanotubes Market Volume K Tons Forecast, by Type 2019 & 2032
- Table 103: Global Nanotubes Market Revenue Million Forecast, by Structure Type 2019 & 2032
- Table 104: Global Nanotubes Market Volume K Tons Forecast, by Structure Type 2019 & 2032
- Table 105: Global Nanotubes Market Revenue Million Forecast, by Application 2019 & 2032
- Table 106: Global Nanotubes Market Volume K Tons Forecast, by Application 2019 & 2032
- Table 107: Global Nanotubes Market Revenue Million Forecast, by End-user Industry 2019 & 2032
- Table 108: Global Nanotubes Market Volume K Tons Forecast, by End-user Industry 2019 & 2032
- Table 109: Global Nanotubes Market Revenue Million Forecast, by Country 2019 & 2032
- Table 110: Global Nanotubes Market Volume K Tons Forecast, by Country 2019 & 2032
- Table 111: Germany Nanotubes Market Revenue (Million) Forecast, by Application 2019 & 2032
- Table 112: Germany Nanotubes Market Volume (K Tons) Forecast, by Application 2019 & 2032
- Table 113: United Kingdom Nanotubes Market Revenue (Million) Forecast, by Application 2019 & 2032
- Table 114: United Kingdom Nanotubes Market Volume (K Tons) Forecast, by Application 2019 & 2032
- Table 115: France Nanotubes Market Revenue (Million) Forecast, by Application 2019 & 2032
- Table 116: France Nanotubes Market Volume (K Tons) Forecast, by Application 2019 & 2032
- Table 117: Italy Nanotubes Market Revenue (Million) Forecast, by Application 2019 & 2032
- Table 118: Italy Nanotubes Market Volume (K Tons) Forecast, by Application 2019 & 2032
- Table 119: Rest of Europe Nanotubes Market Revenue (Million) Forecast, by Application 2019 & 2032
- Table 120: Rest of Europe Nanotubes Market Volume (K Tons) Forecast, by Application 2019 & 2032
- Table 121: Global Nanotubes Market Revenue Million Forecast, by Type 2019 & 2032
- Table 122: Global Nanotubes Market Volume K Tons Forecast, by Type 2019 & 2032
- Table 123: Global Nanotubes Market Revenue Million Forecast, by Structure Type 2019 & 2032
- Table 124: Global Nanotubes Market Volume K Tons Forecast, by Structure Type 2019 & 2032
- Table 125: Global Nanotubes Market Revenue Million Forecast, by Application 2019 & 2032
- Table 126: Global Nanotubes Market Volume K Tons Forecast, by Application 2019 & 2032
- Table 127: Global Nanotubes Market Revenue Million Forecast, by End-user Industry 2019 & 2032
- Table 128: Global Nanotubes Market Volume K Tons Forecast, by End-user Industry 2019 & 2032
- Table 129: Global Nanotubes Market Revenue Million Forecast, by Country 2019 & 2032
- Table 130: Global Nanotubes Market Volume K Tons Forecast, by Country 2019 & 2032
- Table 131: Brazil Nanotubes Market Revenue (Million) Forecast, by Application 2019 & 2032
- Table 132: Brazil Nanotubes Market Volume (K Tons) Forecast, by Application 2019 & 2032
- Table 133: Argentina Nanotubes Market Revenue (Million) Forecast, by Application 2019 & 2032
- Table 134: Argentina Nanotubes Market Volume (K Tons) Forecast, by Application 2019 & 2032
- Table 135: Rest of South America Nanotubes Market Revenue (Million) Forecast, by Application 2019 & 2032
- Table 136: Rest of South America Nanotubes Market Volume (K Tons) Forecast, by Application 2019 & 2032
- Table 137: Global Nanotubes Market Revenue Million Forecast, by Type 2019 & 2032
- Table 138: Global Nanotubes Market Volume K Tons Forecast, by Type 2019 & 2032
- Table 139: Global Nanotubes Market Revenue Million Forecast, by Structure Type 2019 & 2032
- Table 140: Global Nanotubes Market Volume K Tons Forecast, by Structure Type 2019 & 2032
- Table 141: Global Nanotubes Market Revenue Million Forecast, by Application 2019 & 2032
- Table 142: Global Nanotubes Market Volume K Tons Forecast, by Application 2019 & 2032
- Table 143: Global Nanotubes Market Revenue Million Forecast, by End-user Industry 2019 & 2032
- Table 144: Global Nanotubes Market Volume K Tons Forecast, by End-user Industry 2019 & 2032
- Table 145: Global Nanotubes Market Revenue Million Forecast, by Country 2019 & 2032
- Table 146: Global Nanotubes Market Volume K Tons Forecast, by Country 2019 & 2032
- Table 147: Saudi Arabia Nanotubes Market Revenue (Million) Forecast, by Application 2019 & 2032
- Table 148: Saudi Arabia Nanotubes Market Volume (K Tons) Forecast, by Application 2019 & 2032
- Table 149: South Africa Nanotubes Market Revenue (Million) Forecast, by Application 2019 & 2032
- Table 150: South Africa Nanotubes Market Volume (K Tons) Forecast, by Application 2019 & 2032
- Table 151: Rest of Middle East and Africa Nanotubes Market Revenue (Million) Forecast, by Application 2019 & 2032
- Table 152: Rest of Middle East and Africa Nanotubes Market Volume (K Tons) Forecast, by Application 2019 & 2032
Frequently Asked Questions
1. What is the projected Compound Annual Growth Rate (CAGR) of the Nanotubes Market?
The projected CAGR is approximately 19.95%.
2. Which companies are prominent players in the Nanotubes Market?
Key companies in the market include Jiangsu Cnano Technology Co Ltd, Nanoshel LLC, Arkema, NanoIntegris Inc, LG Chem, Cheap Tubes, Carbon Solutions Inc, Hyperion Catalysis International, Resonac Holdings Corporation, Nano-C, Thomas Swan & Co Ltd, Nanocyl SA (Birla Carbon).
3. What are the main segments of the Nanotubes Market?
The market segments include Type, Structure Type, Application, End-user Industry.
4. Can you provide details about the market size?
The market size is estimated to be USD 7.98 Million as of 2022.
5. What are some drivers contributing to market growth?
Advancement in Nanotubes Technologies; Growing Adoption of Carbon Nanotubes; Other Drivers.
6. What are the notable trends driving market growth?
Electronics and Semiconductor Segment to Dominate the Market Demand.
7. Are there any restraints impacting market growth?
High Manufacturing and R&D Cost; Other Restraints.
8. Can you provide examples of recent developments in the market?
October 2023: Birla Carbon (Aditya Birla Group) acquired Nanocyl SA to enhance its growth in battery materials for lithium-ion batteries, which will add value to its nanotubes business segment.
9. What pricing options are available for accessing the report?
Pricing options include single-user, multi-user, and enterprise licenses priced at USD 4750, USD 5250, and USD 8750 respectively.
10. Is the market size provided in terms of value or volume?
The market size is provided in terms of value, measured in Million and volume, measured in K Tons.
11. Are there any specific market keywords associated with the report?
Yes, the market keyword associated with the report is "Nanotubes Market," which aids in identifying and referencing the specific market segment covered.
12. How do I determine which pricing option suits my needs best?
The pricing options vary based on user requirements and access needs. Individual users may opt for single-user licenses, while businesses requiring broader access may choose multi-user or enterprise licenses for cost-effective access to the report.
13. Are there any additional resources or data provided in the Nanotubes Market report?
While the report offers comprehensive insights, it's advisable to review the specific contents or supplementary materials provided to ascertain if additional resources or data are available.
14. How can I stay updated on further developments or reports in the Nanotubes Market?
To stay informed about further developments, trends, and reports in the Nanotubes Market, consider subscribing to industry newsletters, following relevant companies and organizations, or regularly checking reputable industry news sources and publications.
Methodology
Step 1 - Identification of Relevant Samples Size from Population Database


Step 2 - Approaches for Defining Global Market Size (Value, Volume* & Price*)

Note*: In applicable scenarios
Step 3 - Data Sources
Primary Research
- Web Analytics
- Survey Reports
- Research Institute
- Latest Research Reports
- Opinion Leaders
Secondary Research
- Annual Reports
- White Paper
- Latest Press Release
- Industry Association
- Paid Database
- Investor Presentations

Step 4 - Data Triangulation
Involves using different sources of information in order to increase the validity of a study
These sources are likely to be stakeholders in a program - participants, other researchers, program staff, other community members, and so on.
Then we put all data in single framework & apply various statistical tools to find out the dynamic on the market.
During the analysis stage, feedback from the stakeholder groups would be compared to determine areas of agreement as well as areas of divergence


