

Key Insights
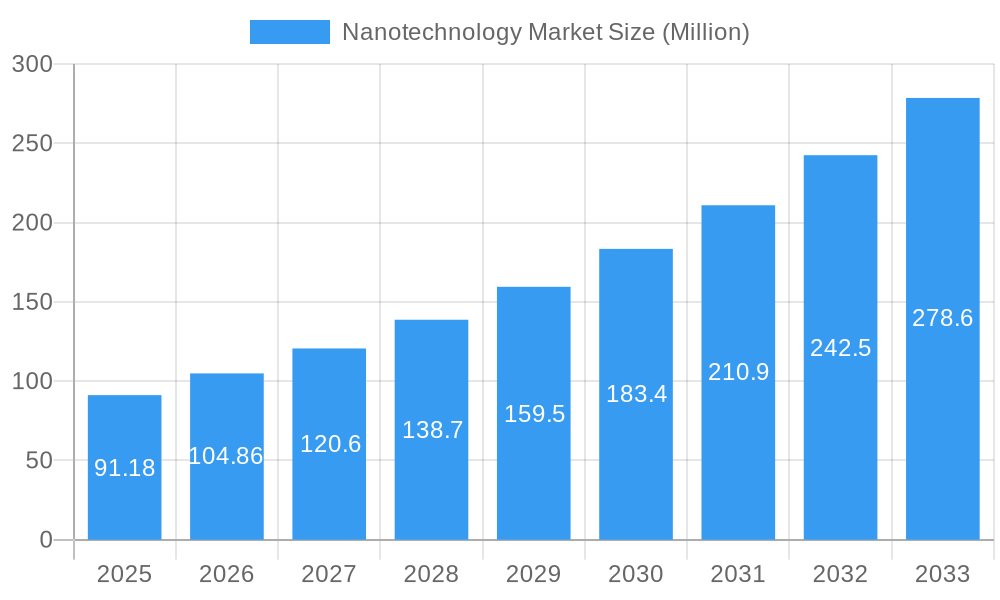
The nanotechnology market, valued at $91.18 million in 2025, is projected to experience robust growth, exhibiting a Compound Annual Growth Rate (CAGR) of 15.03% from 2025 to 2033. This expansion is driven by several key factors. The increasing demand for advanced materials with enhanced properties in various sectors like electronics, healthcare, and energy is a significant catalyst. For instance, the development of smaller, faster, and more energy-efficient electronic devices relies heavily on nanomaterials. Furthermore, advancements in nanomedicine, including targeted drug delivery and improved diagnostics, are fueling market growth. The rising investments in research and development within the nanotechnology field are also contributing to this positive trajectory. Government initiatives and private sector funding are crucial in driving innovation and commercialization. However, challenges such as the high cost of nanomaterial production, potential health and environmental concerns related to certain nanomaterials, and regulatory hurdles need to be addressed to ensure sustainable market growth.
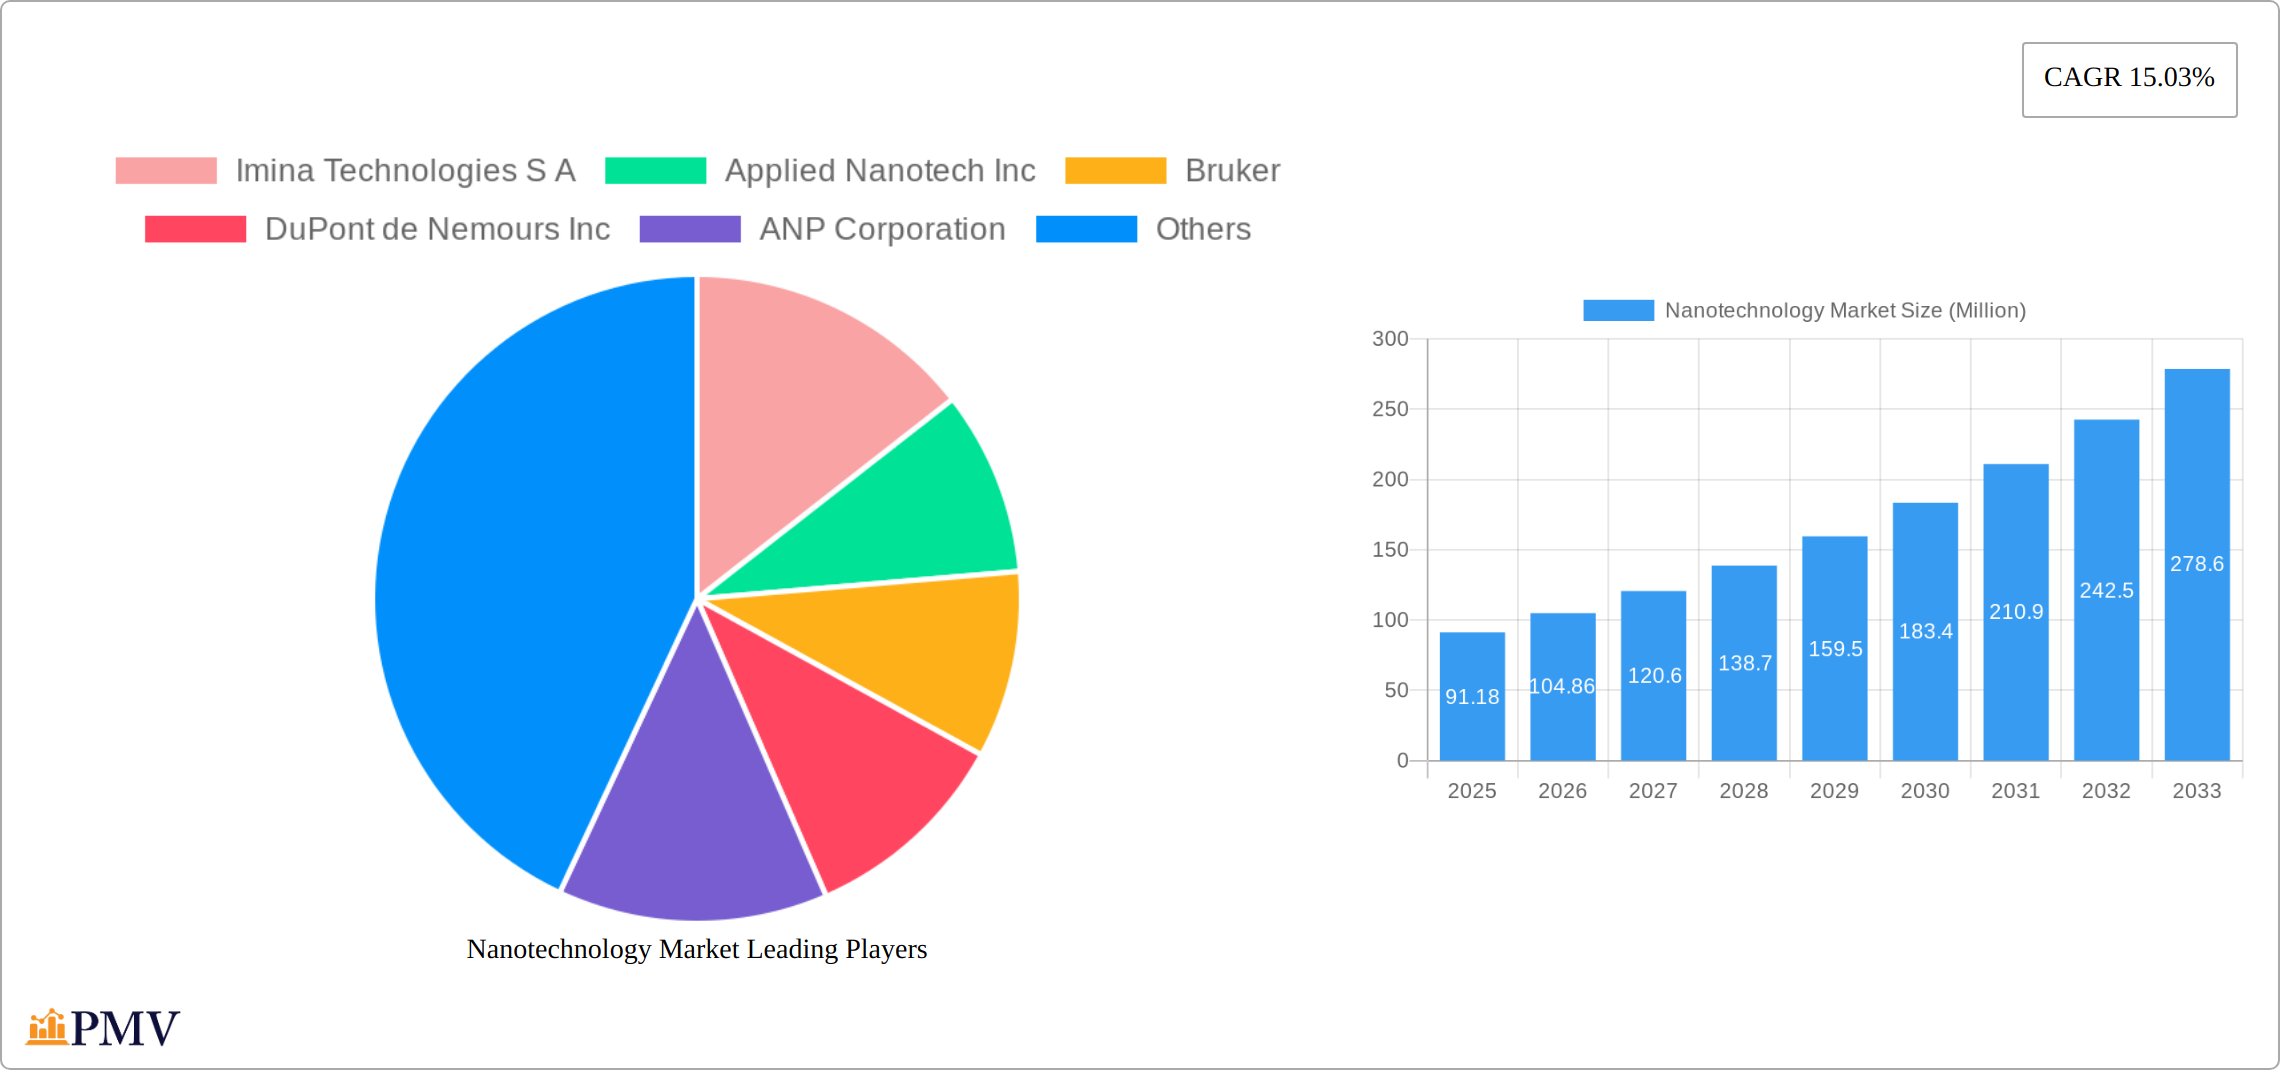
Nanotechnology Market Market Size (In Million)
Despite these challenges, the nanotechnology market presents substantial opportunities. The development of new applications in areas like water purification, environmental remediation, and advanced manufacturing offers considerable potential for future growth. Furthermore, the ongoing convergence of nanotechnology with other emerging technologies, such as biotechnology and artificial intelligence, will likely create new and innovative products and services. The market is segmented based on application, type of nanomaterial, and geography, with key players including Imina Technologies S.A., Applied Nanotech Inc., Bruker, DuPont de Nemours Inc., ANP Corporation, eSpin Technologies Inc., Thermo Fischer Scientific Inc., Asahi Kasei Corporation, Kleindiek Nanotechnik GmbH, Integran Technologies, Nanonics Imaging Ltd, and BASF S. Competitive landscape analysis reveals a mix of established players and emerging companies, leading to innovation and a dynamic market environment. Strategic partnerships and collaborations are likely to become increasingly important to ensure market success.
Nanotechnology Market Company Market Share
Nanotechnology Market: A Comprehensive Report (2019-2033)
This in-depth report provides a comprehensive analysis of the Nanotechnology Market, covering market size, segmentation, growth drivers, challenges, competitive landscape, and future outlook. The study period spans from 2019 to 2033, with 2025 as the base and estimated year. This report offers actionable insights for businesses, investors, and researchers seeking to navigate this rapidly evolving sector. The market is projected to reach xx Million by 2033, exhibiting a CAGR of xx% during the forecast period (2025-2033).
Nanotechnology Market Market Structure & Competitive Dynamics
The nanotechnology market presents a dynamic interplay of large multinational corporations and agile, specialized firms. While market concentration is moderate, with several key players holding substantial market share, the landscape remains far from monopolized. The collective market share of the top five companies is estimated at [Insert Updated Percentage]%, reflecting a competitive environment. Innovation thrives within robust ecosystems, particularly in regions with strong research institutions and supportive government policies. Regulatory landscapes, however, vary significantly across geographical locations, directly influencing product development timelines and commercial viability. While substitute products exist within specific niches, nanotechnology's unique performance and functionality advantages frequently secure its dominance. End-user demand is strongly driven by applications offering clear economic and societal benefits. The past five years have witnessed considerable mergers and acquisitions (M&A) activity, with a total deal value exceeding [Insert Updated Value] million. These transactions, often involving expansions into new applications or acquisitions of smaller firms possessing specialized technologies, significantly reshape market concentration and competitive dynamics. The report offers a comprehensive analysis of these activities and their subsequent market impacts.
Nanotechnology Market Industry Trends & Insights
The nanotechnology market is experiencing rapid growth, driven by several key factors. Technological advancements continue to unlock new applications across various sectors. The increasing demand for smaller, faster, and more efficient devices is fueling the adoption of nanotechnology in electronics, and the development of high-performance materials for diverse uses is also creating tremendous market opportunity. Consumer preferences are shifting towards sustainable and environmentally friendly products, creating a niche for nanotechnology solutions in areas such as renewable energy and pollution control. The market's CAGR during the historical period (2019-2024) was xx%, indicating substantial growth. Market penetration in key sectors, such as electronics and healthcare, remains relatively low, suggesting significant future potential. Competitive dynamics are marked by ongoing innovation and the entry of new players, leading to both opportunities and challenges for established firms. This intense competition drives innovation and pushes the boundaries of nanotechnology's capabilities.
Dominant Markets & Segments in Nanotechnology Market
[Region/Country Name] maintains its position as the leading market for nanotechnology, capturing [Insert Updated Percentage]% of the global market in 2025. This sustained dominance is attributable to several key factors:
- Robust Government Support: Proactive government policies and substantial funding dedicated to nanotechnology R&D consistently fuel innovation.
- Advanced Infrastructure: A well-developed infrastructure effectively supports manufacturing and commercialization processes.
- High-Level R&D Investment: Significant private and public investments in nanotechnology research ensure a pipeline of cutting-edge advancements.
- Strategic Concentration of Key Players: The presence of leading nanotechnology companies fosters collaboration and accelerates development.
This section delivers an in-depth examination of the contributing factors to [Region/Country Name]'s market leadership, and explores emerging growth opportunities in other key regions, including [Mention other promising regions and briefly explain why].
Nanotechnology Market Product Innovations
Recent years have witnessed significant advancements in nanotechnology products, encompassing novel materials with enhanced properties, improved manufacturing techniques, and innovative applications. Developments include the creation of more efficient and cost-effective methods for producing nanomaterials, leading to a decrease in manufacturing costs. This also spurred exploration into various industries including electronics, medicine, and energy for new nanomaterial applications. These innovations are driving market expansion and fostering increased competition.
Report Segmentation & Scope
The Nanotechnology market is meticulously segmented by various key parameters, including material type (e.g., carbon nanotubes, graphene, nanoparticles, nanowires, quantum dots), application (e.g., electronics, healthcare, energy, environmental remediation, cosmetics), and end-user industry (e.g., automotive, aerospace, biomedical, consumer goods). Each segment exhibits unique growth trajectories and competitive landscapes. For instance, the carbon nanotube segment is poised for substantial growth, fueled by its versatile applications in advanced materials and electronics. The healthcare segment also shows significant growth potential, driven by rising demand for advanced diagnostics and targeted drug delivery systems. Further, the [mention another segment with growth potential and reasons] segment is experiencing strong growth due to [reason]. The report provides granular analysis and robust growth projections for each segment, encompassing market size, growth rates, and competitive analyses, along with detailed market share breakdowns.
Key Drivers of Nanotechnology Market Growth
Several converging factors fuel the remarkable growth of the nanotechnology market. At the forefront are continuous technological advancements, particularly within material science and manufacturing processes. The development of novel nanomaterials with enhanced properties is a primary catalyst for innovation across diverse sectors. Strong global government support and substantial funding for nanotechnology R&D provide critical momentum. The increasing demand for high-performance materials across various industries further propels the development and adoption of nanotechnology solutions. Furthermore, [mention additional factors like increasing consumer awareness, sustainability concerns, etc.] are contributing to market expansion.
Challenges in the Nanotechnology Market Sector
Despite its immense potential, the nanotechnology market faces several challenges. Regulatory uncertainties and concerns regarding the environmental and health impacts of nanomaterials pose significant hurdles. Supply chain complexities and the high cost of manufacturing nanomaterials can limit market expansion. Intense competition among existing and emerging players puts pressure on pricing and profitability. Addressing these challenges is crucial for realizing the full potential of the nanotechnology market.
Leading Players in the Nanotechnology Market Market
- Imina Technologies S A
- Applied Nanotech Inc
- Bruker
- DuPont de Nemours Inc
- ANP Corporation
- eSpin Technologies Inc
- Thermo Fischer Scientific Inc
- Asahi Kasei Corporation
- Kleindiek Nanotechnik GmbH
- Integran Technologies
- Nanonics Imaging Ltd
- BASF S
Key Developments in Nanotechnology Market Sector
- June 2024: OCSiAl completed construction of a facility in Serbia for producing single-wall carbon nanotube (SWCNT) dispersions, boosting high-performance battery production for global EV manufacturers.
- February 2024: Bruker and the University of Sydney partnered on a precision-medicine research initiative, advancing nanomedicine and gene therapies.
Strategic Nanotechnology Market Market Outlook
The nanotechnology market holds immense potential for future growth. Continued technological advancements, coupled with increasing demand across various sectors, will drive market expansion. Strategic partnerships and collaborations between research institutions and companies are expected to accelerate innovation. Focus on sustainable and environmentally friendly nanotechnology solutions will gain prominence. The market is poised for significant growth over the forecast period, presenting lucrative opportunities for investors and businesses.
Nanotechnology Market Segmentation
-
1. Type
- 1.1. Nanomaterials
- 1.2. Nanocomposites
- 1.3. Nanodevices
- 1.4. Other Types
-
2. Application
- 2.1. Medical and Healthcare
- 2.2. Material Science
- 2.3. Energy Storage and Production
- 2.4. Environmental
- 2.5. Electronics and Computing
- 2.6. Cosmetics and Personal Care Products
- 2.7. Food Science
- 2.8. Textile
Nanotechnology Market Segmentation By Geography
- 1. North America
- 2. Europe
- 3. Asia
- 4. Australia and New Zealand
- 5. Latin America
- 6. Middle East and Africa
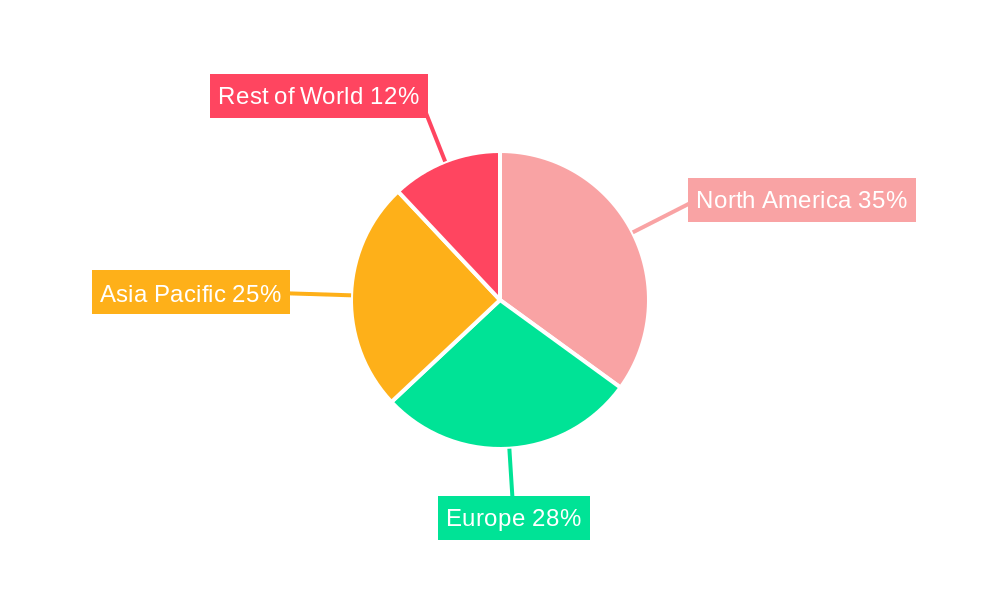
Nanotechnology Market Regional Market Share
Geographic Coverage of Nanotechnology Market
Nanotechnology Market REPORT HIGHLIGHTS
| Aspects | Details |
|---|---|
| Study Period | 2020-2034 |
| Base Year | 2025 |
| Estimated Year | 2026 |
| Forecast Period | 2026-2034 |
| Historical Period | 2020-2025 |
| Growth Rate | CAGR of 15.03% from 2020-2034 |
| Segmentation |
|
Table of Contents
- 1. Introduction
- 1.1. Research Scope
- 1.2. Market Segmentation
- 1.3. Research Objective
- 1.4. Definitions and Assumptions
- 2. Executive Summary
- 2.1. Market Snapshot
- 3. Market Dynamics
- 3.1. Market Drivers
- 3.2. Market Restrains
- 3.3. Market Trends
- 3.4. Market Opportunities
- 4. Market Factor Analysis
- 4.1. Porters Five Forces
- 4.1.1. Bargaining Power of Suppliers
- 4.1.2. Bargaining Power of Buyers
- 4.1.3. Threat of New Entrants
- 4.1.4. Threat of Substitutes
- 4.1.5. Competitive Rivalry
- 4.2. PESTEL analysis
- 4.3. BCG Analysis
- 4.3.1. Stars (High Growth, High Market Share)
- 4.3.2. Cash Cows (Low Growth, High Market Share)
- 4.3.3. Question Mark (High Growth, Low Market Share)
- 4.3.4. Dogs (Low Growth, Low Market Share)
- 4.4. Ansoff Matrix Analysis
- 4.5. Supply Chain Analysis
- 4.6. Regulatory Landscape
- 4.7. Current Market Potential and Opportunity Assessment (TAM–SAM–SOM Framework)
- 4.8. PMV Analyst Note
- 4.1. Porters Five Forces
- 5. Market Analysis, Insights and Forecast 2021-2033
- 5.1. Market Analysis, Insights and Forecast - by Type
- 5.1.1. Nanomaterials
- 5.1.2. Nanocomposites
- 5.1.3. Nanodevices
- 5.1.4. Other Types
- 5.2. Market Analysis, Insights and Forecast - by Application
- 5.2.1. Medical and Healthcare
- 5.2.2. Material Science
- 5.2.3. Energy Storage and Production
- 5.2.4. Environmental
- 5.2.5. Electronics and Computing
- 5.2.6. Cosmetics and Personal Care Products
- 5.2.7. Food Science
- 5.2.8. Textile
- 5.3. Market Analysis, Insights and Forecast - by Region
- 5.3.1. North America
- 5.3.2. Europe
- 5.3.3. Asia
- 5.3.4. Australia and New Zealand
- 5.3.5. Latin America
- 5.3.6. Middle East and Africa
- 5.1. Market Analysis, Insights and Forecast - by Type
- 6. Global Nanotechnology Market Analysis, Insights and Forecast, 2021-2033
- 6.1. Market Analysis, Insights and Forecast - by Type
- 6.1.1. Nanomaterials
- 6.1.2. Nanocomposites
- 6.1.3. Nanodevices
- 6.1.4. Other Types
- 6.2. Market Analysis, Insights and Forecast - by Application
- 6.2.1. Medical and Healthcare
- 6.2.2. Material Science
- 6.2.3. Energy Storage and Production
- 6.2.4. Environmental
- 6.2.5. Electronics and Computing
- 6.2.6. Cosmetics and Personal Care Products
- 6.2.7. Food Science
- 6.2.8. Textile
- 6.1. Market Analysis, Insights and Forecast - by Type
- 7. North America Nanotechnology Market Analysis, Insights and Forecast, 2020-2032
- 7.1. Market Analysis, Insights and Forecast - by Type
- 7.1.1. Nanomaterials
- 7.1.2. Nanocomposites
- 7.1.3. Nanodevices
- 7.1.4. Other Types
- 7.2. Market Analysis, Insights and Forecast - by Application
- 7.2.1. Medical and Healthcare
- 7.2.2. Material Science
- 7.2.3. Energy Storage and Production
- 7.2.4. Environmental
- 7.2.5. Electronics and Computing
- 7.2.6. Cosmetics and Personal Care Products
- 7.2.7. Food Science
- 7.2.8. Textile
- 7.1. Market Analysis, Insights and Forecast - by Type
- 8. Europe Nanotechnology Market Analysis, Insights and Forecast, 2020-2032
- 8.1. Market Analysis, Insights and Forecast - by Type
- 8.1.1. Nanomaterials
- 8.1.2. Nanocomposites
- 8.1.3. Nanodevices
- 8.1.4. Other Types
- 8.2. Market Analysis, Insights and Forecast - by Application
- 8.2.1. Medical and Healthcare
- 8.2.2. Material Science
- 8.2.3. Energy Storage and Production
- 8.2.4. Environmental
- 8.2.5. Electronics and Computing
- 8.2.6. Cosmetics and Personal Care Products
- 8.2.7. Food Science
- 8.2.8. Textile
- 8.1. Market Analysis, Insights and Forecast - by Type
- 9. Asia Nanotechnology Market Analysis, Insights and Forecast, 2020-2032
- 9.1. Market Analysis, Insights and Forecast - by Type
- 9.1.1. Nanomaterials
- 9.1.2. Nanocomposites
- 9.1.3. Nanodevices
- 9.1.4. Other Types
- 9.2. Market Analysis, Insights and Forecast - by Application
- 9.2.1. Medical and Healthcare
- 9.2.2. Material Science
- 9.2.3. Energy Storage and Production
- 9.2.4. Environmental
- 9.2.5. Electronics and Computing
- 9.2.6. Cosmetics and Personal Care Products
- 9.2.7. Food Science
- 9.2.8. Textile
- 9.1. Market Analysis, Insights and Forecast - by Type
- 10. Australia and New Zealand Nanotechnology Market Analysis, Insights and Forecast, 2020-2032
- 10.1. Market Analysis, Insights and Forecast - by Type
- 10.1.1. Nanomaterials
- 10.1.2. Nanocomposites
- 10.1.3. Nanodevices
- 10.1.4. Other Types
- 10.2. Market Analysis, Insights and Forecast - by Application
- 10.2.1. Medical and Healthcare
- 10.2.2. Material Science
- 10.2.3. Energy Storage and Production
- 10.2.4. Environmental
- 10.2.5. Electronics and Computing
- 10.2.6. Cosmetics and Personal Care Products
- 10.2.7. Food Science
- 10.2.8. Textile
- 10.1. Market Analysis, Insights and Forecast - by Type
- 11. Latin America Nanotechnology Market Analysis, Insights and Forecast, 2020-2032
- 11.1. Market Analysis, Insights and Forecast - by Type
- 11.1.1. Nanomaterials
- 11.1.2. Nanocomposites
- 11.1.3. Nanodevices
- 11.1.4. Other Types
- 11.2. Market Analysis, Insights and Forecast - by Application
- 11.2.1. Medical and Healthcare
- 11.2.2. Material Science
- 11.2.3. Energy Storage and Production
- 11.2.4. Environmental
- 11.2.5. Electronics and Computing
- 11.2.6. Cosmetics and Personal Care Products
- 11.2.7. Food Science
- 11.2.8. Textile
- 11.1. Market Analysis, Insights and Forecast - by Type
- 12. Middle East and Africa Nanotechnology Market Analysis, Insights and Forecast, 2020-2032
- 12.1. Market Analysis, Insights and Forecast - by Type
- 12.1.1. Nanomaterials
- 12.1.2. Nanocomposites
- 12.1.3. Nanodevices
- 12.1.4. Other Types
- 12.2. Market Analysis, Insights and Forecast - by Application
- 12.2.1. Medical and Healthcare
- 12.2.2. Material Science
- 12.2.3. Energy Storage and Production
- 12.2.4. Environmental
- 12.2.5. Electronics and Computing
- 12.2.6. Cosmetics and Personal Care Products
- 12.2.7. Food Science
- 12.2.8. Textile
- 12.1. Market Analysis, Insights and Forecast - by Type
- 13. Competitive Analysis
- 13.1. Company Profiles
- 13.1.1 Imina Technologies S A
- 13.1.1.1. Company Overview
- 13.1.1.2. Products
- 13.1.1.3. Company Financials
- 13.1.1.4. SWOT Analysis
- 13.1.2 Applied Nanotech Inc
- 13.1.2.1. Company Overview
- 13.1.2.2. Products
- 13.1.2.3. Company Financials
- 13.1.2.4. SWOT Analysis
- 13.1.3 Bruker
- 13.1.3.1. Company Overview
- 13.1.3.2. Products
- 13.1.3.3. Company Financials
- 13.1.3.4. SWOT Analysis
- 13.1.4 DuPont de Nemours Inc
- 13.1.4.1. Company Overview
- 13.1.4.2. Products
- 13.1.4.3. Company Financials
- 13.1.4.4. SWOT Analysis
- 13.1.5 ANP Corporation
- 13.1.5.1. Company Overview
- 13.1.5.2. Products
- 13.1.5.3. Company Financials
- 13.1.5.4. SWOT Analysis
- 13.1.6 eSpin Technologies Inc
- 13.1.6.1. Company Overview
- 13.1.6.2. Products
- 13.1.6.3. Company Financials
- 13.1.6.4. SWOT Analysis
- 13.1.7 Thermo Fischer Scientific Inc
- 13.1.7.1. Company Overview
- 13.1.7.2. Products
- 13.1.7.3. Company Financials
- 13.1.7.4. SWOT Analysis
- 13.1.8 Asahi Kasei Corporation
- 13.1.8.1. Company Overview
- 13.1.8.2. Products
- 13.1.8.3. Company Financials
- 13.1.8.4. SWOT Analysis
- 13.1.9 Kleindiek Nanotechnik GmbH
- 13.1.9.1. Company Overview
- 13.1.9.2. Products
- 13.1.9.3. Company Financials
- 13.1.9.4. SWOT Analysis
- 13.1.10 Integran Technologies
- 13.1.10.1. Company Overview
- 13.1.10.2. Products
- 13.1.10.3. Company Financials
- 13.1.10.4. SWOT Analysis
- 13.1.11 Nanonics Imaging Ltd
- 13.1.11.1. Company Overview
- 13.1.11.2. Products
- 13.1.11.3. Company Financials
- 13.1.11.4. SWOT Analysis
- 13.1.12 BASF S
- 13.1.12.1. Company Overview
- 13.1.12.2. Products
- 13.1.12.3. Company Financials
- 13.1.12.4. SWOT Analysis
- 13.1.1 Imina Technologies S A
- 13.2. Market Entropy
- 13.2.1 Company's Key Areas Served
- 13.2.2 Recent Developments
- 13.3. Company Market Share Analysis 2025
- 13.3.1 Top 5 Companies Market Share Analysis
- 13.3.2 Top 3 Companies Market Share Analysis
- 13.4. List of Potential Customers
- 14. Research Methodology
List of Figures
- Figure 1: Global Nanotechnology Market Revenue Breakdown (Million, %) by Region 2025 & 2033
- Figure 2: Global Nanotechnology Market Volume Breakdown (Billion, %) by Region 2025 & 2033
- Figure 3: North America Nanotechnology Market Revenue (Million), by Type 2025 & 2033
- Figure 4: North America Nanotechnology Market Volume (Billion), by Type 2025 & 2033
- Figure 5: North America Nanotechnology Market Revenue Share (%), by Type 2025 & 2033
- Figure 6: North America Nanotechnology Market Volume Share (%), by Type 2025 & 2033
- Figure 7: North America Nanotechnology Market Revenue (Million), by Application 2025 & 2033
- Figure 8: North America Nanotechnology Market Volume (Billion), by Application 2025 & 2033
- Figure 9: North America Nanotechnology Market Revenue Share (%), by Application 2025 & 2033
- Figure 10: North America Nanotechnology Market Volume Share (%), by Application 2025 & 2033
- Figure 11: North America Nanotechnology Market Revenue (Million), by Country 2025 & 2033
- Figure 12: North America Nanotechnology Market Volume (Billion), by Country 2025 & 2033
- Figure 13: North America Nanotechnology Market Revenue Share (%), by Country 2025 & 2033
- Figure 14: North America Nanotechnology Market Volume Share (%), by Country 2025 & 2033
- Figure 15: Europe Nanotechnology Market Revenue (Million), by Type 2025 & 2033
- Figure 16: Europe Nanotechnology Market Volume (Billion), by Type 2025 & 2033
- Figure 17: Europe Nanotechnology Market Revenue Share (%), by Type 2025 & 2033
- Figure 18: Europe Nanotechnology Market Volume Share (%), by Type 2025 & 2033
- Figure 19: Europe Nanotechnology Market Revenue (Million), by Application 2025 & 2033
- Figure 20: Europe Nanotechnology Market Volume (Billion), by Application 2025 & 2033
- Figure 21: Europe Nanotechnology Market Revenue Share (%), by Application 2025 & 2033
- Figure 22: Europe Nanotechnology Market Volume Share (%), by Application 2025 & 2033
- Figure 23: Europe Nanotechnology Market Revenue (Million), by Country 2025 & 2033
- Figure 24: Europe Nanotechnology Market Volume (Billion), by Country 2025 & 2033
- Figure 25: Europe Nanotechnology Market Revenue Share (%), by Country 2025 & 2033
- Figure 26: Europe Nanotechnology Market Volume Share (%), by Country 2025 & 2033
- Figure 27: Asia Nanotechnology Market Revenue (Million), by Type 2025 & 2033
- Figure 28: Asia Nanotechnology Market Volume (Billion), by Type 2025 & 2033
- Figure 29: Asia Nanotechnology Market Revenue Share (%), by Type 2025 & 2033
- Figure 30: Asia Nanotechnology Market Volume Share (%), by Type 2025 & 2033
- Figure 31: Asia Nanotechnology Market Revenue (Million), by Application 2025 & 2033
- Figure 32: Asia Nanotechnology Market Volume (Billion), by Application 2025 & 2033
- Figure 33: Asia Nanotechnology Market Revenue Share (%), by Application 2025 & 2033
- Figure 34: Asia Nanotechnology Market Volume Share (%), by Application 2025 & 2033
- Figure 35: Asia Nanotechnology Market Revenue (Million), by Country 2025 & 2033
- Figure 36: Asia Nanotechnology Market Volume (Billion), by Country 2025 & 2033
- Figure 37: Asia Nanotechnology Market Revenue Share (%), by Country 2025 & 2033
- Figure 38: Asia Nanotechnology Market Volume Share (%), by Country 2025 & 2033
- Figure 39: Australia and New Zealand Nanotechnology Market Revenue (Million), by Type 2025 & 2033
- Figure 40: Australia and New Zealand Nanotechnology Market Volume (Billion), by Type 2025 & 2033
- Figure 41: Australia and New Zealand Nanotechnology Market Revenue Share (%), by Type 2025 & 2033
- Figure 42: Australia and New Zealand Nanotechnology Market Volume Share (%), by Type 2025 & 2033
- Figure 43: Australia and New Zealand Nanotechnology Market Revenue (Million), by Application 2025 & 2033
- Figure 44: Australia and New Zealand Nanotechnology Market Volume (Billion), by Application 2025 & 2033
- Figure 45: Australia and New Zealand Nanotechnology Market Revenue Share (%), by Application 2025 & 2033
- Figure 46: Australia and New Zealand Nanotechnology Market Volume Share (%), by Application 2025 & 2033
- Figure 47: Australia and New Zealand Nanotechnology Market Revenue (Million), by Country 2025 & 2033
- Figure 48: Australia and New Zealand Nanotechnology Market Volume (Billion), by Country 2025 & 2033
- Figure 49: Australia and New Zealand Nanotechnology Market Revenue Share (%), by Country 2025 & 2033
- Figure 50: Australia and New Zealand Nanotechnology Market Volume Share (%), by Country 2025 & 2033
- Figure 51: Latin America Nanotechnology Market Revenue (Million), by Type 2025 & 2033
- Figure 52: Latin America Nanotechnology Market Volume (Billion), by Type 2025 & 2033
- Figure 53: Latin America Nanotechnology Market Revenue Share (%), by Type 2025 & 2033
- Figure 54: Latin America Nanotechnology Market Volume Share (%), by Type 2025 & 2033
- Figure 55: Latin America Nanotechnology Market Revenue (Million), by Application 2025 & 2033
- Figure 56: Latin America Nanotechnology Market Volume (Billion), by Application 2025 & 2033
- Figure 57: Latin America Nanotechnology Market Revenue Share (%), by Application 2025 & 2033
- Figure 58: Latin America Nanotechnology Market Volume Share (%), by Application 2025 & 2033
- Figure 59: Latin America Nanotechnology Market Revenue (Million), by Country 2025 & 2033
- Figure 60: Latin America Nanotechnology Market Volume (Billion), by Country 2025 & 2033
- Figure 61: Latin America Nanotechnology Market Revenue Share (%), by Country 2025 & 2033
- Figure 62: Latin America Nanotechnology Market Volume Share (%), by Country 2025 & 2033
- Figure 63: Middle East and Africa Nanotechnology Market Revenue (Million), by Type 2025 & 2033
- Figure 64: Middle East and Africa Nanotechnology Market Volume (Billion), by Type 2025 & 2033
- Figure 65: Middle East and Africa Nanotechnology Market Revenue Share (%), by Type 2025 & 2033
- Figure 66: Middle East and Africa Nanotechnology Market Volume Share (%), by Type 2025 & 2033
- Figure 67: Middle East and Africa Nanotechnology Market Revenue (Million), by Application 2025 & 2033
- Figure 68: Middle East and Africa Nanotechnology Market Volume (Billion), by Application 2025 & 2033
- Figure 69: Middle East and Africa Nanotechnology Market Revenue Share (%), by Application 2025 & 2033
- Figure 70: Middle East and Africa Nanotechnology Market Volume Share (%), by Application 2025 & 2033
- Figure 71: Middle East and Africa Nanotechnology Market Revenue (Million), by Country 2025 & 2033
- Figure 72: Middle East and Africa Nanotechnology Market Volume (Billion), by Country 2025 & 2033
- Figure 73: Middle East and Africa Nanotechnology Market Revenue Share (%), by Country 2025 & 2033
- Figure 74: Middle East and Africa Nanotechnology Market Volume Share (%), by Country 2025 & 2033
List of Tables
- Table 1: Global Nanotechnology Market Revenue Million Forecast, by Type 2020 & 2033
- Table 2: Global Nanotechnology Market Volume Billion Forecast, by Type 2020 & 2033
- Table 3: Global Nanotechnology Market Revenue Million Forecast, by Application 2020 & 2033
- Table 4: Global Nanotechnology Market Volume Billion Forecast, by Application 2020 & 2033
- Table 5: Global Nanotechnology Market Revenue Million Forecast, by Region 2020 & 2033
- Table 6: Global Nanotechnology Market Volume Billion Forecast, by Region 2020 & 2033
- Table 7: Global Nanotechnology Market Revenue Million Forecast, by Type 2020 & 2033
- Table 8: Global Nanotechnology Market Volume Billion Forecast, by Type 2020 & 2033
- Table 9: Global Nanotechnology Market Revenue Million Forecast, by Application 2020 & 2033
- Table 10: Global Nanotechnology Market Volume Billion Forecast, by Application 2020 & 2033
- Table 11: Global Nanotechnology Market Revenue Million Forecast, by Country 2020 & 2033
- Table 12: Global Nanotechnology Market Volume Billion Forecast, by Country 2020 & 2033
- Table 13: Global Nanotechnology Market Revenue Million Forecast, by Type 2020 & 2033
- Table 14: Global Nanotechnology Market Volume Billion Forecast, by Type 2020 & 2033
- Table 15: Global Nanotechnology Market Revenue Million Forecast, by Application 2020 & 2033
- Table 16: Global Nanotechnology Market Volume Billion Forecast, by Application 2020 & 2033
- Table 17: Global Nanotechnology Market Revenue Million Forecast, by Country 2020 & 2033
- Table 18: Global Nanotechnology Market Volume Billion Forecast, by Country 2020 & 2033
- Table 19: Global Nanotechnology Market Revenue Million Forecast, by Type 2020 & 2033
- Table 20: Global Nanotechnology Market Volume Billion Forecast, by Type 2020 & 2033
- Table 21: Global Nanotechnology Market Revenue Million Forecast, by Application 2020 & 2033
- Table 22: Global Nanotechnology Market Volume Billion Forecast, by Application 2020 & 2033
- Table 23: Global Nanotechnology Market Revenue Million Forecast, by Country 2020 & 2033
- Table 24: Global Nanotechnology Market Volume Billion Forecast, by Country 2020 & 2033
- Table 25: Global Nanotechnology Market Revenue Million Forecast, by Type 2020 & 2033
- Table 26: Global Nanotechnology Market Volume Billion Forecast, by Type 2020 & 2033
- Table 27: Global Nanotechnology Market Revenue Million Forecast, by Application 2020 & 2033
- Table 28: Global Nanotechnology Market Volume Billion Forecast, by Application 2020 & 2033
- Table 29: Global Nanotechnology Market Revenue Million Forecast, by Country 2020 & 2033
- Table 30: Global Nanotechnology Market Volume Billion Forecast, by Country 2020 & 2033
- Table 31: Global Nanotechnology Market Revenue Million Forecast, by Type 2020 & 2033
- Table 32: Global Nanotechnology Market Volume Billion Forecast, by Type 2020 & 2033
- Table 33: Global Nanotechnology Market Revenue Million Forecast, by Application 2020 & 2033
- Table 34: Global Nanotechnology Market Volume Billion Forecast, by Application 2020 & 2033
- Table 35: Global Nanotechnology Market Revenue Million Forecast, by Country 2020 & 2033
- Table 36: Global Nanotechnology Market Volume Billion Forecast, by Country 2020 & 2033
- Table 37: Global Nanotechnology Market Revenue Million Forecast, by Type 2020 & 2033
- Table 38: Global Nanotechnology Market Volume Billion Forecast, by Type 2020 & 2033
- Table 39: Global Nanotechnology Market Revenue Million Forecast, by Application 2020 & 2033
- Table 40: Global Nanotechnology Market Volume Billion Forecast, by Application 2020 & 2033
- Table 41: Global Nanotechnology Market Revenue Million Forecast, by Country 2020 & 2033
- Table 42: Global Nanotechnology Market Volume Billion Forecast, by Country 2020 & 2033
Frequently Asked Questions
1. What is the projected Compound Annual Growth Rate (CAGR) of the Nanotechnology Market?
The projected CAGR is approximately 15.03%.
2. Which companies are prominent players in the Nanotechnology Market?
Key companies in the market include Imina Technologies S A, Applied Nanotech Inc, Bruker, DuPont de Nemours Inc, ANP Corporation, eSpin Technologies Inc, Thermo Fischer Scientific Inc, Asahi Kasei Corporation, Kleindiek Nanotechnik GmbH, Integran Technologies, Nanonics Imaging Ltd, BASF S.
3. What are the main segments of the Nanotechnology Market?
The market segments include Type, Application.
4. Can you provide details about the market size?
The market size is estimated to be USD 91.18 Million as of 2022.
5. What are some drivers contributing to market growth?
Rising Adoption of Nanomaterials in Drug Delivery and Medical Devices; Advancements in Nanotechnology.
6. What are the notable trends driving market growth?
Medical and Healthcare Application is Expected to Hold Significant Market Share.
7. Are there any restraints impacting market growth?
Rising Adoption of Nanomaterials in Drug Delivery and Medical Devices; Advancements in Nanotechnology.
8. Can you provide examples of recent developments in the market?
June 2024: OCSiAl finalized the construction of a facility in Serbia dedicated to producing single-wall carbon nanotube (SWCNT) dispersions. This initiative plans to bolster the production of high-performance batteries. The facility's output has already been secured by prominent global electric vehicle (EV) manufacturers, and OCSiAl is collaborating with the world's largest lithium-ion (Li-ion) battery cell producers.
9. What pricing options are available for accessing the report?
Pricing options include single-user, multi-user, and enterprise licenses priced at USD 4750, USD 5250, and USD 8750 respectively.
10. Is the market size provided in terms of value or volume?
The market size is provided in terms of value, measured in Million and volume, measured in Billion.
11. Are there any specific market keywords associated with the report?
Yes, the market keyword associated with the report is "Nanotechnology Market," which aids in identifying and referencing the specific market segment covered.
12. How do I determine which pricing option suits my needs best?
The pricing options vary based on user requirements and access needs. Individual users may opt for single-user licenses, while businesses requiring broader access may choose multi-user or enterprise licenses for cost-effective access to the report.
13. Are there any additional resources or data provided in the Nanotechnology Market report?
While the report offers comprehensive insights, it's advisable to review the specific contents or supplementary materials provided to ascertain if additional resources or data are available.
14. How can I stay updated on further developments or reports in the Nanotechnology Market?
To stay informed about further developments, trends, and reports in the Nanotechnology Market, consider subscribing to industry newsletters, following relevant companies and organizations, or regularly checking reputable industry news sources and publications.
Methodology
Step 1 - Identification of Relevant Samples Size from Population Database


Step 2 - Approaches for Defining Global Market Size (Value, Volume* & Price*)

Note*: In applicable scenarios
Step 3 - Data Sources
Primary Research
- Web Analytics
- Survey Reports
- Research Institute
- Latest Research Reports
- Opinion Leaders
Secondary Research
- Annual Reports
- White Paper
- Latest Press Release
- Industry Association
- Paid Database
- Investor Presentations

Step 4 - Data Triangulation
Involves using different sources of information in order to increase the validity of a study
These sources are likely to be stakeholders in a program - participants, other researchers, program staff, other community members, and so on.
Then we put all data in single framework & apply various statistical tools to find out the dynamic on the market.
During the analysis stage, feedback from the stakeholder groups would be compared to determine areas of agreement as well as areas of divergence