
Key Insights
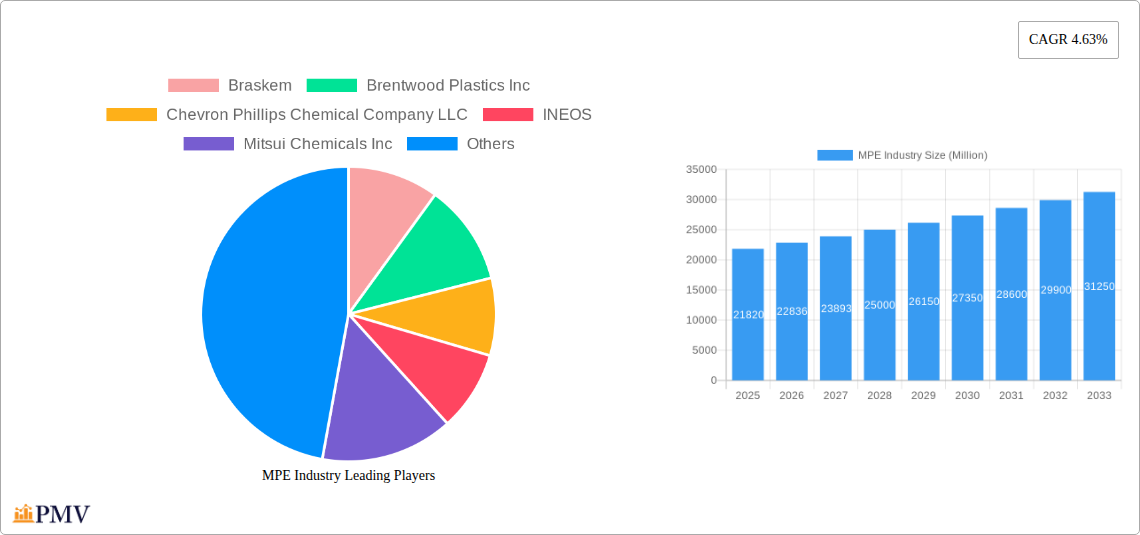
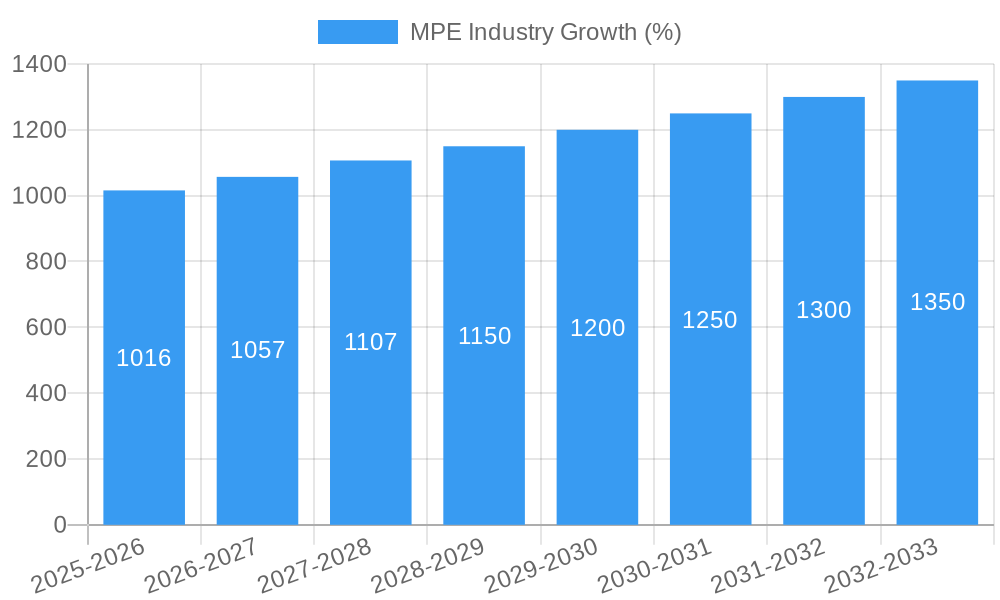
The global Metallocene Polyethylene (mPE) market, valued at $21.82 billion in 2025, is projected to experience robust growth, driven by increasing demand from diverse end-use sectors. The market's Compound Annual Growth Rate (CAGR) of 4.63% from 2025 to 2033 signifies a significant expansion opportunity. Key drivers include the superior properties of mPE, such as its high strength, improved processability, and enhanced resistance to environmental stress cracking, making it ideal for applications demanding high performance. Growing applications in films and packaging, particularly in flexible packaging for food and consumer goods, are fueling market growth. Furthermore, the increasing adoption of mPE in infrastructure projects, such as pipes and geomembranes, is contributing significantly to market expansion. While raw material price fluctuations and competition from alternative polymers present potential restraints, the continuous innovation in mPE production technologies and the exploration of new applications are expected to offset these challenges.
The competitive landscape is marked by both established players like Braskem, INEOS, and SABIC, and specialized manufacturers focusing on niche applications. Strategic partnerships, mergers, and acquisitions are likely to reshape the market structure in the coming years. Regional growth is anticipated to vary, with developed economies in North America and Europe showing steady growth, while emerging markets in Asia-Pacific are expected to witness faster expansion driven by rapid industrialization and increasing consumer demand. Product segmentation will likely see a shift towards higher value-added products and specialized grades tailored to specific application requirements. Over the forecast period, the mPE market is poised for continuous expansion, driven by technological advancements and the sustained demand from a broad range of industries.
Comprehensive MPE Industry Report: 2019-2033 Forecast
This detailed report provides a comprehensive analysis of the global MPE (Metallocene Polyethylene) industry, offering invaluable insights for stakeholders seeking to navigate this dynamic market. The study period spans from 2019 to 2033, with 2025 serving as the base and estimated year. The forecast period covers 2025-2033, and the historical period analyzed is 2019-2024. This report incorporates data and analysis across various segments, providing a 360-degree view of the MPE market landscape. The report features in-depth analysis of key players like Braskem, Brentwood Plastics Inc, Chevron Phillips Chemical Company LLC, INEOS, Mitsui Chemicals Inc, Prime Polymer Co Ltd, SABIC, TotalEnergies, Univation Technologies LLC, and W R Grace & Co -Conn, though this list is not exhaustive.
MPE Industry Market Structure & Competitive Dynamics
This section analyzes the competitive landscape of the MPE industry, assessing market concentration, innovation ecosystems, regulatory frameworks, product substitutes, end-user trends, and mergers & acquisitions (M&A) activities. The global MPE market is moderately concentrated, with several major players holding significant market share. However, the presence of smaller niche players indicates opportunities for innovation and market disruption. The industry is characterized by a dynamic innovation ecosystem, with ongoing R&D efforts focused on improving MPE properties, expanding applications, and developing sustainable production methods.
- Market Concentration: The top five players collectively hold an estimated xx% market share in 2025.
- M&A Activity: In recent years, there have been several significant M&A deals valued at over $xx Million, reflecting industry consolidation and expansion efforts. These deals have primarily focused on expanding product portfolios and geographical reach.
- Regulatory Landscape: Government regulations concerning sustainability and environmental impact are shaping industry practices, pushing for the development of more eco-friendly MPE production processes.
- Product Substitutes: Competition from other polyethylene types and alternative materials necessitates continuous innovation to maintain market share.
- End-User Trends: Growing demand from sectors like flexible packaging, automotive, and solar energy is driving MPE market growth.
MPE Industry Industry Trends & Insights
This section delves into the key trends shaping the MPE industry, including market growth drivers, technological disruptions, consumer preferences, and competitive dynamics. The global MPE market is projected to exhibit a CAGR of xx% during the forecast period (2025-2033), driven by increasing demand from diverse end-use applications. Technological advancements, such as the development of advanced catalysts and improved production processes, are contributing to enhanced MPE properties and reduced production costs. Consumer preferences for sustainable and recyclable materials are influencing product development strategies, with a focus on reducing environmental impact. The competitive dynamics are characterized by ongoing innovation, strategic partnerships, and capacity expansion efforts. Market penetration of MPE in new applications is expected to increase significantly over the coming years, reaching xx% by 2033.
Dominant Markets & Segments in MPE Industry
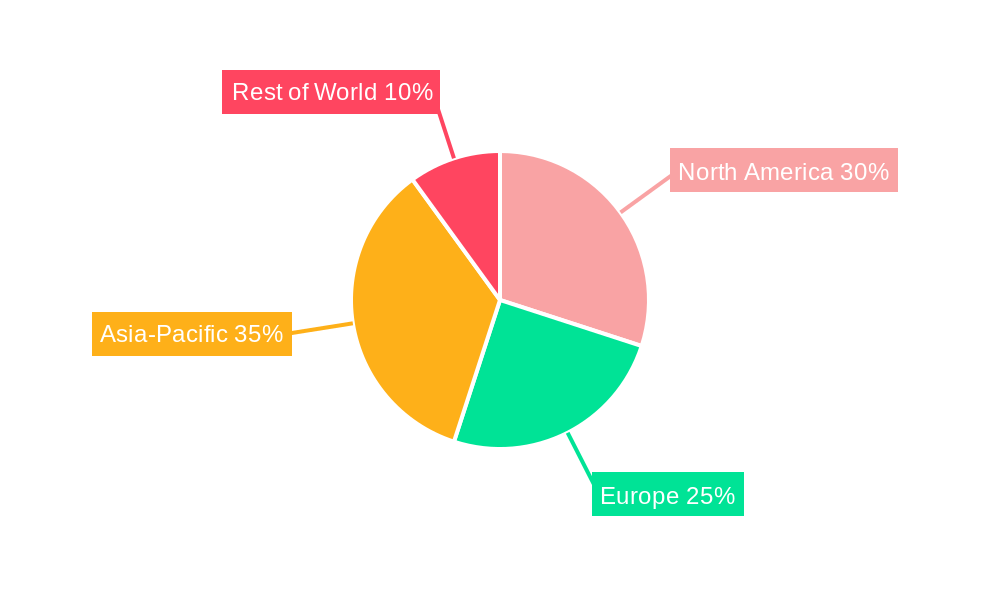
This section identifies the leading regions, countries, and segments within the MPE industry. Asia-Pacific is currently the dominant market, fueled by robust economic growth, expanding industrialization, and increasing consumer spending.
- Key Drivers in Asia-Pacific:
- Favorable government policies supporting industrial growth.
- Rapid expansion of the packaging and automotive industries.
- Growing demand for sustainable and recyclable materials.
- Dominance Analysis: The dominance of Asia-Pacific is expected to continue throughout the forecast period, although other regions, such as North America and Europe, are also projected to experience considerable growth. This growth will be driven by factors such as infrastructure development, increased investments in renewable energy projects (driving demand in the solar panel industry), and technological advancements.
MPE Industry Product Innovations
Recent product innovations in the MPE industry have focused on enhancing material properties, such as improved strength, flexibility, and barrier characteristics. These innovations enable MPE to cater to a wider range of applications, improving its market fit and competitive advantage. The development of new catalysts and processing techniques has also resulted in more cost-effective and sustainable production methods.
Report Segmentation & Scope
This report segments the MPE market based on several key parameters, including product type (e.g., HDPE, LLDPE), application (e.g., films, pipes, injection molding), and region (e.g., Asia-Pacific, North America, Europe). Each segment's growth projection, market size, and competitive dynamics are comprehensively analyzed. The report also encompasses detailed analysis of upstream and downstream value chains.
Key Drivers of MPE Industry Growth
Several factors are driving the growth of the MPE industry. These include: increasing demand from various end-use sectors (packaging, automotive, healthcare), technological advancements leading to improved material properties and lower production costs, and favorable government policies supporting the adoption of sustainable materials.
Challenges in the MPE Industry Sector
The MPE industry faces challenges such as fluctuating raw material prices, intense competition from alternative materials, and stringent environmental regulations. These factors can impact production costs and profitability. Supply chain disruptions also pose a significant risk.
Leading Players in the MPE Industry Market
- Braskem
- Brentwood Plastics Inc
- Chevron Phillips Chemical Company LLC
- INEOS
- Mitsui Chemicals Inc
- Prime Polymer Co Ltd
- SABIC
- TotalEnergies
- Univation Technologies LLC
- W R Grace & Co -Conn
Key Developments in MPE Industry Sector
- August 2022: SABIC SK Nexlene Company (SSNC), a joint venture of SABIC and SK Geo Centric, announced plans to expand the capacity of its Ulsan plant to produce mPE to address the growing demand from applications in solar panels, vehicles, footwear, and flexible packaging. This expansion signifies the industry's commitment to meeting the increasing demand for sustainable, high-performance materials.
Strategic MPE Industry Market Outlook
The future of the MPE industry appears bright, with significant growth potential driven by continuous innovation, expanding applications, and increasing demand for sustainable materials. Strategic opportunities lie in developing advanced MPE grades with enhanced properties, exploring new applications, and optimizing production processes to reduce environmental impact. Companies that can successfully navigate the challenges and capitalize on these opportunities are poised for substantial growth in the coming years.
MPE Industry Segmentation
-
1. Type
- 1.1. Metalloc
- 1.2. Metallocene High-density Polyethylene (mHDPE)
- 1.3. Other Ty
-
2. Application
- 2.1. Films
- 2.2. Sheets
- 2.3. Other Applications
-
3. End-User Industry
- 3.1. Packaging
- 3.2. Agriculture
- 3.3. Automotive
- 3.4. Building and Construction
- 3.5. Other End-User Industries
MPE Industry Segmentation By Geography
-
1. Asia Pacific
- 1.1. China
- 1.2. India
- 1.3. Japan
- 1.4. South Korea
- 1.5. Rest of Asia Pacific
-
2. North America
- 2.1. United States
- 2.2. Canada
- 2.3. Mexico
-
3. Europe
- 3.1. Germany
- 3.2. United Kingdom
- 3.3. Italy
- 3.4. France
- 3.5. Rest of Europe
-
4. South America
- 4.1. Brazil
- 4.2. Argentina
- 4.3. Rest of South America
- 5. Middle East
-
6. Saudi Arabia
- 6.1. South Africa
- 6.2. Rest of Middle East
MPE Industry REPORT HIGHLIGHTS
| Aspects | Details |
|---|---|
| Study Period | 2019-2033 |
| Base Year | 2024 |
| Estimated Year | 2025 |
| Forecast Period | 2025-2033 |
| Historical Period | 2019-2024 |
| Growth Rate | CAGR of 4.63% from 2019-2033 |
| Segmentation |
|
Table of Contents
- 1. Introduction
- 1.1. Research Scope
- 1.2. Market Segmentation
- 1.3. Research Methodology
- 1.4. Definitions and Assumptions
- 2. Executive Summary
- 2.1. Introduction
- 3. Market Dynamics
- 3.1. Introduction
- 3.2. Market Drivers
- 3.2.1. Growing Demand for mPE from Various End User Industries; Surge in Adoption of Films and Sheets in Packaging Industry; Other Drivers
- 3.3. Market Restrains
- 3.3.1. Growing Demand for mPE from Various End User Industries; Surge in Adoption of Films and Sheets in Packaging Industry; Other Drivers
- 3.4. Market Trends
- 3.4.1. Increasing Demand for mPE from Packaging Industry
- 4. Market Factor Analysis
- 4.1. Porters Five Forces
- 4.2. Supply/Value Chain
- 4.3. PESTEL analysis
- 4.4. Market Entropy
- 4.5. Patent/Trademark Analysis
- 5. Global MPE Industry Analysis, Insights and Forecast, 2019-2031
- 5.1. Market Analysis, Insights and Forecast - by Type
- 5.1.1. Metalloc
- 5.1.2. Metallocene High-density Polyethylene (mHDPE)
- 5.1.3. Other Ty
- 5.2. Market Analysis, Insights and Forecast - by Application
- 5.2.1. Films
- 5.2.2. Sheets
- 5.2.3. Other Applications
- 5.3. Market Analysis, Insights and Forecast - by End-User Industry
- 5.3.1. Packaging
- 5.3.2. Agriculture
- 5.3.3. Automotive
- 5.3.4. Building and Construction
- 5.3.5. Other End-User Industries
- 5.4. Market Analysis, Insights and Forecast - by Region
- 5.4.1. Asia Pacific
- 5.4.2. North America
- 5.4.3. Europe
- 5.4.4. South America
- 5.4.5. Middle East
- 5.4.6. Saudi Arabia
- 5.1. Market Analysis, Insights and Forecast - by Type
- 6. Asia Pacific MPE Industry Analysis, Insights and Forecast, 2019-2031
- 6.1. Market Analysis, Insights and Forecast - by Type
- 6.1.1. Metalloc
- 6.1.2. Metallocene High-density Polyethylene (mHDPE)
- 6.1.3. Other Ty
- 6.2. Market Analysis, Insights and Forecast - by Application
- 6.2.1. Films
- 6.2.2. Sheets
- 6.2.3. Other Applications
- 6.3. Market Analysis, Insights and Forecast - by End-User Industry
- 6.3.1. Packaging
- 6.3.2. Agriculture
- 6.3.3. Automotive
- 6.3.4. Building and Construction
- 6.3.5. Other End-User Industries
- 6.1. Market Analysis, Insights and Forecast - by Type
- 7. North America MPE Industry Analysis, Insights and Forecast, 2019-2031
- 7.1. Market Analysis, Insights and Forecast - by Type
- 7.1.1. Metalloc
- 7.1.2. Metallocene High-density Polyethylene (mHDPE)
- 7.1.3. Other Ty
- 7.2. Market Analysis, Insights and Forecast - by Application
- 7.2.1. Films
- 7.2.2. Sheets
- 7.2.3. Other Applications
- 7.3. Market Analysis, Insights and Forecast - by End-User Industry
- 7.3.1. Packaging
- 7.3.2. Agriculture
- 7.3.3. Automotive
- 7.3.4. Building and Construction
- 7.3.5. Other End-User Industries
- 7.1. Market Analysis, Insights and Forecast - by Type
- 8. Europe MPE Industry Analysis, Insights and Forecast, 2019-2031
- 8.1. Market Analysis, Insights and Forecast - by Type
- 8.1.1. Metalloc
- 8.1.2. Metallocene High-density Polyethylene (mHDPE)
- 8.1.3. Other Ty
- 8.2. Market Analysis, Insights and Forecast - by Application
- 8.2.1. Films
- 8.2.2. Sheets
- 8.2.3. Other Applications
- 8.3. Market Analysis, Insights and Forecast - by End-User Industry
- 8.3.1. Packaging
- 8.3.2. Agriculture
- 8.3.3. Automotive
- 8.3.4. Building and Construction
- 8.3.5. Other End-User Industries
- 8.1. Market Analysis, Insights and Forecast - by Type
- 9. South America MPE Industry Analysis, Insights and Forecast, 2019-2031
- 9.1. Market Analysis, Insights and Forecast - by Type
- 9.1.1. Metalloc
- 9.1.2. Metallocene High-density Polyethylene (mHDPE)
- 9.1.3. Other Ty
- 9.2. Market Analysis, Insights and Forecast - by Application
- 9.2.1. Films
- 9.2.2. Sheets
- 9.2.3. Other Applications
- 9.3. Market Analysis, Insights and Forecast - by End-User Industry
- 9.3.1. Packaging
- 9.3.2. Agriculture
- 9.3.3. Automotive
- 9.3.4. Building and Construction
- 9.3.5. Other End-User Industries
- 9.1. Market Analysis, Insights and Forecast - by Type
- 10. Middle East MPE Industry Analysis, Insights and Forecast, 2019-2031
- 10.1. Market Analysis, Insights and Forecast - by Type
- 10.1.1. Metalloc
- 10.1.2. Metallocene High-density Polyethylene (mHDPE)
- 10.1.3. Other Ty
- 10.2. Market Analysis, Insights and Forecast - by Application
- 10.2.1. Films
- 10.2.2. Sheets
- 10.2.3. Other Applications
- 10.3. Market Analysis, Insights and Forecast - by End-User Industry
- 10.3.1. Packaging
- 10.3.2. Agriculture
- 10.3.3. Automotive
- 10.3.4. Building and Construction
- 10.3.5. Other End-User Industries
- 10.1. Market Analysis, Insights and Forecast - by Type
- 11. Saudi Arabia MPE Industry Analysis, Insights and Forecast, 2019-2031
- 11.1. Market Analysis, Insights and Forecast - by Type
- 11.1.1. Metalloc
- 11.1.2. Metallocene High-density Polyethylene (mHDPE)
- 11.1.3. Other Ty
- 11.2. Market Analysis, Insights and Forecast - by Application
- 11.2.1. Films
- 11.2.2. Sheets
- 11.2.3. Other Applications
- 11.3. Market Analysis, Insights and Forecast - by End-User Industry
- 11.3.1. Packaging
- 11.3.2. Agriculture
- 11.3.3. Automotive
- 11.3.4. Building and Construction
- 11.3.5. Other End-User Industries
- 11.1. Market Analysis, Insights and Forecast - by Type
- 12. Competitive Analysis
- 12.1. Global Market Share Analysis 2024
- 12.2. Company Profiles
- 12.2.1 Braskem
- 12.2.1.1. Overview
- 12.2.1.2. Products
- 12.2.1.3. SWOT Analysis
- 12.2.1.4. Recent Developments
- 12.2.1.5. Financials (Based on Availability)
- 12.2.2 Brentwood Plastics Inc
- 12.2.2.1. Overview
- 12.2.2.2. Products
- 12.2.2.3. SWOT Analysis
- 12.2.2.4. Recent Developments
- 12.2.2.5. Financials (Based on Availability)
- 12.2.3 Chevron Phillips Chemical Company LLC
- 12.2.3.1. Overview
- 12.2.3.2. Products
- 12.2.3.3. SWOT Analysis
- 12.2.3.4. Recent Developments
- 12.2.3.5. Financials (Based on Availability)
- 12.2.4 INEOS
- 12.2.4.1. Overview
- 12.2.4.2. Products
- 12.2.4.3. SWOT Analysis
- 12.2.4.4. Recent Developments
- 12.2.4.5. Financials (Based on Availability)
- 12.2.5 Mitsui Chemicals Inc
- 12.2.5.1. Overview
- 12.2.5.2. Products
- 12.2.5.3. SWOT Analysis
- 12.2.5.4. Recent Developments
- 12.2.5.5. Financials (Based on Availability)
- 12.2.6 Prime Polymer Co Ltd
- 12.2.6.1. Overview
- 12.2.6.2. Products
- 12.2.6.3. SWOT Analysis
- 12.2.6.4. Recent Developments
- 12.2.6.5. Financials (Based on Availability)
- 12.2.7 SABIC
- 12.2.7.1. Overview
- 12.2.7.2. Products
- 12.2.7.3. SWOT Analysis
- 12.2.7.4. Recent Developments
- 12.2.7.5. Financials (Based on Availability)
- 12.2.8 TotalEnergies
- 12.2.8.1. Overview
- 12.2.8.2. Products
- 12.2.8.3. SWOT Analysis
- 12.2.8.4. Recent Developments
- 12.2.8.5. Financials (Based on Availability)
- 12.2.9 Univation Technologies LLC
- 12.2.9.1. Overview
- 12.2.9.2. Products
- 12.2.9.3. SWOT Analysis
- 12.2.9.4. Recent Developments
- 12.2.9.5. Financials (Based on Availability)
- 12.2.10 W R Grace & Co -Conn*List Not Exhaustive
- 12.2.10.1. Overview
- 12.2.10.2. Products
- 12.2.10.3. SWOT Analysis
- 12.2.10.4. Recent Developments
- 12.2.10.5. Financials (Based on Availability)
- 12.2.1 Braskem
List of Figures
- Figure 1: Global MPE Industry Revenue Breakdown (Million, %) by Region 2024 & 2032
- Figure 2: Global MPE Industry Volume Breakdown (Billion, %) by Region 2024 & 2032
- Figure 3: Asia Pacific MPE Industry Revenue (Million), by Type 2024 & 2032
- Figure 4: Asia Pacific MPE Industry Volume (Billion), by Type 2024 & 2032
- Figure 5: Asia Pacific MPE Industry Revenue Share (%), by Type 2024 & 2032
- Figure 6: Asia Pacific MPE Industry Volume Share (%), by Type 2024 & 2032
- Figure 7: Asia Pacific MPE Industry Revenue (Million), by Application 2024 & 2032
- Figure 8: Asia Pacific MPE Industry Volume (Billion), by Application 2024 & 2032
- Figure 9: Asia Pacific MPE Industry Revenue Share (%), by Application 2024 & 2032
- Figure 10: Asia Pacific MPE Industry Volume Share (%), by Application 2024 & 2032
- Figure 11: Asia Pacific MPE Industry Revenue (Million), by End-User Industry 2024 & 2032
- Figure 12: Asia Pacific MPE Industry Volume (Billion), by End-User Industry 2024 & 2032
- Figure 13: Asia Pacific MPE Industry Revenue Share (%), by End-User Industry 2024 & 2032
- Figure 14: Asia Pacific MPE Industry Volume Share (%), by End-User Industry 2024 & 2032
- Figure 15: Asia Pacific MPE Industry Revenue (Million), by Country 2024 & 2032
- Figure 16: Asia Pacific MPE Industry Volume (Billion), by Country 2024 & 2032
- Figure 17: Asia Pacific MPE Industry Revenue Share (%), by Country 2024 & 2032
- Figure 18: Asia Pacific MPE Industry Volume Share (%), by Country 2024 & 2032
- Figure 19: North America MPE Industry Revenue (Million), by Type 2024 & 2032
- Figure 20: North America MPE Industry Volume (Billion), by Type 2024 & 2032
- Figure 21: North America MPE Industry Revenue Share (%), by Type 2024 & 2032
- Figure 22: North America MPE Industry Volume Share (%), by Type 2024 & 2032
- Figure 23: North America MPE Industry Revenue (Million), by Application 2024 & 2032
- Figure 24: North America MPE Industry Volume (Billion), by Application 2024 & 2032
- Figure 25: North America MPE Industry Revenue Share (%), by Application 2024 & 2032
- Figure 26: North America MPE Industry Volume Share (%), by Application 2024 & 2032
- Figure 27: North America MPE Industry Revenue (Million), by End-User Industry 2024 & 2032
- Figure 28: North America MPE Industry Volume (Billion), by End-User Industry 2024 & 2032
- Figure 29: North America MPE Industry Revenue Share (%), by End-User Industry 2024 & 2032
- Figure 30: North America MPE Industry Volume Share (%), by End-User Industry 2024 & 2032
- Figure 31: North America MPE Industry Revenue (Million), by Country 2024 & 2032
- Figure 32: North America MPE Industry Volume (Billion), by Country 2024 & 2032
- Figure 33: North America MPE Industry Revenue Share (%), by Country 2024 & 2032
- Figure 34: North America MPE Industry Volume Share (%), by Country 2024 & 2032
- Figure 35: Europe MPE Industry Revenue (Million), by Type 2024 & 2032
- Figure 36: Europe MPE Industry Volume (Billion), by Type 2024 & 2032
- Figure 37: Europe MPE Industry Revenue Share (%), by Type 2024 & 2032
- Figure 38: Europe MPE Industry Volume Share (%), by Type 2024 & 2032
- Figure 39: Europe MPE Industry Revenue (Million), by Application 2024 & 2032
- Figure 40: Europe MPE Industry Volume (Billion), by Application 2024 & 2032
- Figure 41: Europe MPE Industry Revenue Share (%), by Application 2024 & 2032
- Figure 42: Europe MPE Industry Volume Share (%), by Application 2024 & 2032
- Figure 43: Europe MPE Industry Revenue (Million), by End-User Industry 2024 & 2032
- Figure 44: Europe MPE Industry Volume (Billion), by End-User Industry 2024 & 2032
- Figure 45: Europe MPE Industry Revenue Share (%), by End-User Industry 2024 & 2032
- Figure 46: Europe MPE Industry Volume Share (%), by End-User Industry 2024 & 2032
- Figure 47: Europe MPE Industry Revenue (Million), by Country 2024 & 2032
- Figure 48: Europe MPE Industry Volume (Billion), by Country 2024 & 2032
- Figure 49: Europe MPE Industry Revenue Share (%), by Country 2024 & 2032
- Figure 50: Europe MPE Industry Volume Share (%), by Country 2024 & 2032
- Figure 51: South America MPE Industry Revenue (Million), by Type 2024 & 2032
- Figure 52: South America MPE Industry Volume (Billion), by Type 2024 & 2032
- Figure 53: South America MPE Industry Revenue Share (%), by Type 2024 & 2032
- Figure 54: South America MPE Industry Volume Share (%), by Type 2024 & 2032
- Figure 55: South America MPE Industry Revenue (Million), by Application 2024 & 2032
- Figure 56: South America MPE Industry Volume (Billion), by Application 2024 & 2032
- Figure 57: South America MPE Industry Revenue Share (%), by Application 2024 & 2032
- Figure 58: South America MPE Industry Volume Share (%), by Application 2024 & 2032
- Figure 59: South America MPE Industry Revenue (Million), by End-User Industry 2024 & 2032
- Figure 60: South America MPE Industry Volume (Billion), by End-User Industry 2024 & 2032
- Figure 61: South America MPE Industry Revenue Share (%), by End-User Industry 2024 & 2032
- Figure 62: South America MPE Industry Volume Share (%), by End-User Industry 2024 & 2032
- Figure 63: South America MPE Industry Revenue (Million), by Country 2024 & 2032
- Figure 64: South America MPE Industry Volume (Billion), by Country 2024 & 2032
- Figure 65: South America MPE Industry Revenue Share (%), by Country 2024 & 2032
- Figure 66: South America MPE Industry Volume Share (%), by Country 2024 & 2032
- Figure 67: Middle East MPE Industry Revenue (Million), by Type 2024 & 2032
- Figure 68: Middle East MPE Industry Volume (Billion), by Type 2024 & 2032
- Figure 69: Middle East MPE Industry Revenue Share (%), by Type 2024 & 2032
- Figure 70: Middle East MPE Industry Volume Share (%), by Type 2024 & 2032
- Figure 71: Middle East MPE Industry Revenue (Million), by Application 2024 & 2032
- Figure 72: Middle East MPE Industry Volume (Billion), by Application 2024 & 2032
- Figure 73: Middle East MPE Industry Revenue Share (%), by Application 2024 & 2032
- Figure 74: Middle East MPE Industry Volume Share (%), by Application 2024 & 2032
- Figure 75: Middle East MPE Industry Revenue (Million), by End-User Industry 2024 & 2032
- Figure 76: Middle East MPE Industry Volume (Billion), by End-User Industry 2024 & 2032
- Figure 77: Middle East MPE Industry Revenue Share (%), by End-User Industry 2024 & 2032
- Figure 78: Middle East MPE Industry Volume Share (%), by End-User Industry 2024 & 2032
- Figure 79: Middle East MPE Industry Revenue (Million), by Country 2024 & 2032
- Figure 80: Middle East MPE Industry Volume (Billion), by Country 2024 & 2032
- Figure 81: Middle East MPE Industry Revenue Share (%), by Country 2024 & 2032
- Figure 82: Middle East MPE Industry Volume Share (%), by Country 2024 & 2032
- Figure 83: Saudi Arabia MPE Industry Revenue (Million), by Type 2024 & 2032
- Figure 84: Saudi Arabia MPE Industry Volume (Billion), by Type 2024 & 2032
- Figure 85: Saudi Arabia MPE Industry Revenue Share (%), by Type 2024 & 2032
- Figure 86: Saudi Arabia MPE Industry Volume Share (%), by Type 2024 & 2032
- Figure 87: Saudi Arabia MPE Industry Revenue (Million), by Application 2024 & 2032
- Figure 88: Saudi Arabia MPE Industry Volume (Billion), by Application 2024 & 2032
- Figure 89: Saudi Arabia MPE Industry Revenue Share (%), by Application 2024 & 2032
- Figure 90: Saudi Arabia MPE Industry Volume Share (%), by Application 2024 & 2032
- Figure 91: Saudi Arabia MPE Industry Revenue (Million), by End-User Industry 2024 & 2032
- Figure 92: Saudi Arabia MPE Industry Volume (Billion), by End-User Industry 2024 & 2032
- Figure 93: Saudi Arabia MPE Industry Revenue Share (%), by End-User Industry 2024 & 2032
- Figure 94: Saudi Arabia MPE Industry Volume Share (%), by End-User Industry 2024 & 2032
- Figure 95: Saudi Arabia MPE Industry Revenue (Million), by Country 2024 & 2032
- Figure 96: Saudi Arabia MPE Industry Volume (Billion), by Country 2024 & 2032
- Figure 97: Saudi Arabia MPE Industry Revenue Share (%), by Country 2024 & 2032
- Figure 98: Saudi Arabia MPE Industry Volume Share (%), by Country 2024 & 2032
List of Tables
- Table 1: Global MPE Industry Revenue Million Forecast, by Region 2019 & 2032
- Table 2: Global MPE Industry Volume Billion Forecast, by Region 2019 & 2032
- Table 3: Global MPE Industry Revenue Million Forecast, by Type 2019 & 2032
- Table 4: Global MPE Industry Volume Billion Forecast, by Type 2019 & 2032
- Table 5: Global MPE Industry Revenue Million Forecast, by Application 2019 & 2032
- Table 6: Global MPE Industry Volume Billion Forecast, by Application 2019 & 2032
- Table 7: Global MPE Industry Revenue Million Forecast, by End-User Industry 2019 & 2032
- Table 8: Global MPE Industry Volume Billion Forecast, by End-User Industry 2019 & 2032
- Table 9: Global MPE Industry Revenue Million Forecast, by Region 2019 & 2032
- Table 10: Global MPE Industry Volume Billion Forecast, by Region 2019 & 2032
- Table 11: Global MPE Industry Revenue Million Forecast, by Type 2019 & 2032
- Table 12: Global MPE Industry Volume Billion Forecast, by Type 2019 & 2032
- Table 13: Global MPE Industry Revenue Million Forecast, by Application 2019 & 2032
- Table 14: Global MPE Industry Volume Billion Forecast, by Application 2019 & 2032
- Table 15: Global MPE Industry Revenue Million Forecast, by End-User Industry 2019 & 2032
- Table 16: Global MPE Industry Volume Billion Forecast, by End-User Industry 2019 & 2032
- Table 17: Global MPE Industry Revenue Million Forecast, by Country 2019 & 2032
- Table 18: Global MPE Industry Volume Billion Forecast, by Country 2019 & 2032
- Table 19: China MPE Industry Revenue (Million) Forecast, by Application 2019 & 2032
- Table 20: China MPE Industry Volume (Billion) Forecast, by Application 2019 & 2032
- Table 21: India MPE Industry Revenue (Million) Forecast, by Application 2019 & 2032
- Table 22: India MPE Industry Volume (Billion) Forecast, by Application 2019 & 2032
- Table 23: Japan MPE Industry Revenue (Million) Forecast, by Application 2019 & 2032
- Table 24: Japan MPE Industry Volume (Billion) Forecast, by Application 2019 & 2032
- Table 25: South Korea MPE Industry Revenue (Million) Forecast, by Application 2019 & 2032
- Table 26: South Korea MPE Industry Volume (Billion) Forecast, by Application 2019 & 2032
- Table 27: Rest of Asia Pacific MPE Industry Revenue (Million) Forecast, by Application 2019 & 2032
- Table 28: Rest of Asia Pacific MPE Industry Volume (Billion) Forecast, by Application 2019 & 2032
- Table 29: Global MPE Industry Revenue Million Forecast, by Type 2019 & 2032
- Table 30: Global MPE Industry Volume Billion Forecast, by Type 2019 & 2032
- Table 31: Global MPE Industry Revenue Million Forecast, by Application 2019 & 2032
- Table 32: Global MPE Industry Volume Billion Forecast, by Application 2019 & 2032
- Table 33: Global MPE Industry Revenue Million Forecast, by End-User Industry 2019 & 2032
- Table 34: Global MPE Industry Volume Billion Forecast, by End-User Industry 2019 & 2032
- Table 35: Global MPE Industry Revenue Million Forecast, by Country 2019 & 2032
- Table 36: Global MPE Industry Volume Billion Forecast, by Country 2019 & 2032
- Table 37: United States MPE Industry Revenue (Million) Forecast, by Application 2019 & 2032
- Table 38: United States MPE Industry Volume (Billion) Forecast, by Application 2019 & 2032
- Table 39: Canada MPE Industry Revenue (Million) Forecast, by Application 2019 & 2032
- Table 40: Canada MPE Industry Volume (Billion) Forecast, by Application 2019 & 2032
- Table 41: Mexico MPE Industry Revenue (Million) Forecast, by Application 2019 & 2032
- Table 42: Mexico MPE Industry Volume (Billion) Forecast, by Application 2019 & 2032
- Table 43: Global MPE Industry Revenue Million Forecast, by Type 2019 & 2032
- Table 44: Global MPE Industry Volume Billion Forecast, by Type 2019 & 2032
- Table 45: Global MPE Industry Revenue Million Forecast, by Application 2019 & 2032
- Table 46: Global MPE Industry Volume Billion Forecast, by Application 2019 & 2032
- Table 47: Global MPE Industry Revenue Million Forecast, by End-User Industry 2019 & 2032
- Table 48: Global MPE Industry Volume Billion Forecast, by End-User Industry 2019 & 2032
- Table 49: Global MPE Industry Revenue Million Forecast, by Country 2019 & 2032
- Table 50: Global MPE Industry Volume Billion Forecast, by Country 2019 & 2032
- Table 51: Germany MPE Industry Revenue (Million) Forecast, by Application 2019 & 2032
- Table 52: Germany MPE Industry Volume (Billion) Forecast, by Application 2019 & 2032
- Table 53: United Kingdom MPE Industry Revenue (Million) Forecast, by Application 2019 & 2032
- Table 54: United Kingdom MPE Industry Volume (Billion) Forecast, by Application 2019 & 2032
- Table 55: Italy MPE Industry Revenue (Million) Forecast, by Application 2019 & 2032
- Table 56: Italy MPE Industry Volume (Billion) Forecast, by Application 2019 & 2032
- Table 57: France MPE Industry Revenue (Million) Forecast, by Application 2019 & 2032
- Table 58: France MPE Industry Volume (Billion) Forecast, by Application 2019 & 2032
- Table 59: Rest of Europe MPE Industry Revenue (Million) Forecast, by Application 2019 & 2032
- Table 60: Rest of Europe MPE Industry Volume (Billion) Forecast, by Application 2019 & 2032
- Table 61: Global MPE Industry Revenue Million Forecast, by Type 2019 & 2032
- Table 62: Global MPE Industry Volume Billion Forecast, by Type 2019 & 2032
- Table 63: Global MPE Industry Revenue Million Forecast, by Application 2019 & 2032
- Table 64: Global MPE Industry Volume Billion Forecast, by Application 2019 & 2032
- Table 65: Global MPE Industry Revenue Million Forecast, by End-User Industry 2019 & 2032
- Table 66: Global MPE Industry Volume Billion Forecast, by End-User Industry 2019 & 2032
- Table 67: Global MPE Industry Revenue Million Forecast, by Country 2019 & 2032
- Table 68: Global MPE Industry Volume Billion Forecast, by Country 2019 & 2032
- Table 69: Brazil MPE Industry Revenue (Million) Forecast, by Application 2019 & 2032
- Table 70: Brazil MPE Industry Volume (Billion) Forecast, by Application 2019 & 2032
- Table 71: Argentina MPE Industry Revenue (Million) Forecast, by Application 2019 & 2032
- Table 72: Argentina MPE Industry Volume (Billion) Forecast, by Application 2019 & 2032
- Table 73: Rest of South America MPE Industry Revenue (Million) Forecast, by Application 2019 & 2032
- Table 74: Rest of South America MPE Industry Volume (Billion) Forecast, by Application 2019 & 2032
- Table 75: Global MPE Industry Revenue Million Forecast, by Type 2019 & 2032
- Table 76: Global MPE Industry Volume Billion Forecast, by Type 2019 & 2032
- Table 77: Global MPE Industry Revenue Million Forecast, by Application 2019 & 2032
- Table 78: Global MPE Industry Volume Billion Forecast, by Application 2019 & 2032
- Table 79: Global MPE Industry Revenue Million Forecast, by End-User Industry 2019 & 2032
- Table 80: Global MPE Industry Volume Billion Forecast, by End-User Industry 2019 & 2032
- Table 81: Global MPE Industry Revenue Million Forecast, by Country 2019 & 2032
- Table 82: Global MPE Industry Volume Billion Forecast, by Country 2019 & 2032
- Table 83: Global MPE Industry Revenue Million Forecast, by Type 2019 & 2032
- Table 84: Global MPE Industry Volume Billion Forecast, by Type 2019 & 2032
- Table 85: Global MPE Industry Revenue Million Forecast, by Application 2019 & 2032
- Table 86: Global MPE Industry Volume Billion Forecast, by Application 2019 & 2032
- Table 87: Global MPE Industry Revenue Million Forecast, by End-User Industry 2019 & 2032
- Table 88: Global MPE Industry Volume Billion Forecast, by End-User Industry 2019 & 2032
- Table 89: Global MPE Industry Revenue Million Forecast, by Country 2019 & 2032
- Table 90: Global MPE Industry Volume Billion Forecast, by Country 2019 & 2032
- Table 91: South Africa MPE Industry Revenue (Million) Forecast, by Application 2019 & 2032
- Table 92: South Africa MPE Industry Volume (Billion) Forecast, by Application 2019 & 2032
- Table 93: Rest of Middle East MPE Industry Revenue (Million) Forecast, by Application 2019 & 2032
- Table 94: Rest of Middle East MPE Industry Volume (Billion) Forecast, by Application 2019 & 2032
Frequently Asked Questions
1. What is the projected Compound Annual Growth Rate (CAGR) of the MPE Industry?
The projected CAGR is approximately 4.63%.
2. Which companies are prominent players in the MPE Industry?
Key companies in the market include Braskem, Brentwood Plastics Inc, Chevron Phillips Chemical Company LLC, INEOS, Mitsui Chemicals Inc, Prime Polymer Co Ltd, SABIC, TotalEnergies, Univation Technologies LLC, W R Grace & Co -Conn*List Not Exhaustive.
3. What are the main segments of the MPE Industry?
The market segments include Type, Application, End-User Industry.
4. Can you provide details about the market size?
The market size is estimated to be USD 21.82 Million as of 2022.
5. What are some drivers contributing to market growth?
Growing Demand for mPE from Various End User Industries; Surge in Adoption of Films and Sheets in Packaging Industry; Other Drivers.
6. What are the notable trends driving market growth?
Increasing Demand for mPE from Packaging Industry.
7. Are there any restraints impacting market growth?
Growing Demand for mPE from Various End User Industries; Surge in Adoption of Films and Sheets in Packaging Industry; Other Drivers.
8. Can you provide examples of recent developments in the market?
August 2022: SABIC SK Nexlene Company (SSNC), a joint venture of SABIC and SK Geo Centric, announced plans to expand the capacity of its Ulsan plant to produce mPE to address the growing demand from applications in solar panels, vehicles, footwear, and flexible packaging.
9. What pricing options are available for accessing the report?
Pricing options include single-user, multi-user, and enterprise licenses priced at USD 4750, USD 5250, and USD 8750 respectively.
10. Is the market size provided in terms of value or volume?
The market size is provided in terms of value, measured in Million and volume, measured in Billion.
11. Are there any specific market keywords associated with the report?
Yes, the market keyword associated with the report is "MPE Industry," which aids in identifying and referencing the specific market segment covered.
12. How do I determine which pricing option suits my needs best?
The pricing options vary based on user requirements and access needs. Individual users may opt for single-user licenses, while businesses requiring broader access may choose multi-user or enterprise licenses for cost-effective access to the report.
13. Are there any additional resources or data provided in the MPE Industry report?
While the report offers comprehensive insights, it's advisable to review the specific contents or supplementary materials provided to ascertain if additional resources or data are available.
14. How can I stay updated on further developments or reports in the MPE Industry?
To stay informed about further developments, trends, and reports in the MPE Industry, consider subscribing to industry newsletters, following relevant companies and organizations, or regularly checking reputable industry news sources and publications.
Methodology
Step 1 - Identification of Relevant Samples Size from Population Database


Step 2 - Approaches for Defining Global Market Size (Value, Volume* & Price*)

Note*: In applicable scenarios
Step 3 - Data Sources
Primary Research
- Web Analytics
- Survey Reports
- Research Institute
- Latest Research Reports
- Opinion Leaders
Secondary Research
- Annual Reports
- White Paper
- Latest Press Release
- Industry Association
- Paid Database
- Investor Presentations

Step 4 - Data Triangulation
Involves using different sources of information in order to increase the validity of a study
These sources are likely to be stakeholders in a program - participants, other researchers, program staff, other community members, and so on.
Then we put all data in single framework & apply various statistical tools to find out the dynamic on the market.
During the analysis stage, feedback from the stakeholder groups would be compared to determine areas of agreement as well as areas of divergence


