

Key Insights
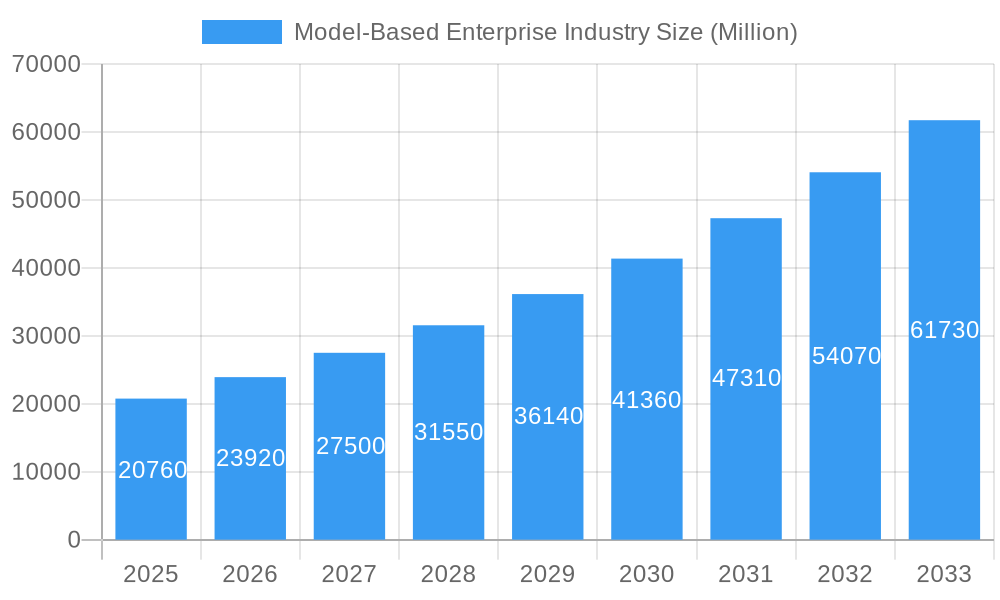
The Model-Based Enterprise (MBE) market is experiencing robust growth, projected to reach $20.76 billion in 2025 and maintain a Compound Annual Growth Rate (CAGR) of 15.42% from 2025 to 2033. This expansion is driven by several key factors. Increasing adoption of digital transformation initiatives across various industries, particularly in aerospace and defense, automotive, and construction, is a primary driver. These sectors are leveraging MBE solutions to streamline product development, improve collaboration, reduce costs, and enhance product quality. The shift towards cloud-based deployment models further fuels market growth, offering scalability, accessibility, and reduced IT infrastructure costs. Advancements in technologies like AI and machine learning are also contributing to the sophistication and efficiency of MBE solutions, attracting wider adoption. While the market faces some restraints, such as the high initial investment required for implementation and the need for skilled professionals, the long-term benefits of improved efficiency and reduced time-to-market outweigh these challenges. The market is segmented by offering (solutions and services), deployment mode (on-premise and cloud), and end-user industry. The North American region currently holds a significant market share, followed by Europe and the Asia-Pacific region, with the latter expected to exhibit strong growth in the coming years.
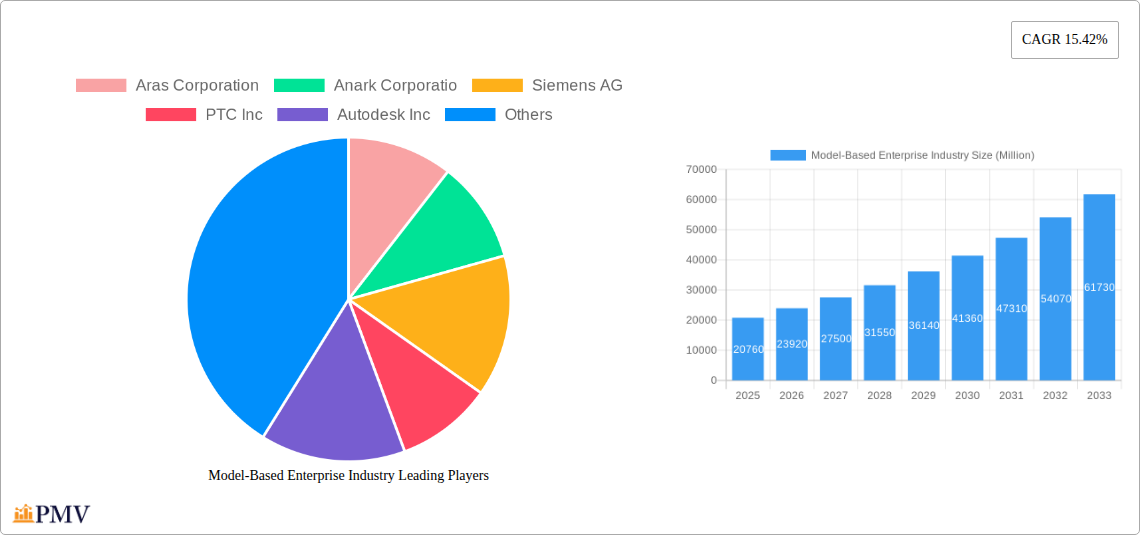
Model-Based Enterprise Industry Market Size (In Billion)
The competitive landscape is characterized by a mix of established players and emerging technology providers. Major companies like Aras Corporation, Siemens AG, PTC Inc., Autodesk Inc., Dassault Systèmes SE, and others are actively investing in research and development, strategic partnerships, and acquisitions to strengthen their market position. The increasing demand for integrated MBE solutions that seamlessly connect various stages of the product lifecycle will further shape the market dynamics in the coming years. The focus will be on solutions that provide enhanced interoperability, data management capabilities, and advanced simulation and analysis tools to address the complexity of modern product development. This continuous innovation and evolving technological landscape ensures sustained growth for the MBE market throughout the forecast period.
Model-Based Enterprise Industry Company Market Share
Model-Based Enterprise (MBE) Industry Market Report: 2019-2033
This comprehensive report provides a detailed analysis of the Model-Based Enterprise (MBE) industry, offering invaluable insights for businesses, investors, and researchers. Covering the period from 2019 to 2033, with a focus on 2025, this report delves into market structure, competitive dynamics, technological advancements, and future growth prospects. The report projects a market value exceeding $XX Million by 2033, representing a robust CAGR of XX% during the forecast period (2025-2033).
Model-Based Enterprise Industry Market Structure & Competitive Dynamics
The MBE market exhibits a moderately concentrated structure, with key players like Aras Corporation, Anark Corporation, Siemens AG, PTC Inc, Autodesk Inc, Oracle Corporation, Dassault Systèmes SE, General Electric Company, HCL Technologies Limited, and SAP SE holding significant market share. Market share estimations for 2025 suggest that the top 5 players collectively control approximately 60% of the market, with individual shares ranging from 8% to 15%. The industry is characterized by intense competition driven by innovation, particularly in areas such as AI-powered design optimization and cloud-based solutions. Regulatory frameworks, particularly concerning data security and interoperability, play a crucial role in shaping market dynamics. The prevalence of M&A activity, with deal values exceeding $XX Million annually in recent years, underlines the strategic importance of consolidation and technology acquisition in this rapidly evolving landscape.
- Market Concentration: High, with top 5 players controlling approximately 60% of the market in 2025.
- Innovation Ecosystems: Robust, with significant investments in R&D and collaborations across multiple technology domains.
- Regulatory Frameworks: Increasingly influential, focusing on data security and interoperability.
- M&A Activity: Significant, with annual deal values exceeding $XX Million.
- End-User Trends: Growing adoption of digitalization strategies and the need for enhanced efficiency.
Model-Based Enterprise Industry Trends & Insights
The MBE market is experiencing significant growth fueled by several key factors. The increasing adoption of digital twin technology is driving demand for advanced MBE solutions, allowing for improved product design, manufacturing, and lifecycle management. The global shift toward Industry 4.0 is further propelling growth, as companies seek to leverage data-driven insights to enhance efficiency and productivity. The market also benefits from the rising demand for cloud-based MBE solutions, offering enhanced scalability and accessibility. Technological advancements, including AI and machine learning, are continuously improving MBE capabilities, leading to increased market penetration and a projected CAGR of XX% during the forecast period (2025-2033). Furthermore, the growing emphasis on sustainable manufacturing practices is driving the adoption of MBE solutions designed to optimize resource utilization and reduce waste. Competitive dynamics are intense, with companies investing heavily in R&D and strategic partnerships to maintain a competitive edge. Consumer preferences are shifting toward integrated, scalable, and user-friendly solutions, demanding ongoing innovation in software design and user experience.
Dominant Markets & Segments in Model-Based Enterprise Industry
The Aerospace and Defense sector represents the dominant end-user segment in the MBE market, driven by the stringent requirements for safety, reliability, and complex systems management. The Automotive industry also demonstrates significant growth, fueled by the need for improved design processes and enhanced vehicle performance.
- By Offering: The Solutions segment holds the largest market share, owing to the increasing demand for comprehensive MBE platforms.
- By Deployment Mode: Cloud-based deployments are experiencing rapid growth due to their scalability and accessibility.
- By End User:
- Aerospace and Defense: High adoption driven by safety and reliability requirements. Key drivers include government regulations, stringent quality standards, and the complexity of aerospace and defense systems.
- Automotive: Significant growth due to the need for enhanced design processes and vehicle performance improvements. Key drivers include the increasing complexity of vehicle design, the demand for improved fuel efficiency, and the need to accelerate time-to-market.
- Construction: Growing adoption, spurred by the increasing demand for Building Information Modeling (BIM) solutions. Key drivers include improving project efficiency and safety, optimizing resource allocation, and adhering to regulations.
- Power and Energy: Steady growth driven by the need for efficient plant operation and maintenance. Key drivers include the need for optimized asset management and the demand for improved safety standards.
- Retail: Emerging growth potential, as retailers seek to improve supply chain efficiency and product development.
Model-Based Enterprise Industry Product Innovations
The Model-Based Enterprise (MBE) sector is experiencing a surge of groundbreaking innovations designed to revolutionize how products are conceived, designed, manufactured, and maintained. A primary focus area is the advancement of AI-powered design optimization, enabling engineers to explore a wider range of design possibilities, identify optimal solutions faster, and reduce development cycles. Complementing this, cloud-based collaboration platforms are becoming increasingly sophisticated, facilitating seamless real-time interaction among distributed teams, breaking down geographical barriers, and fostering greater transparency throughout the product lifecycle. Furthermore, enhanced data analytics capabilities are proving transformative, allowing businesses to extract deeper insights from their product data, identify trends, predict potential issues, and make more informed decisions.
The integration of digital twin technology with MBE solutions is a pivotal development. These digital counterparts of physical assets provide comprehensive simulation environments, enabling virtual testing, performance monitoring, and predictive maintenance strategies. This leads to significant improvements in operational efficiency, a reduction in downtime, and a more proactive approach to asset management, ultimately extending product lifecycles and minimizing costly failures. These advancements are not only streamlining product development and manufacturing processes but also offering a substantial competitive advantage to early adopters who can leverage these powerful tools to accelerate innovation and improve product quality.
The market is witnessing a remarkable convergence of various technologies, including advanced Computer-Aided Design (CAD), Product Lifecycle Management (PLM) systems, and the Internet of Things (IoT). This integration is creating more sophisticated, interconnected, and intelligent MBE solutions that offer a holistic view of the product from inception to end-of-life. The result is a more agile, efficient, and data-driven approach to product creation and management.
Report Segmentation & Scope
This report segments the MBE market by offering (Solutions, Services), deployment mode (On-premise, Cloud), and end-user (Aerospace and Defense, Automotive, Construction, Power and Energy, Retail, Other). Each segment's growth projections, market size estimations, and competitive dynamics are analyzed. The study period covers 2019-2033, with 2025 as the base and estimated year. The forecast period is 2025-2033, and the historical period is 2019-2024.
Key Drivers of Model-Based Enterprise Industry Growth
The key growth drivers include the increasing adoption of Industry 4.0 principles, rising demand for enhanced product development and lifecycle management, technological advancements such as AI and machine learning, and government initiatives promoting digitalization across various sectors. The growing emphasis on data-driven decision-making, coupled with the need for increased operational efficiency, fuels the adoption of MBE solutions.
Challenges in the Model-Based Enterprise Industry Sector
Challenges include the high initial investment costs associated with implementing MBE solutions, the need for skilled personnel to manage and operate these systems, and the complexities involved in integrating various software and data sources. Data security concerns and the need to comply with evolving regulatory frameworks present further challenges. These factors can potentially hinder the market's growth rate, particularly among smaller companies. The estimated impact of these challenges on overall market growth is a reduction of approximately XX% compared to the otherwise projected growth.
Leading Players in the Model-Based Enterprise Industry Market
- Aras Corporation
- Anark Corporation
- Siemens AG
- PTC Inc
- Autodesk Inc
- Oracle Corporation
- Dassault Systèmes SE
- General Electric Company
- HCL Technologies Limited
- SAP SE
Key Developments in Model-Based Enterprise Industry Sector
- September 2023: Tech Soft 3D unveiled the integration of its HOOPS Exchange technology with iBase-t's suite of solutions. This strategic partnership aims to significantly simplify the complexities involved in product development and maintenance workflows by enhancing data management capabilities, thereby streamlining the manufacturing process and improving data integrity.
- May 2023: Agacad bolstered its Building Information Modeling (BIM) offerings with the strategic acquisition of SBS Group. This move integrates SBS Group's robust tools for project planning and cost management into Agacad's existing portfolio, thereby strengthening Agacad's position within the construction sector by delivering a more comprehensive and end-to-end BIM solution.
Strategic Model-Based Enterprise Industry Market Outlook
The Model-Based Enterprise market is on a trajectory of sustained and robust growth. This expansion is fueled by a confluence of factors, including continuous technological advancements, an escalating demand for comprehensive digital transformation initiatives across a diverse range of industries, and the increasingly widespread adoption of agile, cloud-based solutions. Strategic opportunities abound for companies that can innovate in developing advanced AI-powered solutions, refine and improve their data analytics capabilities to derive deeper actionable insights, and foster strategic partnerships to broaden market reach and cater to the specific, evolving needs of various industry verticals.
The future market potential is immense, particularly within emerging economies that are actively embracing digitalization strategies and seeking to leapfrog traditional development paradigms. The ongoing evolution of MBE technologies promises to unlock new levels of efficiency, agility, and innovation, making it a critical component for businesses aiming to remain competitive in the global marketplace.
Model-Based Enterprise Industry Segmentation
-
1. Offering
- 1.1. Solutions
- 1.2. Services
-
2. Deployment Mode
- 2.1. On-premise
- 2.2. Cloud
-
3. End User
- 3.1. Aerospace and Defense
- 3.2. Automotive
- 3.3. Construction
- 3.4. Power and Energy
- 3.5. Retail
- 3.6. Other End Users
Model-Based Enterprise Industry Segmentation By Geography
- 1. North America
- 2. Europe
- 3. Asia Pacific
- 4. Latin America
- 5. Middle East and Africa
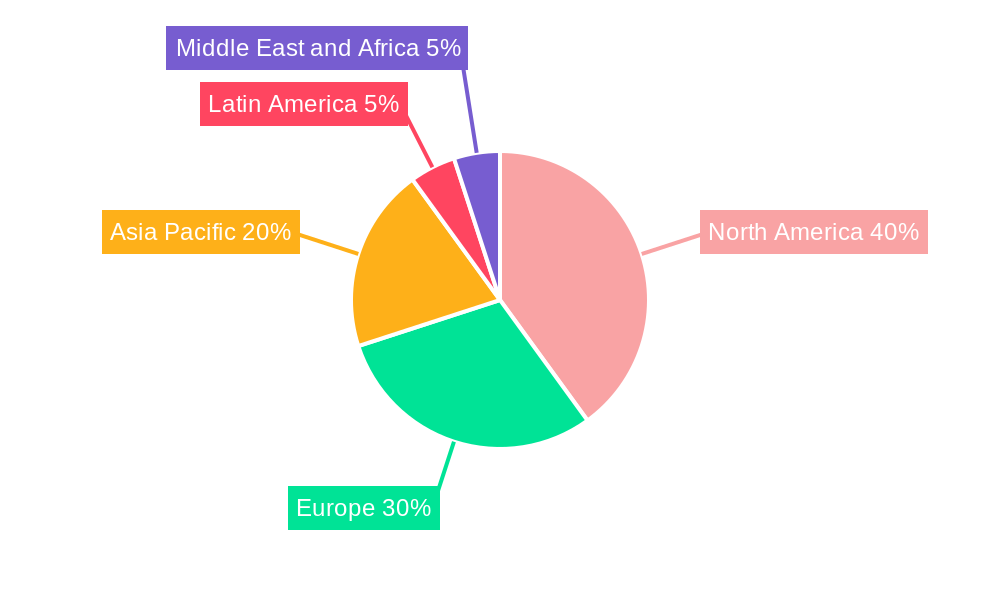
Model-Based Enterprise Industry Regional Market Share
Geographic Coverage of Model-Based Enterprise Industry
Model-Based Enterprise Industry REPORT HIGHLIGHTS
| Aspects | Details |
|---|---|
| Study Period | 2020-2034 |
| Base Year | 2025 |
| Estimated Year | 2026 |
| Forecast Period | 2026-2034 |
| Historical Period | 2020-2025 |
| Growth Rate | CAGR of 15.42% from 2020-2034 |
| Segmentation |
|
Table of Contents
- 1. Introduction
- 1.1. Research Scope
- 1.2. Market Segmentation
- 1.3. Research Methodology
- 1.4. Definitions and Assumptions
- 2. Executive Summary
- 2.1. Introduction
- 3. Market Dynamics
- 3.1. Introduction
- 3.2. Market Drivers
- 3.2.1. Evolving Software Capabilities; Rising Adoption of IoT and Cloud-based Platforms
- 3.3. Market Restrains
- 3.3.1 Shortage of Skilled Workers
- 3.3.2 Data Security Concerns
- 3.3.3 and the Initial Investment Costs Hinder Business Operations
- 3.4. Market Trends
- 3.4.1. Automotive Sector to Witness Major Growth
- 4. Market Factor Analysis
- 4.1. Porters Five Forces
- 4.2. Supply/Value Chain
- 4.3. PESTEL analysis
- 4.4. Market Entropy
- 4.5. Patent/Trademark Analysis
- 5. Global Model-Based Enterprise Industry Analysis, Insights and Forecast, 2020-2032
- 5.1. Market Analysis, Insights and Forecast - by Offering
- 5.1.1. Solutions
- 5.1.2. Services
- 5.2. Market Analysis, Insights and Forecast - by Deployment Mode
- 5.2.1. On-premise
- 5.2.2. Cloud
- 5.3. Market Analysis, Insights and Forecast - by End User
- 5.3.1. Aerospace and Defense
- 5.3.2. Automotive
- 5.3.3. Construction
- 5.3.4. Power and Energy
- 5.3.5. Retail
- 5.3.6. Other End Users
- 5.4. Market Analysis, Insights and Forecast - by Region
- 5.4.1. North America
- 5.4.2. Europe
- 5.4.3. Asia Pacific
- 5.4.4. Latin America
- 5.4.5. Middle East and Africa
- 5.1. Market Analysis, Insights and Forecast - by Offering
- 6. North America Model-Based Enterprise Industry Analysis, Insights and Forecast, 2020-2032
- 6.1. Market Analysis, Insights and Forecast - by Offering
- 6.1.1. Solutions
- 6.1.2. Services
- 6.2. Market Analysis, Insights and Forecast - by Deployment Mode
- 6.2.1. On-premise
- 6.2.2. Cloud
- 6.3. Market Analysis, Insights and Forecast - by End User
- 6.3.1. Aerospace and Defense
- 6.3.2. Automotive
- 6.3.3. Construction
- 6.3.4. Power and Energy
- 6.3.5. Retail
- 6.3.6. Other End Users
- 6.1. Market Analysis, Insights and Forecast - by Offering
- 7. Europe Model-Based Enterprise Industry Analysis, Insights and Forecast, 2020-2032
- 7.1. Market Analysis, Insights and Forecast - by Offering
- 7.1.1. Solutions
- 7.1.2. Services
- 7.2. Market Analysis, Insights and Forecast - by Deployment Mode
- 7.2.1. On-premise
- 7.2.2. Cloud
- 7.3. Market Analysis, Insights and Forecast - by End User
- 7.3.1. Aerospace and Defense
- 7.3.2. Automotive
- 7.3.3. Construction
- 7.3.4. Power and Energy
- 7.3.5. Retail
- 7.3.6. Other End Users
- 7.1. Market Analysis, Insights and Forecast - by Offering
- 8. Asia Pacific Model-Based Enterprise Industry Analysis, Insights and Forecast, 2020-2032
- 8.1. Market Analysis, Insights and Forecast - by Offering
- 8.1.1. Solutions
- 8.1.2. Services
- 8.2. Market Analysis, Insights and Forecast - by Deployment Mode
- 8.2.1. On-premise
- 8.2.2. Cloud
- 8.3. Market Analysis, Insights and Forecast - by End User
- 8.3.1. Aerospace and Defense
- 8.3.2. Automotive
- 8.3.3. Construction
- 8.3.4. Power and Energy
- 8.3.5. Retail
- 8.3.6. Other End Users
- 8.1. Market Analysis, Insights and Forecast - by Offering
- 9. Latin America Model-Based Enterprise Industry Analysis, Insights and Forecast, 2020-2032
- 9.1. Market Analysis, Insights and Forecast - by Offering
- 9.1.1. Solutions
- 9.1.2. Services
- 9.2. Market Analysis, Insights and Forecast - by Deployment Mode
- 9.2.1. On-premise
- 9.2.2. Cloud
- 9.3. Market Analysis, Insights and Forecast - by End User
- 9.3.1. Aerospace and Defense
- 9.3.2. Automotive
- 9.3.3. Construction
- 9.3.4. Power and Energy
- 9.3.5. Retail
- 9.3.6. Other End Users
- 9.1. Market Analysis, Insights and Forecast - by Offering
- 10. Middle East and Africa Model-Based Enterprise Industry Analysis, Insights and Forecast, 2020-2032
- 10.1. Market Analysis, Insights and Forecast - by Offering
- 10.1.1. Solutions
- 10.1.2. Services
- 10.2. Market Analysis, Insights and Forecast - by Deployment Mode
- 10.2.1. On-premise
- 10.2.2. Cloud
- 10.3. Market Analysis, Insights and Forecast - by End User
- 10.3.1. Aerospace and Defense
- 10.3.2. Automotive
- 10.3.3. Construction
- 10.3.4. Power and Energy
- 10.3.5. Retail
- 10.3.6. Other End Users
- 10.1. Market Analysis, Insights and Forecast - by Offering
- 11. Competitive Analysis
- 11.1. Global Market Share Analysis 2025
- 11.2. Company Profiles
- 11.2.1 Aras Corporation
- 11.2.1.1. Overview
- 11.2.1.2. Products
- 11.2.1.3. SWOT Analysis
- 11.2.1.4. Recent Developments
- 11.2.1.5. Financials (Based on Availability)
- 11.2.2 Anark Corporatio
- 11.2.2.1. Overview
- 11.2.2.2. Products
- 11.2.2.3. SWOT Analysis
- 11.2.2.4. Recent Developments
- 11.2.2.5. Financials (Based on Availability)
- 11.2.3 Siemens AG
- 11.2.3.1. Overview
- 11.2.3.2. Products
- 11.2.3.3. SWOT Analysis
- 11.2.3.4. Recent Developments
- 11.2.3.5. Financials (Based on Availability)
- 11.2.4 PTC Inc
- 11.2.4.1. Overview
- 11.2.4.2. Products
- 11.2.4.3. SWOT Analysis
- 11.2.4.4. Recent Developments
- 11.2.4.5. Financials (Based on Availability)
- 11.2.5 Autodesk Inc
- 11.2.5.1. Overview
- 11.2.5.2. Products
- 11.2.5.3. SWOT Analysis
- 11.2.5.4. Recent Developments
- 11.2.5.5. Financials (Based on Availability)
- 11.2.6 Oracle Corporation
- 11.2.6.1. Overview
- 11.2.6.2. Products
- 11.2.6.3. SWOT Analysis
- 11.2.6.4. Recent Developments
- 11.2.6.5. Financials (Based on Availability)
- 11.2.7 Dassault Systèmes SE
- 11.2.7.1. Overview
- 11.2.7.2. Products
- 11.2.7.3. SWOT Analysis
- 11.2.7.4. Recent Developments
- 11.2.7.5. Financials (Based on Availability)
- 11.2.8 General Electric Company
- 11.2.8.1. Overview
- 11.2.8.2. Products
- 11.2.8.3. SWOT Analysis
- 11.2.8.4. Recent Developments
- 11.2.8.5. Financials (Based on Availability)
- 11.2.9 HCL Technologies Limited
- 11.2.9.1. Overview
- 11.2.9.2. Products
- 11.2.9.3. SWOT Analysis
- 11.2.9.4. Recent Developments
- 11.2.9.5. Financials (Based on Availability)
- 11.2.10 SAP SE
- 11.2.10.1. Overview
- 11.2.10.2. Products
- 11.2.10.3. SWOT Analysis
- 11.2.10.4. Recent Developments
- 11.2.10.5. Financials (Based on Availability)
- 11.2.1 Aras Corporation
List of Figures
- Figure 1: Global Model-Based Enterprise Industry Revenue Breakdown (Million, %) by Region 2025 & 2033
- Figure 2: North America Model-Based Enterprise Industry Revenue (Million), by Offering 2025 & 2033
- Figure 3: North America Model-Based Enterprise Industry Revenue Share (%), by Offering 2025 & 2033
- Figure 4: North America Model-Based Enterprise Industry Revenue (Million), by Deployment Mode 2025 & 2033
- Figure 5: North America Model-Based Enterprise Industry Revenue Share (%), by Deployment Mode 2025 & 2033
- Figure 6: North America Model-Based Enterprise Industry Revenue (Million), by End User 2025 & 2033
- Figure 7: North America Model-Based Enterprise Industry Revenue Share (%), by End User 2025 & 2033
- Figure 8: North America Model-Based Enterprise Industry Revenue (Million), by Country 2025 & 2033
- Figure 9: North America Model-Based Enterprise Industry Revenue Share (%), by Country 2025 & 2033
- Figure 10: Europe Model-Based Enterprise Industry Revenue (Million), by Offering 2025 & 2033
- Figure 11: Europe Model-Based Enterprise Industry Revenue Share (%), by Offering 2025 & 2033
- Figure 12: Europe Model-Based Enterprise Industry Revenue (Million), by Deployment Mode 2025 & 2033
- Figure 13: Europe Model-Based Enterprise Industry Revenue Share (%), by Deployment Mode 2025 & 2033
- Figure 14: Europe Model-Based Enterprise Industry Revenue (Million), by End User 2025 & 2033
- Figure 15: Europe Model-Based Enterprise Industry Revenue Share (%), by End User 2025 & 2033
- Figure 16: Europe Model-Based Enterprise Industry Revenue (Million), by Country 2025 & 2033
- Figure 17: Europe Model-Based Enterprise Industry Revenue Share (%), by Country 2025 & 2033
- Figure 18: Asia Pacific Model-Based Enterprise Industry Revenue (Million), by Offering 2025 & 2033
- Figure 19: Asia Pacific Model-Based Enterprise Industry Revenue Share (%), by Offering 2025 & 2033
- Figure 20: Asia Pacific Model-Based Enterprise Industry Revenue (Million), by Deployment Mode 2025 & 2033
- Figure 21: Asia Pacific Model-Based Enterprise Industry Revenue Share (%), by Deployment Mode 2025 & 2033
- Figure 22: Asia Pacific Model-Based Enterprise Industry Revenue (Million), by End User 2025 & 2033
- Figure 23: Asia Pacific Model-Based Enterprise Industry Revenue Share (%), by End User 2025 & 2033
- Figure 24: Asia Pacific Model-Based Enterprise Industry Revenue (Million), by Country 2025 & 2033
- Figure 25: Asia Pacific Model-Based Enterprise Industry Revenue Share (%), by Country 2025 & 2033
- Figure 26: Latin America Model-Based Enterprise Industry Revenue (Million), by Offering 2025 & 2033
- Figure 27: Latin America Model-Based Enterprise Industry Revenue Share (%), by Offering 2025 & 2033
- Figure 28: Latin America Model-Based Enterprise Industry Revenue (Million), by Deployment Mode 2025 & 2033
- Figure 29: Latin America Model-Based Enterprise Industry Revenue Share (%), by Deployment Mode 2025 & 2033
- Figure 30: Latin America Model-Based Enterprise Industry Revenue (Million), by End User 2025 & 2033
- Figure 31: Latin America Model-Based Enterprise Industry Revenue Share (%), by End User 2025 & 2033
- Figure 32: Latin America Model-Based Enterprise Industry Revenue (Million), by Country 2025 & 2033
- Figure 33: Latin America Model-Based Enterprise Industry Revenue Share (%), by Country 2025 & 2033
- Figure 34: Middle East and Africa Model-Based Enterprise Industry Revenue (Million), by Offering 2025 & 2033
- Figure 35: Middle East and Africa Model-Based Enterprise Industry Revenue Share (%), by Offering 2025 & 2033
- Figure 36: Middle East and Africa Model-Based Enterprise Industry Revenue (Million), by Deployment Mode 2025 & 2033
- Figure 37: Middle East and Africa Model-Based Enterprise Industry Revenue Share (%), by Deployment Mode 2025 & 2033
- Figure 38: Middle East and Africa Model-Based Enterprise Industry Revenue (Million), by End User 2025 & 2033
- Figure 39: Middle East and Africa Model-Based Enterprise Industry Revenue Share (%), by End User 2025 & 2033
- Figure 40: Middle East and Africa Model-Based Enterprise Industry Revenue (Million), by Country 2025 & 2033
- Figure 41: Middle East and Africa Model-Based Enterprise Industry Revenue Share (%), by Country 2025 & 2033
List of Tables
- Table 1: Global Model-Based Enterprise Industry Revenue Million Forecast, by Offering 2020 & 2033
- Table 2: Global Model-Based Enterprise Industry Revenue Million Forecast, by Deployment Mode 2020 & 2033
- Table 3: Global Model-Based Enterprise Industry Revenue Million Forecast, by End User 2020 & 2033
- Table 4: Global Model-Based Enterprise Industry Revenue Million Forecast, by Region 2020 & 2033
- Table 5: Global Model-Based Enterprise Industry Revenue Million Forecast, by Offering 2020 & 2033
- Table 6: Global Model-Based Enterprise Industry Revenue Million Forecast, by Deployment Mode 2020 & 2033
- Table 7: Global Model-Based Enterprise Industry Revenue Million Forecast, by End User 2020 & 2033
- Table 8: Global Model-Based Enterprise Industry Revenue Million Forecast, by Country 2020 & 2033
- Table 9: Global Model-Based Enterprise Industry Revenue Million Forecast, by Offering 2020 & 2033
- Table 10: Global Model-Based Enterprise Industry Revenue Million Forecast, by Deployment Mode 2020 & 2033
- Table 11: Global Model-Based Enterprise Industry Revenue Million Forecast, by End User 2020 & 2033
- Table 12: Global Model-Based Enterprise Industry Revenue Million Forecast, by Country 2020 & 2033
- Table 13: Global Model-Based Enterprise Industry Revenue Million Forecast, by Offering 2020 & 2033
- Table 14: Global Model-Based Enterprise Industry Revenue Million Forecast, by Deployment Mode 2020 & 2033
- Table 15: Global Model-Based Enterprise Industry Revenue Million Forecast, by End User 2020 & 2033
- Table 16: Global Model-Based Enterprise Industry Revenue Million Forecast, by Country 2020 & 2033
- Table 17: Global Model-Based Enterprise Industry Revenue Million Forecast, by Offering 2020 & 2033
- Table 18: Global Model-Based Enterprise Industry Revenue Million Forecast, by Deployment Mode 2020 & 2033
- Table 19: Global Model-Based Enterprise Industry Revenue Million Forecast, by End User 2020 & 2033
- Table 20: Global Model-Based Enterprise Industry Revenue Million Forecast, by Country 2020 & 2033
- Table 21: Global Model-Based Enterprise Industry Revenue Million Forecast, by Offering 2020 & 2033
- Table 22: Global Model-Based Enterprise Industry Revenue Million Forecast, by Deployment Mode 2020 & 2033
- Table 23: Global Model-Based Enterprise Industry Revenue Million Forecast, by End User 2020 & 2033
- Table 24: Global Model-Based Enterprise Industry Revenue Million Forecast, by Country 2020 & 2033
Frequently Asked Questions
1. What is the projected Compound Annual Growth Rate (CAGR) of the Model-Based Enterprise Industry?
The projected CAGR is approximately 15.42%.
2. Which companies are prominent players in the Model-Based Enterprise Industry?
Key companies in the market include Aras Corporation, Anark Corporatio, Siemens AG, PTC Inc, Autodesk Inc, Oracle Corporation, Dassault Systèmes SE, General Electric Company, HCL Technologies Limited, SAP SE.
3. What are the main segments of the Model-Based Enterprise Industry?
The market segments include Offering, Deployment Mode, End User.
4. Can you provide details about the market size?
The market size is estimated to be USD 20.76 Million as of 2022.
5. What are some drivers contributing to market growth?
Evolving Software Capabilities; Rising Adoption of IoT and Cloud-based Platforms.
6. What are the notable trends driving market growth?
Automotive Sector to Witness Major Growth.
7. Are there any restraints impacting market growth?
Shortage of Skilled Workers. Data Security Concerns. and the Initial Investment Costs Hinder Business Operations.
8. Can you provide examples of recent developments in the market?
September 2023 - Tech Soft 3D, the provider of engineering software development toolkits, introduced iBase-t, which assists its users in simplifying how complex products are built and maintained. It integrated HOOPS Exchange, the CAD import and export library, into iBase-t's Solumina iSeries Manufacturing Operations Platform.
9. What pricing options are available for accessing the report?
Pricing options include single-user, multi-user, and enterprise licenses priced at USD 4750, USD 5250, and USD 8750 respectively.
10. Is the market size provided in terms of value or volume?
The market size is provided in terms of value, measured in Million.
11. Are there any specific market keywords associated with the report?
Yes, the market keyword associated with the report is "Model-Based Enterprise Industry," which aids in identifying and referencing the specific market segment covered.
12. How do I determine which pricing option suits my needs best?
The pricing options vary based on user requirements and access needs. Individual users may opt for single-user licenses, while businesses requiring broader access may choose multi-user or enterprise licenses for cost-effective access to the report.
13. Are there any additional resources or data provided in the Model-Based Enterprise Industry report?
While the report offers comprehensive insights, it's advisable to review the specific contents or supplementary materials provided to ascertain if additional resources or data are available.
14. How can I stay updated on further developments or reports in the Model-Based Enterprise Industry?
To stay informed about further developments, trends, and reports in the Model-Based Enterprise Industry, consider subscribing to industry newsletters, following relevant companies and organizations, or regularly checking reputable industry news sources and publications.
Methodology
Step 1 - Identification of Relevant Samples Size from Population Database


Step 2 - Approaches for Defining Global Market Size (Value, Volume* & Price*)

Note*: In applicable scenarios
Step 3 - Data Sources
Primary Research
- Web Analytics
- Survey Reports
- Research Institute
- Latest Research Reports
- Opinion Leaders
Secondary Research
- Annual Reports
- White Paper
- Latest Press Release
- Industry Association
- Paid Database
- Investor Presentations

Step 4 - Data Triangulation
Involves using different sources of information in order to increase the validity of a study
These sources are likely to be stakeholders in a program - participants, other researchers, program staff, other community members, and so on.
Then we put all data in single framework & apply various statistical tools to find out the dynamic on the market.
During the analysis stage, feedback from the stakeholder groups would be compared to determine areas of agreement as well as areas of divergence