
Key Insights
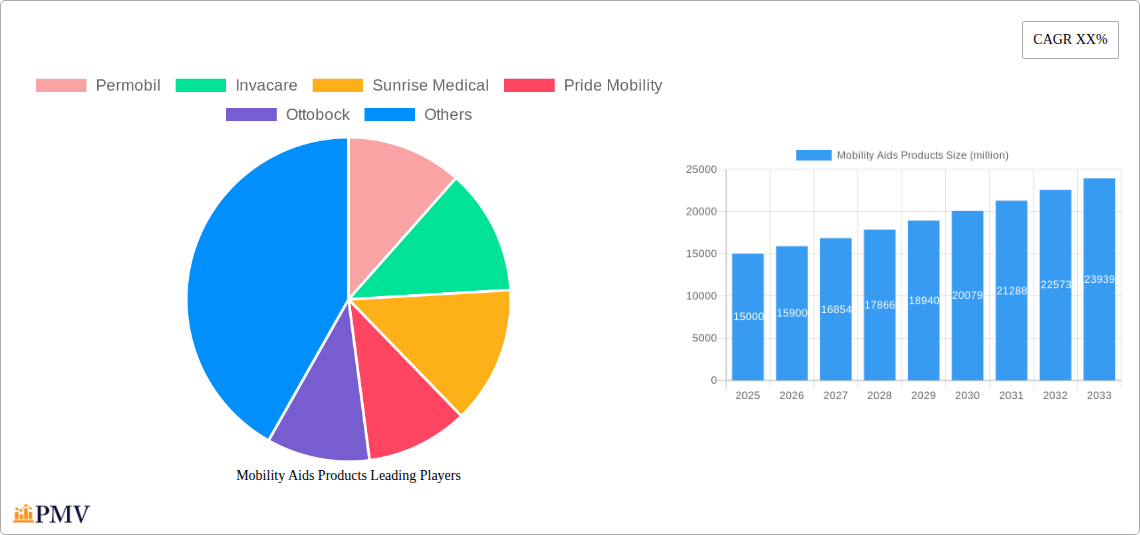
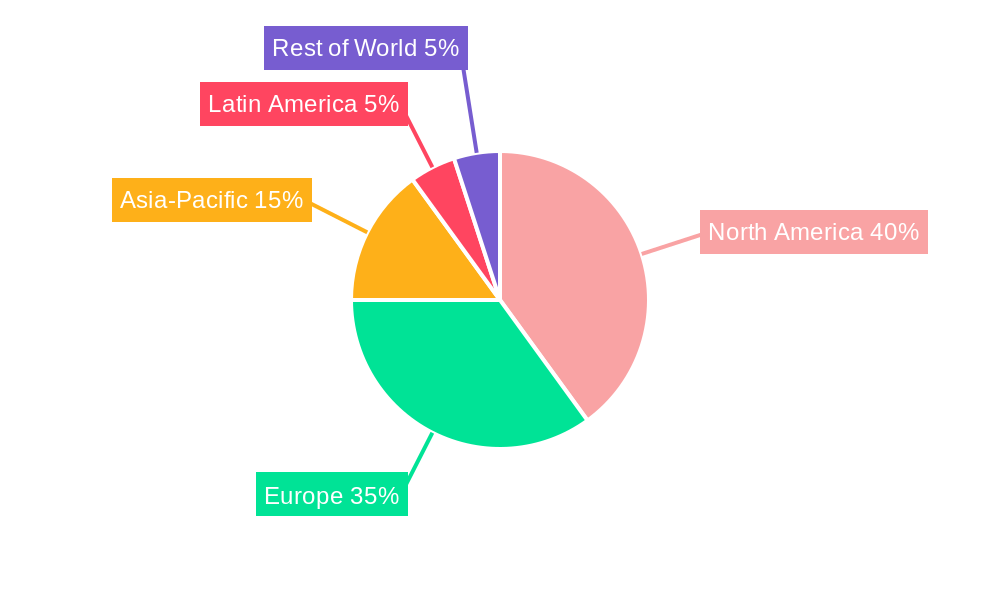
The global mobility aids market is experiencing robust growth, driven by an aging global population, increasing prevalence of chronic diseases like arthritis and stroke leading to mobility impairments, and rising healthcare expenditure. Technological advancements, such as the development of lightweight, more comfortable, and technologically advanced mobility aids (e.g., smart wheelchairs with advanced features and power-assisted walkers), are further fueling market expansion. The market is segmented by product type (manual wheelchairs, power wheelchairs, walkers, canes, crutches, etc.), end-user (hospitals, nursing homes, homecare settings, individual consumers), and geography. While the market faced some initial restraints due to supply chain disruptions in recent years, the industry is recovering and is projected to maintain a strong growth trajectory. Competition is intense amongst established players like Permobil, Invacare, and Sunrise Medical, as well as several emerging companies offering innovative products and services. This competitive landscape drives innovation and contributes to the overall market development. The market's growth is geographically diverse, with North America and Europe currently holding significant market share, but growth in emerging economies in Asia-Pacific and Latin America is expected to accelerate in the coming years due to rising disposable incomes and increasing awareness of the benefits of mobility aids.
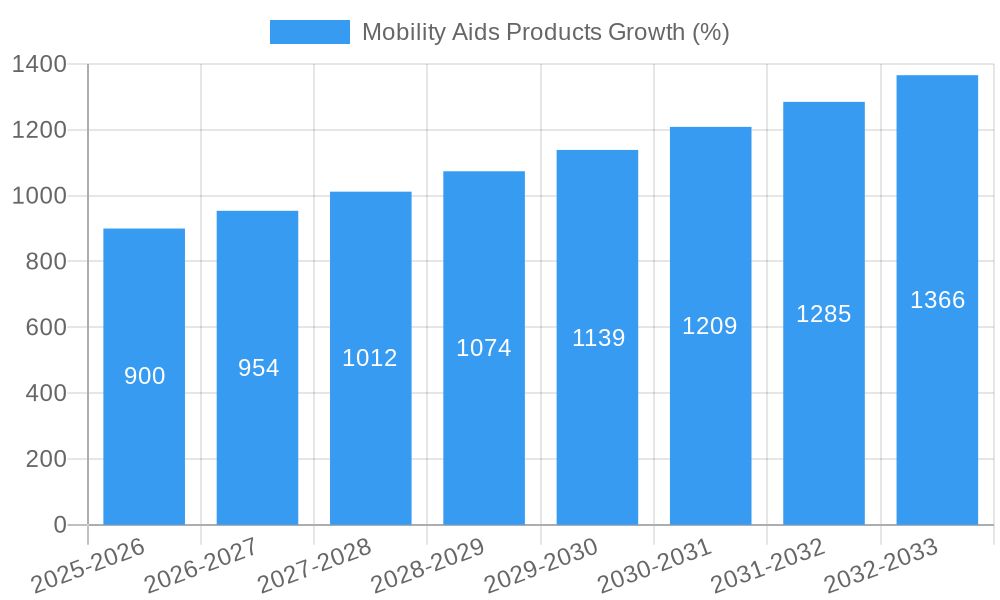
The forecast period (2025-2033) anticipates continued expansion, driven by factors such as the increasing adoption of assistive technologies, rising geriatric population requiring mobility support, and improved healthcare infrastructure. However, high product costs, particularly for advanced power wheelchairs, and varying reimbursement policies across different healthcare systems represent ongoing challenges. Nevertheless, the market's positive outlook remains strong, supported by ongoing innovation and a growing need for mobility solutions across the globe. Market players are focusing on strategic partnerships, product diversification, and mergers and acquisitions to gain a competitive edge and cater to the evolving demands of the market. Specific focus on developing affordable and accessible mobility solutions for underserved populations will be key to unlocking further growth potential.
Mobility Aids Products Market Report: 2019-2033
This comprehensive report provides a detailed analysis of the global Mobility Aids Products market, offering invaluable insights for stakeholders, investors, and industry professionals. Covering the period from 2019 to 2033, with a focus on 2025, this report delves into market structure, competitive dynamics, industry trends, and future growth potential. The market is estimated to be worth $xx million in 2025, projected to reach $xx million by 2033, exhibiting a CAGR of xx%.
Mobility Aids Products Market Structure & Competitive Dynamics
The global mobility aids products market is characterized by a moderately concentrated structure, with key players such as Permobil, Invacare, and Sunrise Medical holding significant market share. The market exhibits a dynamic innovation ecosystem, driven by advancements in materials science, assistive technologies, and digital health integration. Regulatory frameworks, varying across different geographies, significantly impact market access and product approvals. The presence of substitute products, such as home modifications and personal assistance services, presents competitive challenges. End-user trends, reflecting an aging population and increasing prevalence of chronic diseases, fuel market growth. Mergers and acquisitions (M&A) activities, with an estimated total deal value exceeding $xx million in the last five years, further shape the market landscape.
- Market Concentration: The top five players collectively hold approximately xx% of the global market share in 2025.
- Innovation Ecosystems: Significant investments in R&D focusing on lightweight materials, smart features, and personalized solutions.
- Regulatory Frameworks: Varying standards and approval processes across regions influence market entry and product availability.
- M&A Activity: Consolidation trends are evident, with several large-scale acquisitions driving market restructuring. Deal values have averaged $xx million per transaction during the historical period.
Mobility Aids Products Industry Trends & Insights
The mobility aids products market is experiencing robust growth, propelled by several key factors. The aging global population, coupled with rising incidence of chronic diseases like arthritis and stroke, is a primary driver. Technological advancements, including the incorporation of smart features, lightweight materials, and improved ergonomics, are enhancing product functionality and user experience. Consumer preferences are shifting towards customizable, aesthetically pleasing, and technologically advanced mobility aids. Intense competition among established players and emerging entrants is leading to product innovation and price optimization. The market penetration of advanced mobility aids, such as power wheelchairs and smart walkers, is increasing steadily, contributing to the overall market expansion. The market is expected to experience significant growth over the forecast period, driven by these factors.
Dominant Markets & Segments in Mobility Aids Products
North America currently dominates the global mobility aids products market, accounting for approximately xx% of the total market value in 2025. This dominance is attributed to factors such as a high prevalence of age-related disabilities, robust healthcare infrastructure, and higher disposable incomes. Europe represents another significant market, with a substantial and aging population.
- Key Drivers in North America:
- High prevalence of chronic diseases and aging population.
- Well-developed healthcare infrastructure and insurance coverage.
- Relatively high disposable incomes.
- Favorable regulatory environment for medical device approvals.
- Key Drivers in Europe:
- Large aging population with increased healthcare needs.
- Government initiatives promoting accessibility and assistive technologies.
- Growing awareness of the importance of mobility solutions.
Mobility Aids Products Product Innovations
Recent innovations in mobility aids include lightweight materials like carbon fiber and aluminum, enhancing portability and ease of use. Smart features, such as GPS tracking, fall detection, and connectivity with smartphones, are enhancing safety and user experience. The integration of advanced technologies like AI and machine learning is paving the way for personalized mobility solutions. These advancements cater to the increasing demand for comfortable, safe, and technologically advanced mobility products, expanding the market's reach and driving adoption.
Report Segmentation & Scope
This report segments the mobility aids products market based on product type (manual wheelchairs, power wheelchairs, walkers, canes, crutches), end-user (individuals, hospitals, rehabilitation centers), and geography (North America, Europe, Asia Pacific, Rest of the World). Each segment's growth projections, market size, and competitive landscape are comprehensively analyzed. For instance, the power wheelchair segment is expected to exhibit the highest growth rate due to its increased functionality and user comfort. The geographic segments reflect regional variations in healthcare infrastructure, economic conditions, and regulatory frameworks.
Key Drivers of Mobility Aids Products Growth
Technological advancements, such as the development of lightweight, durable materials and advanced assistive technologies, are driving market expansion. Economic factors, including rising disposable incomes and increasing healthcare expenditure in developed countries, contribute significantly to market growth. Favorable regulatory policies promoting assistive technologies and accessibility further stimulate market growth. The increasing prevalence of chronic diseases and an aging global population are key demographic drivers.
Challenges in the Mobility Aids Products Sector
High product costs and limited insurance coverage can hinder market penetration, particularly in developing countries. Supply chain disruptions and raw material price fluctuations pose challenges to manufacturers. Intense competition among established players necessitates continuous innovation and product differentiation to maintain market share. Stringent regulatory compliance requirements may slow down product development and market entry.
Leading Players in the Mobility Aids Products Market
- Permobil
- Invacare
- Sunrise Medical
- Pride Mobility
- Ottobock
- Medline
- Hoveround Corp
- Drive Medical
- Hubang
- Merits Health Products
- Nissin Medical
- N.V. Vermeiren
- Heartway
- GF Health
- Karman
- EZ Lite Cruiser
- Golden Technologies
- Drive DeVilbiss Healthcare
- Breg, Inc.
- Performance Health
Key Developments in Mobility Aids Products Sector
- 2022 Q4: Sunrise Medical launched a new line of lightweight power wheelchairs.
- 2023 Q1: Permobil announced a strategic partnership to expand its distribution network in Asia.
- 2023 Q2: Invacare acquired a smaller competitor, expanding its product portfolio. (Further specific details would need to be added here based on actual data)
Strategic Mobility Aids Products Market Outlook
The mobility aids products market is poised for sustained growth, driven by technological advancements, demographic shifts, and supportive government policies. Strategic opportunities exist for companies to invest in R&D, expand into emerging markets, and develop innovative solutions catering to evolving customer needs. Focus on product differentiation, personalized solutions, and digital health integration will be crucial for success in this competitive landscape. The market offers significant potential for both established players and new entrants with innovative offerings.
Mobility Aids Products Segmentation
-
1. Application
- 1.1. Blind and Vision Impairment
- 1.2. Elderly
- 1.3. Others
-
2. Types
- 2.1. Canes and Crutches
- 2.2. Walkers
- 2.3. Wheelchairs
Mobility Aids Products Segmentation By Geography
-
1. North America
- 1.1. United States
- 1.2. Canada
- 1.3. Mexico
-
2. South America
- 2.1. Brazil
- 2.2. Argentina
- 2.3. Rest of South America
-
3. Europe
- 3.1. United Kingdom
- 3.2. Germany
- 3.3. France
- 3.4. Italy
- 3.5. Spain
- 3.6. Russia
- 3.7. Benelux
- 3.8. Nordics
- 3.9. Rest of Europe
-
4. Middle East & Africa
- 4.1. Turkey
- 4.2. Israel
- 4.3. GCC
- 4.4. North Africa
- 4.5. South Africa
- 4.6. Rest of Middle East & Africa
-
5. Asia Pacific
- 5.1. China
- 5.2. India
- 5.3. Japan
- 5.4. South Korea
- 5.5. ASEAN
- 5.6. Oceania
- 5.7. Rest of Asia Pacific
Mobility Aids Products REPORT HIGHLIGHTS
| Aspects | Details |
|---|---|
| Study Period | 2019-2033 |
| Base Year | 2024 |
| Estimated Year | 2025 |
| Forecast Period | 2025-2033 |
| Historical Period | 2019-2024 |
| Growth Rate | CAGR of XX% from 2019-2033 |
| Segmentation |
|
Table of Contents
- 1. Introduction
- 1.1. Research Scope
- 1.2. Market Segmentation
- 1.3. Research Methodology
- 1.4. Definitions and Assumptions
- 2. Executive Summary
- 2.1. Introduction
- 3. Market Dynamics
- 3.1. Introduction
- 3.2. Market Drivers
- 3.3. Market Restrains
- 3.4. Market Trends
- 4. Market Factor Analysis
- 4.1. Porters Five Forces
- 4.2. Supply/Value Chain
- 4.3. PESTEL analysis
- 4.4. Market Entropy
- 4.5. Patent/Trademark Analysis
- 5. Global Mobility Aids Products Analysis, Insights and Forecast, 2019-2031
- 5.1. Market Analysis, Insights and Forecast - by Application
- 5.1.1. Blind and Vision Impairment
- 5.1.2. Elderly
- 5.1.3. Others
- 5.2. Market Analysis, Insights and Forecast - by Types
- 5.2.1. Canes and Crutches
- 5.2.2. Walkers
- 5.2.3. Wheelchairs
- 5.3. Market Analysis, Insights and Forecast - by Region
- 5.3.1. North America
- 5.3.2. South America
- 5.3.3. Europe
- 5.3.4. Middle East & Africa
- 5.3.5. Asia Pacific
- 5.1. Market Analysis, Insights and Forecast - by Application
- 6. North America Mobility Aids Products Analysis, Insights and Forecast, 2019-2031
- 6.1. Market Analysis, Insights and Forecast - by Application
- 6.1.1. Blind and Vision Impairment
- 6.1.2. Elderly
- 6.1.3. Others
- 6.2. Market Analysis, Insights and Forecast - by Types
- 6.2.1. Canes and Crutches
- 6.2.2. Walkers
- 6.2.3. Wheelchairs
- 6.1. Market Analysis, Insights and Forecast - by Application
- 7. South America Mobility Aids Products Analysis, Insights and Forecast, 2019-2031
- 7.1. Market Analysis, Insights and Forecast - by Application
- 7.1.1. Blind and Vision Impairment
- 7.1.2. Elderly
- 7.1.3. Others
- 7.2. Market Analysis, Insights and Forecast - by Types
- 7.2.1. Canes and Crutches
- 7.2.2. Walkers
- 7.2.3. Wheelchairs
- 7.1. Market Analysis, Insights and Forecast - by Application
- 8. Europe Mobility Aids Products Analysis, Insights and Forecast, 2019-2031
- 8.1. Market Analysis, Insights and Forecast - by Application
- 8.1.1. Blind and Vision Impairment
- 8.1.2. Elderly
- 8.1.3. Others
- 8.2. Market Analysis, Insights and Forecast - by Types
- 8.2.1. Canes and Crutches
- 8.2.2. Walkers
- 8.2.3. Wheelchairs
- 8.1. Market Analysis, Insights and Forecast - by Application
- 9. Middle East & Africa Mobility Aids Products Analysis, Insights and Forecast, 2019-2031
- 9.1. Market Analysis, Insights and Forecast - by Application
- 9.1.1. Blind and Vision Impairment
- 9.1.2. Elderly
- 9.1.3. Others
- 9.2. Market Analysis, Insights and Forecast - by Types
- 9.2.1. Canes and Crutches
- 9.2.2. Walkers
- 9.2.3. Wheelchairs
- 9.1. Market Analysis, Insights and Forecast - by Application
- 10. Asia Pacific Mobility Aids Products Analysis, Insights and Forecast, 2019-2031
- 10.1. Market Analysis, Insights and Forecast - by Application
- 10.1.1. Blind and Vision Impairment
- 10.1.2. Elderly
- 10.1.3. Others
- 10.2. Market Analysis, Insights and Forecast - by Types
- 10.2.1. Canes and Crutches
- 10.2.2. Walkers
- 10.2.3. Wheelchairs
- 10.1. Market Analysis, Insights and Forecast - by Application
- 11. Competitive Analysis
- 11.1. Global Market Share Analysis 2024
- 11.2. Company Profiles
- 11.2.1 Permobil
- 11.2.1.1. Overview
- 11.2.1.2. Products
- 11.2.1.3. SWOT Analysis
- 11.2.1.4. Recent Developments
- 11.2.1.5. Financials (Based on Availability)
- 11.2.2 Invacare
- 11.2.2.1. Overview
- 11.2.2.2. Products
- 11.2.2.3. SWOT Analysis
- 11.2.2.4. Recent Developments
- 11.2.2.5. Financials (Based on Availability)
- 11.2.3 Sunrise Medical
- 11.2.3.1. Overview
- 11.2.3.2. Products
- 11.2.3.3. SWOT Analysis
- 11.2.3.4. Recent Developments
- 11.2.3.5. Financials (Based on Availability)
- 11.2.4 Pride Mobility
- 11.2.4.1. Overview
- 11.2.4.2. Products
- 11.2.4.3. SWOT Analysis
- 11.2.4.4. Recent Developments
- 11.2.4.5. Financials (Based on Availability)
- 11.2.5 Ottobock
- 11.2.5.1. Overview
- 11.2.5.2. Products
- 11.2.5.3. SWOT Analysis
- 11.2.5.4. Recent Developments
- 11.2.5.5. Financials (Based on Availability)
- 11.2.6 Medline
- 11.2.6.1. Overview
- 11.2.6.2. Products
- 11.2.6.3. SWOT Analysis
- 11.2.6.4. Recent Developments
- 11.2.6.5. Financials (Based on Availability)
- 11.2.7 Hoveround Corp
- 11.2.7.1. Overview
- 11.2.7.2. Products
- 11.2.7.3. SWOT Analysis
- 11.2.7.4. Recent Developments
- 11.2.7.5. Financials (Based on Availability)
- 11.2.8 Drive Medical
- 11.2.8.1. Overview
- 11.2.8.2. Products
- 11.2.8.3. SWOT Analysis
- 11.2.8.4. Recent Developments
- 11.2.8.5. Financials (Based on Availability)
- 11.2.9 Hubang
- 11.2.9.1. Overview
- 11.2.9.2. Products
- 11.2.9.3. SWOT Analysis
- 11.2.9.4. Recent Developments
- 11.2.9.5. Financials (Based on Availability)
- 11.2.10 Merits Health Products
- 11.2.10.1. Overview
- 11.2.10.2. Products
- 11.2.10.3. SWOT Analysis
- 11.2.10.4. Recent Developments
- 11.2.10.5. Financials (Based on Availability)
- 11.2.11 Nissin Medical
- 11.2.11.1. Overview
- 11.2.11.2. Products
- 11.2.11.3. SWOT Analysis
- 11.2.11.4. Recent Developments
- 11.2.11.5. Financials (Based on Availability)
- 11.2.12 N.V. Vermeiren
- 11.2.12.1. Overview
- 11.2.12.2. Products
- 11.2.12.3. SWOT Analysis
- 11.2.12.4. Recent Developments
- 11.2.12.5. Financials (Based on Availability)
- 11.2.13 Heartway
- 11.2.13.1. Overview
- 11.2.13.2. Products
- 11.2.13.3. SWOT Analysis
- 11.2.13.4. Recent Developments
- 11.2.13.5. Financials (Based on Availability)
- 11.2.14 GF Health
- 11.2.14.1. Overview
- 11.2.14.2. Products
- 11.2.14.3. SWOT Analysis
- 11.2.14.4. Recent Developments
- 11.2.14.5. Financials (Based on Availability)
- 11.2.15 Karman
- 11.2.15.1. Overview
- 11.2.15.2. Products
- 11.2.15.3. SWOT Analysis
- 11.2.15.4. Recent Developments
- 11.2.15.5. Financials (Based on Availability)
- 11.2.16 EZ Lite Cruiser
- 11.2.16.1. Overview
- 11.2.16.2. Products
- 11.2.16.3. SWOT Analysis
- 11.2.16.4. Recent Developments
- 11.2.16.5. Financials (Based on Availability)
- 11.2.17 Golden Technologies
- 11.2.17.1. Overview
- 11.2.17.2. Products
- 11.2.17.3. SWOT Analysis
- 11.2.17.4. Recent Developments
- 11.2.17.5. Financials (Based on Availability)
- 11.2.18 Drive DeVilbiss Healthcare
- 11.2.18.1. Overview
- 11.2.18.2. Products
- 11.2.18.3. SWOT Analysis
- 11.2.18.4. Recent Developments
- 11.2.18.5. Financials (Based on Availability)
- 11.2.19 Breg
- 11.2.19.1. Overview
- 11.2.19.2. Products
- 11.2.19.3. SWOT Analysis
- 11.2.19.4. Recent Developments
- 11.2.19.5. Financials (Based on Availability)
- 11.2.20 Inc.
- 11.2.20.1. Overview
- 11.2.20.2. Products
- 11.2.20.3. SWOT Analysis
- 11.2.20.4. Recent Developments
- 11.2.20.5. Financials (Based on Availability)
- 11.2.21 Performance Health
- 11.2.21.1. Overview
- 11.2.21.2. Products
- 11.2.21.3. SWOT Analysis
- 11.2.21.4. Recent Developments
- 11.2.21.5. Financials (Based on Availability)
- 11.2.1 Permobil
List of Figures
- Figure 1: Global Mobility Aids Products Revenue Breakdown (million, %) by Region 2024 & 2032
- Figure 2: Global Mobility Aids Products Volume Breakdown (K, %) by Region 2024 & 2032
- Figure 3: North America Mobility Aids Products Revenue (million), by Application 2024 & 2032
- Figure 4: North America Mobility Aids Products Volume (K), by Application 2024 & 2032
- Figure 5: North America Mobility Aids Products Revenue Share (%), by Application 2024 & 2032
- Figure 6: North America Mobility Aids Products Volume Share (%), by Application 2024 & 2032
- Figure 7: North America Mobility Aids Products Revenue (million), by Types 2024 & 2032
- Figure 8: North America Mobility Aids Products Volume (K), by Types 2024 & 2032
- Figure 9: North America Mobility Aids Products Revenue Share (%), by Types 2024 & 2032
- Figure 10: North America Mobility Aids Products Volume Share (%), by Types 2024 & 2032
- Figure 11: North America Mobility Aids Products Revenue (million), by Country 2024 & 2032
- Figure 12: North America Mobility Aids Products Volume (K), by Country 2024 & 2032
- Figure 13: North America Mobility Aids Products Revenue Share (%), by Country 2024 & 2032
- Figure 14: North America Mobility Aids Products Volume Share (%), by Country 2024 & 2032
- Figure 15: South America Mobility Aids Products Revenue (million), by Application 2024 & 2032
- Figure 16: South America Mobility Aids Products Volume (K), by Application 2024 & 2032
- Figure 17: South America Mobility Aids Products Revenue Share (%), by Application 2024 & 2032
- Figure 18: South America Mobility Aids Products Volume Share (%), by Application 2024 & 2032
- Figure 19: South America Mobility Aids Products Revenue (million), by Types 2024 & 2032
- Figure 20: South America Mobility Aids Products Volume (K), by Types 2024 & 2032
- Figure 21: South America Mobility Aids Products Revenue Share (%), by Types 2024 & 2032
- Figure 22: South America Mobility Aids Products Volume Share (%), by Types 2024 & 2032
- Figure 23: South America Mobility Aids Products Revenue (million), by Country 2024 & 2032
- Figure 24: South America Mobility Aids Products Volume (K), by Country 2024 & 2032
- Figure 25: South America Mobility Aids Products Revenue Share (%), by Country 2024 & 2032
- Figure 26: South America Mobility Aids Products Volume Share (%), by Country 2024 & 2032
- Figure 27: Europe Mobility Aids Products Revenue (million), by Application 2024 & 2032
- Figure 28: Europe Mobility Aids Products Volume (K), by Application 2024 & 2032
- Figure 29: Europe Mobility Aids Products Revenue Share (%), by Application 2024 & 2032
- Figure 30: Europe Mobility Aids Products Volume Share (%), by Application 2024 & 2032
- Figure 31: Europe Mobility Aids Products Revenue (million), by Types 2024 & 2032
- Figure 32: Europe Mobility Aids Products Volume (K), by Types 2024 & 2032
- Figure 33: Europe Mobility Aids Products Revenue Share (%), by Types 2024 & 2032
- Figure 34: Europe Mobility Aids Products Volume Share (%), by Types 2024 & 2032
- Figure 35: Europe Mobility Aids Products Revenue (million), by Country 2024 & 2032
- Figure 36: Europe Mobility Aids Products Volume (K), by Country 2024 & 2032
- Figure 37: Europe Mobility Aids Products Revenue Share (%), by Country 2024 & 2032
- Figure 38: Europe Mobility Aids Products Volume Share (%), by Country 2024 & 2032
- Figure 39: Middle East & Africa Mobility Aids Products Revenue (million), by Application 2024 & 2032
- Figure 40: Middle East & Africa Mobility Aids Products Volume (K), by Application 2024 & 2032
- Figure 41: Middle East & Africa Mobility Aids Products Revenue Share (%), by Application 2024 & 2032
- Figure 42: Middle East & Africa Mobility Aids Products Volume Share (%), by Application 2024 & 2032
- Figure 43: Middle East & Africa Mobility Aids Products Revenue (million), by Types 2024 & 2032
- Figure 44: Middle East & Africa Mobility Aids Products Volume (K), by Types 2024 & 2032
- Figure 45: Middle East & Africa Mobility Aids Products Revenue Share (%), by Types 2024 & 2032
- Figure 46: Middle East & Africa Mobility Aids Products Volume Share (%), by Types 2024 & 2032
- Figure 47: Middle East & Africa Mobility Aids Products Revenue (million), by Country 2024 & 2032
- Figure 48: Middle East & Africa Mobility Aids Products Volume (K), by Country 2024 & 2032
- Figure 49: Middle East & Africa Mobility Aids Products Revenue Share (%), by Country 2024 & 2032
- Figure 50: Middle East & Africa Mobility Aids Products Volume Share (%), by Country 2024 & 2032
- Figure 51: Asia Pacific Mobility Aids Products Revenue (million), by Application 2024 & 2032
- Figure 52: Asia Pacific Mobility Aids Products Volume (K), by Application 2024 & 2032
- Figure 53: Asia Pacific Mobility Aids Products Revenue Share (%), by Application 2024 & 2032
- Figure 54: Asia Pacific Mobility Aids Products Volume Share (%), by Application 2024 & 2032
- Figure 55: Asia Pacific Mobility Aids Products Revenue (million), by Types 2024 & 2032
- Figure 56: Asia Pacific Mobility Aids Products Volume (K), by Types 2024 & 2032
- Figure 57: Asia Pacific Mobility Aids Products Revenue Share (%), by Types 2024 & 2032
- Figure 58: Asia Pacific Mobility Aids Products Volume Share (%), by Types 2024 & 2032
- Figure 59: Asia Pacific Mobility Aids Products Revenue (million), by Country 2024 & 2032
- Figure 60: Asia Pacific Mobility Aids Products Volume (K), by Country 2024 & 2032
- Figure 61: Asia Pacific Mobility Aids Products Revenue Share (%), by Country 2024 & 2032
- Figure 62: Asia Pacific Mobility Aids Products Volume Share (%), by Country 2024 & 2032
List of Tables
- Table 1: Global Mobility Aids Products Revenue million Forecast, by Region 2019 & 2032
- Table 2: Global Mobility Aids Products Volume K Forecast, by Region 2019 & 2032
- Table 3: Global Mobility Aids Products Revenue million Forecast, by Application 2019 & 2032
- Table 4: Global Mobility Aids Products Volume K Forecast, by Application 2019 & 2032
- Table 5: Global Mobility Aids Products Revenue million Forecast, by Types 2019 & 2032
- Table 6: Global Mobility Aids Products Volume K Forecast, by Types 2019 & 2032
- Table 7: Global Mobility Aids Products Revenue million Forecast, by Region 2019 & 2032
- Table 8: Global Mobility Aids Products Volume K Forecast, by Region 2019 & 2032
- Table 9: Global Mobility Aids Products Revenue million Forecast, by Application 2019 & 2032
- Table 10: Global Mobility Aids Products Volume K Forecast, by Application 2019 & 2032
- Table 11: Global Mobility Aids Products Revenue million Forecast, by Types 2019 & 2032
- Table 12: Global Mobility Aids Products Volume K Forecast, by Types 2019 & 2032
- Table 13: Global Mobility Aids Products Revenue million Forecast, by Country 2019 & 2032
- Table 14: Global Mobility Aids Products Volume K Forecast, by Country 2019 & 2032
- Table 15: United States Mobility Aids Products Revenue (million) Forecast, by Application 2019 & 2032
- Table 16: United States Mobility Aids Products Volume (K) Forecast, by Application 2019 & 2032
- Table 17: Canada Mobility Aids Products Revenue (million) Forecast, by Application 2019 & 2032
- Table 18: Canada Mobility Aids Products Volume (K) Forecast, by Application 2019 & 2032
- Table 19: Mexico Mobility Aids Products Revenue (million) Forecast, by Application 2019 & 2032
- Table 20: Mexico Mobility Aids Products Volume (K) Forecast, by Application 2019 & 2032
- Table 21: Global Mobility Aids Products Revenue million Forecast, by Application 2019 & 2032
- Table 22: Global Mobility Aids Products Volume K Forecast, by Application 2019 & 2032
- Table 23: Global Mobility Aids Products Revenue million Forecast, by Types 2019 & 2032
- Table 24: Global Mobility Aids Products Volume K Forecast, by Types 2019 & 2032
- Table 25: Global Mobility Aids Products Revenue million Forecast, by Country 2019 & 2032
- Table 26: Global Mobility Aids Products Volume K Forecast, by Country 2019 & 2032
- Table 27: Brazil Mobility Aids Products Revenue (million) Forecast, by Application 2019 & 2032
- Table 28: Brazil Mobility Aids Products Volume (K) Forecast, by Application 2019 & 2032
- Table 29: Argentina Mobility Aids Products Revenue (million) Forecast, by Application 2019 & 2032
- Table 30: Argentina Mobility Aids Products Volume (K) Forecast, by Application 2019 & 2032
- Table 31: Rest of South America Mobility Aids Products Revenue (million) Forecast, by Application 2019 & 2032
- Table 32: Rest of South America Mobility Aids Products Volume (K) Forecast, by Application 2019 & 2032
- Table 33: Global Mobility Aids Products Revenue million Forecast, by Application 2019 & 2032
- Table 34: Global Mobility Aids Products Volume K Forecast, by Application 2019 & 2032
- Table 35: Global Mobility Aids Products Revenue million Forecast, by Types 2019 & 2032
- Table 36: Global Mobility Aids Products Volume K Forecast, by Types 2019 & 2032
- Table 37: Global Mobility Aids Products Revenue million Forecast, by Country 2019 & 2032
- Table 38: Global Mobility Aids Products Volume K Forecast, by Country 2019 & 2032
- Table 39: United Kingdom Mobility Aids Products Revenue (million) Forecast, by Application 2019 & 2032
- Table 40: United Kingdom Mobility Aids Products Volume (K) Forecast, by Application 2019 & 2032
- Table 41: Germany Mobility Aids Products Revenue (million) Forecast, by Application 2019 & 2032
- Table 42: Germany Mobility Aids Products Volume (K) Forecast, by Application 2019 & 2032
- Table 43: France Mobility Aids Products Revenue (million) Forecast, by Application 2019 & 2032
- Table 44: France Mobility Aids Products Volume (K) Forecast, by Application 2019 & 2032
- Table 45: Italy Mobility Aids Products Revenue (million) Forecast, by Application 2019 & 2032
- Table 46: Italy Mobility Aids Products Volume (K) Forecast, by Application 2019 & 2032
- Table 47: Spain Mobility Aids Products Revenue (million) Forecast, by Application 2019 & 2032
- Table 48: Spain Mobility Aids Products Volume (K) Forecast, by Application 2019 & 2032
- Table 49: Russia Mobility Aids Products Revenue (million) Forecast, by Application 2019 & 2032
- Table 50: Russia Mobility Aids Products Volume (K) Forecast, by Application 2019 & 2032
- Table 51: Benelux Mobility Aids Products Revenue (million) Forecast, by Application 2019 & 2032
- Table 52: Benelux Mobility Aids Products Volume (K) Forecast, by Application 2019 & 2032
- Table 53: Nordics Mobility Aids Products Revenue (million) Forecast, by Application 2019 & 2032
- Table 54: Nordics Mobility Aids Products Volume (K) Forecast, by Application 2019 & 2032
- Table 55: Rest of Europe Mobility Aids Products Revenue (million) Forecast, by Application 2019 & 2032
- Table 56: Rest of Europe Mobility Aids Products Volume (K) Forecast, by Application 2019 & 2032
- Table 57: Global Mobility Aids Products Revenue million Forecast, by Application 2019 & 2032
- Table 58: Global Mobility Aids Products Volume K Forecast, by Application 2019 & 2032
- Table 59: Global Mobility Aids Products Revenue million Forecast, by Types 2019 & 2032
- Table 60: Global Mobility Aids Products Volume K Forecast, by Types 2019 & 2032
- Table 61: Global Mobility Aids Products Revenue million Forecast, by Country 2019 & 2032
- Table 62: Global Mobility Aids Products Volume K Forecast, by Country 2019 & 2032
- Table 63: Turkey Mobility Aids Products Revenue (million) Forecast, by Application 2019 & 2032
- Table 64: Turkey Mobility Aids Products Volume (K) Forecast, by Application 2019 & 2032
- Table 65: Israel Mobility Aids Products Revenue (million) Forecast, by Application 2019 & 2032
- Table 66: Israel Mobility Aids Products Volume (K) Forecast, by Application 2019 & 2032
- Table 67: GCC Mobility Aids Products Revenue (million) Forecast, by Application 2019 & 2032
- Table 68: GCC Mobility Aids Products Volume (K) Forecast, by Application 2019 & 2032
- Table 69: North Africa Mobility Aids Products Revenue (million) Forecast, by Application 2019 & 2032
- Table 70: North Africa Mobility Aids Products Volume (K) Forecast, by Application 2019 & 2032
- Table 71: South Africa Mobility Aids Products Revenue (million) Forecast, by Application 2019 & 2032
- Table 72: South Africa Mobility Aids Products Volume (K) Forecast, by Application 2019 & 2032
- Table 73: Rest of Middle East & Africa Mobility Aids Products Revenue (million) Forecast, by Application 2019 & 2032
- Table 74: Rest of Middle East & Africa Mobility Aids Products Volume (K) Forecast, by Application 2019 & 2032
- Table 75: Global Mobility Aids Products Revenue million Forecast, by Application 2019 & 2032
- Table 76: Global Mobility Aids Products Volume K Forecast, by Application 2019 & 2032
- Table 77: Global Mobility Aids Products Revenue million Forecast, by Types 2019 & 2032
- Table 78: Global Mobility Aids Products Volume K Forecast, by Types 2019 & 2032
- Table 79: Global Mobility Aids Products Revenue million Forecast, by Country 2019 & 2032
- Table 80: Global Mobility Aids Products Volume K Forecast, by Country 2019 & 2032
- Table 81: China Mobility Aids Products Revenue (million) Forecast, by Application 2019 & 2032
- Table 82: China Mobility Aids Products Volume (K) Forecast, by Application 2019 & 2032
- Table 83: India Mobility Aids Products Revenue (million) Forecast, by Application 2019 & 2032
- Table 84: India Mobility Aids Products Volume (K) Forecast, by Application 2019 & 2032
- Table 85: Japan Mobility Aids Products Revenue (million) Forecast, by Application 2019 & 2032
- Table 86: Japan Mobility Aids Products Volume (K) Forecast, by Application 2019 & 2032
- Table 87: South Korea Mobility Aids Products Revenue (million) Forecast, by Application 2019 & 2032
- Table 88: South Korea Mobility Aids Products Volume (K) Forecast, by Application 2019 & 2032
- Table 89: ASEAN Mobility Aids Products Revenue (million) Forecast, by Application 2019 & 2032
- Table 90: ASEAN Mobility Aids Products Volume (K) Forecast, by Application 2019 & 2032
- Table 91: Oceania Mobility Aids Products Revenue (million) Forecast, by Application 2019 & 2032
- Table 92: Oceania Mobility Aids Products Volume (K) Forecast, by Application 2019 & 2032
- Table 93: Rest of Asia Pacific Mobility Aids Products Revenue (million) Forecast, by Application 2019 & 2032
- Table 94: Rest of Asia Pacific Mobility Aids Products Volume (K) Forecast, by Application 2019 & 2032
Frequently Asked Questions
1. What is the projected Compound Annual Growth Rate (CAGR) of the Mobility Aids Products?
The projected CAGR is approximately XX%.
2. Which companies are prominent players in the Mobility Aids Products?
Key companies in the market include Permobil, Invacare, Sunrise Medical, Pride Mobility, Ottobock, Medline, Hoveround Corp, Drive Medical, Hubang, Merits Health Products, Nissin Medical, N.V. Vermeiren, Heartway, GF Health, Karman, EZ Lite Cruiser, Golden Technologies, Drive DeVilbiss Healthcare, Breg, Inc., Performance Health.
3. What are the main segments of the Mobility Aids Products?
The market segments include Application, Types.
4. Can you provide details about the market size?
The market size is estimated to be USD XXX million as of 2022.
5. What are some drivers contributing to market growth?
N/A
6. What are the notable trends driving market growth?
N/A
7. Are there any restraints impacting market growth?
N/A
8. Can you provide examples of recent developments in the market?
N/A
9. What pricing options are available for accessing the report?
Pricing options include single-user, multi-user, and enterprise licenses priced at USD 3350.00, USD 5025.00, and USD 6700.00 respectively.
10. Is the market size provided in terms of value or volume?
The market size is provided in terms of value, measured in million and volume, measured in K.
11. Are there any specific market keywords associated with the report?
Yes, the market keyword associated with the report is "Mobility Aids Products," which aids in identifying and referencing the specific market segment covered.
12. How do I determine which pricing option suits my needs best?
The pricing options vary based on user requirements and access needs. Individual users may opt for single-user licenses, while businesses requiring broader access may choose multi-user or enterprise licenses for cost-effective access to the report.
13. Are there any additional resources or data provided in the Mobility Aids Products report?
While the report offers comprehensive insights, it's advisable to review the specific contents or supplementary materials provided to ascertain if additional resources or data are available.
14. How can I stay updated on further developments or reports in the Mobility Aids Products?
To stay informed about further developments, trends, and reports in the Mobility Aids Products, consider subscribing to industry newsletters, following relevant companies and organizations, or regularly checking reputable industry news sources and publications.
Methodology
Step 1 - Identification of Relevant Samples Size from Population Database


Step 2 - Approaches for Defining Global Market Size (Value, Volume* & Price*)

Note*: In applicable scenarios
Step 3 - Data Sources
Primary Research
- Web Analytics
- Survey Reports
- Research Institute
- Latest Research Reports
- Opinion Leaders
Secondary Research
- Annual Reports
- White Paper
- Latest Press Release
- Industry Association
- Paid Database
- Investor Presentations

Step 4 - Data Triangulation
Involves using different sources of information in order to increase the validity of a study
These sources are likely to be stakeholders in a program - participants, other researchers, program staff, other community members, and so on.
Then we put all data in single framework & apply various statistical tools to find out the dynamic on the market.
During the analysis stage, feedback from the stakeholder groups would be compared to determine areas of agreement as well as areas of divergence


