

Key Insights
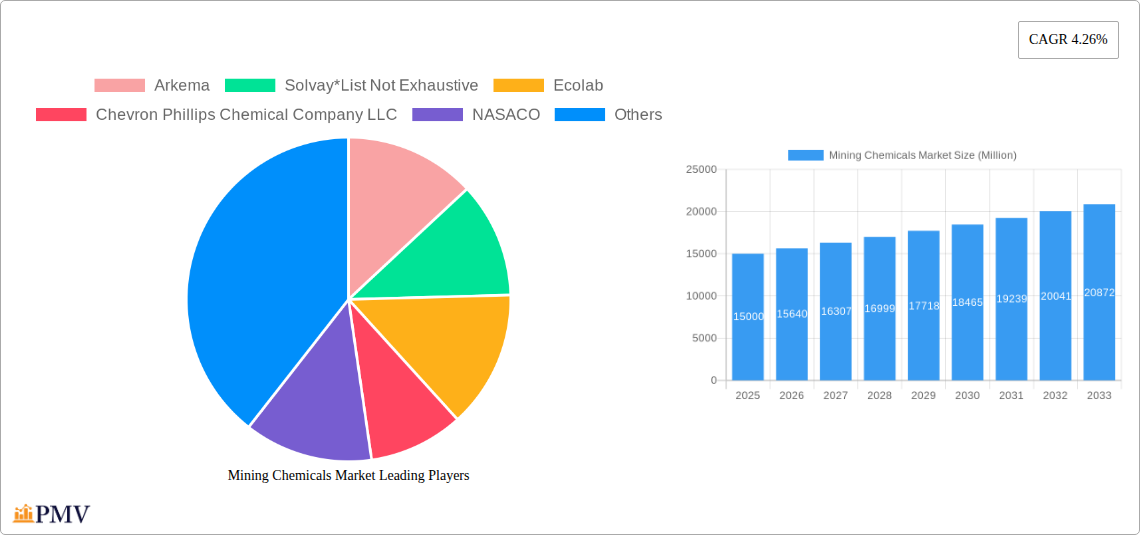
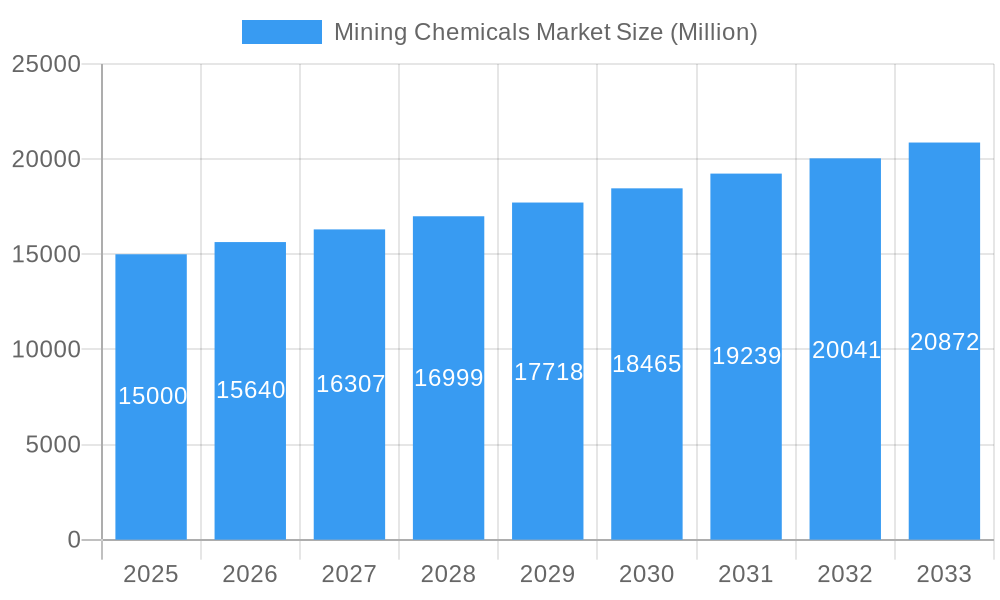
The global mining chemicals market, valued at approximately $XX million in 2025, is projected to experience robust growth, driven by a compound annual growth rate (CAGR) of 4.26% from 2025 to 2033. This expansion is fueled by several key factors. The increasing demand for minerals and metals across various industries, including construction, electronics, and automotive, necessitates efficient and sustainable mining practices. This, in turn, drives the demand for specialized chemicals crucial for various stages of the mining process, such as mineral processing, flotation, and wastewater treatment. Furthermore, stringent environmental regulations are pushing mining companies to adopt eco-friendly extraction and processing techniques, leading to higher adoption of advanced mining chemicals that minimize environmental impact. Technological advancements in chemical formulations, offering improved performance and reduced consumption, also contribute significantly to market growth. The market is segmented by function (flotation chemicals, dispersants, extractants, grinding aids) and application (mineral processing, wastewater treatment). Mineral processing currently dominates, but the wastewater treatment segment is expected to exhibit faster growth due to increasing environmental awareness and regulations. Key players like Arkema, Solvay, Ecolab, and BASF are investing heavily in R&D and strategic partnerships to maintain a competitive edge. Geographic growth is expected across all regions, with Asia-Pacific, driven by robust industrialization and mining activities in China and India, representing a significant market share.
Mining Chemicals Market Market Size (In Billion)
The market's growth trajectory is, however, subject to certain restraints. Fluctuations in commodity prices, particularly those of metals and minerals, can significantly impact mining activities and, consequently, demand for chemicals. Moreover, the mining industry's cyclical nature and potential economic downturns influence overall market performance. Despite these challenges, the long-term outlook remains positive, driven by the continuous need for mineral extraction to meet global demand, coupled with the industry's increasing focus on sustainability and operational efficiency. This focus on sustainability is further creating opportunities for the development and adoption of bio-based and less harmful mining chemicals, offering a unique avenue for growth within the market. The competitive landscape is characterized by both large multinational corporations and specialized chemical producers, leading to continuous innovation and competitive pricing.
Mining Chemicals Market Company Market Share
Mining Chemicals Market: A Comprehensive Report (2019-2033)
This in-depth report provides a comprehensive analysis of the global Mining Chemicals Market, offering invaluable insights for industry stakeholders, investors, and researchers. Covering the period 2019-2033, with a base year of 2025 and a forecast period of 2025-2033, this report delves into market structure, competitive dynamics, industry trends, dominant segments, and future outlook. The market is projected to reach xx Million by 2033, exhibiting a CAGR of xx% during the forecast period.
Mining Chemicals Market Market Structure & Competitive Dynamics
The Mining Chemicals Market is characterized by a moderately concentrated structure, with several multinational corporations holding significant market share. Key players like Arkema, Solvay, Ecolab, and BASF SE compete fiercely, driving innovation and influencing pricing strategies. The market's innovation ecosystem is robust, with ongoing research and development focused on enhancing product efficiency, sustainability, and environmental performance. Regulatory frameworks, including environmental regulations and safety standards, significantly impact market dynamics. Product substitutes, such as alternative extraction methods, pose a moderate competitive threat. End-user trends, particularly towards sustainable mining practices, are reshaping demand patterns.
Mergers and acquisitions (M&A) activity is relatively high, reflecting the consolidation trend within the industry. Recent deals, like Orica Limited's acquisition of Cyanco and Ecolab’s acquisition of Flottec, highlight the strategic importance of expanding product portfolios and market reach. These transactions demonstrate the strategic focus on enhancing mining chemical production and distribution. The total value of M&A deals in the Mining Chemicals Market between 2019 and 2024 is estimated at xx Million. Market share data for key players is included in the detailed report.
- High level of M&A activity.
- Strong focus on sustainability.
- Significant impact of environmental regulations.
Mining Chemicals Market Industry Trends & Insights
The Mining Chemicals Market is experiencing robust growth, driven by the increasing demand for minerals and metals globally, coupled with technological advancements in mining operations. Technological disruptions, such as the adoption of automation and digitalization in mining, are improving efficiency and productivity, thereby increasing the demand for specialized mining chemicals. Consumer preferences are shifting towards eco-friendly and sustainable mining practices, compelling manufacturers to develop greener products. Competitive dynamics are intense, with companies vying for market share through innovation, strategic partnerships, and acquisitions. The market penetration of advanced flotation chemicals is increasing significantly.
Growth is being fueled by several key drivers including:
- Expansion of mining activities across various regions
- Rising demand for critical minerals for renewable energy technologies
- Growing focus on improving extraction efficiency
- Technological advancements in flotation and extraction processes
This market is also characterized by the increasing use of data analytics and AI to optimize mining operations, which necessitates highly efficient and specialized chemicals.
Dominant Markets & Segments in Mining Chemicals Market
The Asia-Pacific region currently dominates the Mining Chemicals Market, driven by significant mining activities and robust economic growth. China and Australia are key contributors to this regional dominance. Within the segments:
- Function: Flotation chemicals constitute the largest segment, driven by their crucial role in mineral separation processes.
- Dispersants: The demand for dispersants is experiencing steady growth due to their efficacy in reducing slurry viscosity and improving extraction efficiency.
- Extractants: The extractants segment exhibits notable growth, propelled by the increasing adoption of solvent extraction technologies.
- Application: Mineral processing accounts for the largest share, while wastewater treatment is a fast-growing segment driven by stringent environmental regulations.
Key drivers for regional dominance include:
- Asia-Pacific: Abundant mineral reserves, rapid industrialization, and government support for mining projects.
- North America: Established mining industry, technological advancements, and stringent environmental regulations driving demand for sophisticated chemicals.
The detailed report provides a more in-depth breakdown of the regional and segment-wise analysis, including granular data on market size and growth projections.
Mining Chemicals Market Product Innovations
Recent product innovations focus on improving the efficiency, selectivity, and environmental friendliness of mining chemicals. This includes the development of bio-based and biodegradable alternatives to conventional chemicals, as well as enhanced formulations with improved performance characteristics. These innovations aim to address growing environmental concerns and meet the evolving needs of the mining industry. The market is witnessing a trend toward customized solutions tailored to specific mineral types and mining conditions.
Report Segmentation & Scope
This report segments the Mining Chemicals Market based on function (flotation chemicals, dispersants, extractants, grinding aids), application (mineral processing, wastewater treatment), and geography. Each segment is analyzed in detail, providing market size, growth projections, and competitive dynamics. The report considers various factors that influence market growth, like technological advancements and environmental regulations. The granular level of detail will offer readers an accurate and insightful perspective of each segment.
Key Drivers of Mining Chemicals Market Growth
The Mining Chemicals Market's growth is primarily driven by the rising global demand for minerals and metals, fuelled by expanding industrialization and urbanization. Technological advancements in mining processes, including automation and the adoption of sophisticated separation techniques, are enhancing efficiency and productivity, further driving demand. Favorable government policies and initiatives promoting sustainable mining practices are contributing to market growth. These policies, in addition to infrastructure development, are promoting responsible mining activities.
Challenges in the Mining Chemicals Market Sector
The Mining Chemicals Market faces several challenges, including stringent environmental regulations requiring manufacturers to develop more sustainable products. Fluctuations in raw material prices and supply chain disruptions can impact production costs and profitability. Intense competition from established players and new entrants necessitates constant innovation and cost optimization to maintain market share. Moreover, volatility in global commodity prices and economic downturns can significantly impact demand. For example, xx% of the companies surveyed reported supply chain issues leading to xx Million in losses.
Leading Players in the Mining Chemicals Market Market
- Arkema
- Solvay
- Ecolab
- Chevron Phillips Chemical Company LLC
- NASACO
- Qingdao Ruchang Mining Industry Co Ltd
- 3M
- BASF SE
- FMC Corporation
- AECI
- Kemira
- Sasol Limited
- Betachem (Pty) Ltd
- Indorama Ventures Public Limited
- CLARIANT
- CTC (Tennant Consolidated Group)
- Orica Limited
- SNF Group
Key Developments in Mining Chemicals Market Sector
- February 2024: Orica Limited announced the acquisition of Cyanco, strengthening its position in the gold mining chemicals market.
- November 2023: Nalco Water (Ecolab) acquired Flottec, expanding its presence in flotation products and services.
Strategic Mining Chemicals Market Market Outlook
The Mining Chemicals Market is poised for continued growth, driven by the increasing demand for minerals and metals, technological advancements, and the focus on sustainable mining practices. Strategic opportunities exist for companies to invest in research and development, expand their product portfolios, and explore new markets. The focus on sustainable and environmentally friendly solutions will be crucial for future success. Furthermore, strategic partnerships and acquisitions will play a key role in shaping the competitive landscape.
Mining Chemicals Market Segmentation
-
1. Function
-
1.1. Flotation Chemicals
- 1.1.1. Collectors
- 1.1.2. Depressants
- 1.1.3. Flocculants
- 1.1.4. Frothers
- 1.1.5. Dispersants
-
1.2. Extraction Chemicals
- 1.2.1. Diluents
- 1.2.2. Extractants
- 1.3. Grinding Aids
-
1.1. Flotation Chemicals
-
2. Application
- 2.1. Mineral Processing
- 2.2. Wastewater Treatment
Mining Chemicals Market Segmentation By Geography
-
1. Asia Pacific
- 1.1. China
- 1.2. India
- 1.3. Japan
- 1.4. South Korea
- 1.5. Indonesia
- 1.6. Malaysia
- 1.7. Australia and New Zealand
- 1.8. Rest of Asia Pacific
-
2. North America
- 2.1. United States
- 2.2. Canada
- 2.3. Mexico
-
3. Europe
- 3.1. Germany
- 3.2. United Kingdom
- 3.3. France
- 3.4. Italy
- 3.5. Russia
- 3.6. Rest of Europe
-
4. South America
- 4.1. Brazil
- 4.2. Argentina
- 4.3. Rest of South America
-
5. Middle East and Africa
- 5.1. Nigeria
- 5.2. South Africa
- 5.3. Tanzania
- 5.4. Rest of Middle East and Africa
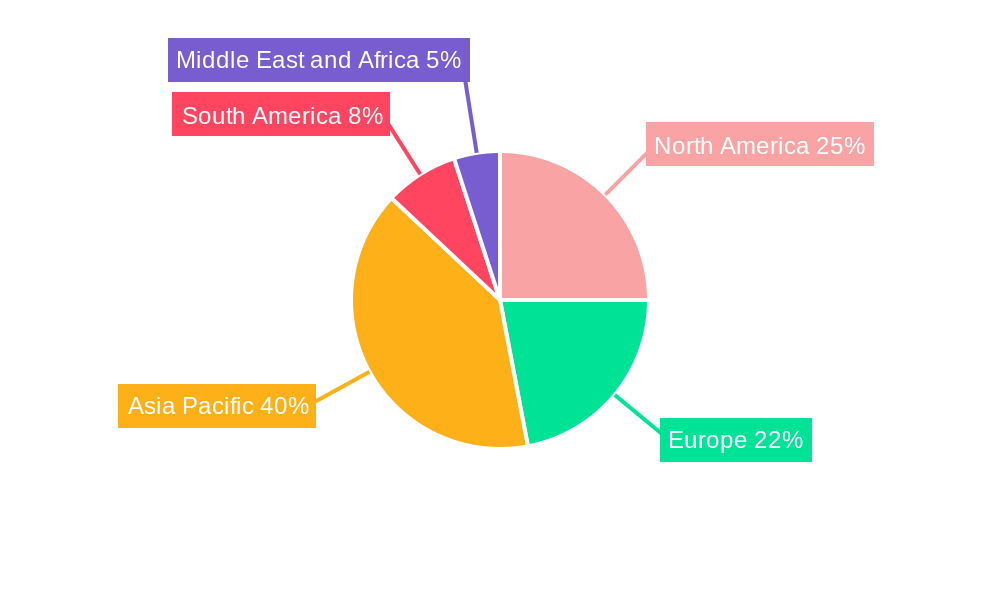
Mining Chemicals Market Regional Market Share
Geographic Coverage of Mining Chemicals Market
Mining Chemicals Market REPORT HIGHLIGHTS
| Aspects | Details |
|---|---|
| Study Period | 2020-2034 |
| Base Year | 2025 |
| Estimated Year | 2026 |
| Forecast Period | 2026-2034 |
| Historical Period | 2020-2025 |
| Growth Rate | CAGR of 4.26% from 2020-2034 |
| Segmentation |
|
Table of Contents
- 1. Introduction
- 1.1. Research Scope
- 1.2. Market Segmentation
- 1.3. Research Objective
- 1.4. Definitions and Assumptions
- 2. Executive Summary
- 2.1. Market Snapshot
- 3. Market Dynamics
- 3.1. Market Drivers
- 3.2. Market Restrains
- 3.3. Market Trends
- 3.4. Market Opportunities
- 4. Market Factor Analysis
- 4.1. Porters Five Forces
- 4.1.1. Bargaining Power of Suppliers
- 4.1.2. Bargaining Power of Buyers
- 4.1.3. Threat of New Entrants
- 4.1.4. Threat of Substitutes
- 4.1.5. Competitive Rivalry
- 4.2. PESTEL analysis
- 4.3. BCG Analysis
- 4.3.1. Stars (High Growth, High Market Share)
- 4.3.2. Cash Cows (Low Growth, High Market Share)
- 4.3.3. Question Mark (High Growth, Low Market Share)
- 4.3.4. Dogs (Low Growth, Low Market Share)
- 4.4. Ansoff Matrix Analysis
- 4.5. Supply Chain Analysis
- 4.6. Regulatory Landscape
- 4.7. Current Market Potential and Opportunity Assessment (TAM–SAM–SOM Framework)
- 4.8. PMV Analyst Note
- 4.1. Porters Five Forces
- 5. Market Analysis, Insights and Forecast 2021-2033
- 5.1. Market Analysis, Insights and Forecast - by Function
- 5.1.1. Flotation Chemicals
- 5.1.1.1. Collectors
- 5.1.1.2. Depressants
- 5.1.1.3. Flocculants
- 5.1.1.4. Frothers
- 5.1.1.5. Dispersants
- 5.1.2. Extraction Chemicals
- 5.1.2.1. Diluents
- 5.1.2.2. Extractants
- 5.1.3. Grinding Aids
- 5.1.1. Flotation Chemicals
- 5.2. Market Analysis, Insights and Forecast - by Application
- 5.2.1. Mineral Processing
- 5.2.2. Wastewater Treatment
- 5.3. Market Analysis, Insights and Forecast - by Region
- 5.3.1. Asia Pacific
- 5.3.2. North America
- 5.3.3. Europe
- 5.3.4. South America
- 5.3.5. Middle East and Africa
- 5.1. Market Analysis, Insights and Forecast - by Function
- 6. Global Mining Chemicals Market Analysis, Insights and Forecast, 2021-2033
- 6.1. Market Analysis, Insights and Forecast - by Function
- 6.1.1. Flotation Chemicals
- 6.1.1.1. Collectors
- 6.1.1.2. Depressants
- 6.1.1.3. Flocculants
- 6.1.1.4. Frothers
- 6.1.1.5. Dispersants
- 6.1.2. Extraction Chemicals
- 6.1.2.1. Diluents
- 6.1.2.2. Extractants
- 6.1.3. Grinding Aids
- 6.1.1. Flotation Chemicals
- 6.2. Market Analysis, Insights and Forecast - by Application
- 6.2.1. Mineral Processing
- 6.2.2. Wastewater Treatment
- 6.1. Market Analysis, Insights and Forecast - by Function
- 7. Asia Pacific Mining Chemicals Market Analysis, Insights and Forecast, 2020-2032
- 7.1. Market Analysis, Insights and Forecast - by Function
- 7.1.1. Flotation Chemicals
- 7.1.1.1. Collectors
- 7.1.1.2. Depressants
- 7.1.1.3. Flocculants
- 7.1.1.4. Frothers
- 7.1.1.5. Dispersants
- 7.1.2. Extraction Chemicals
- 7.1.2.1. Diluents
- 7.1.2.2. Extractants
- 7.1.3. Grinding Aids
- 7.1.1. Flotation Chemicals
- 7.2. Market Analysis, Insights and Forecast - by Application
- 7.2.1. Mineral Processing
- 7.2.2. Wastewater Treatment
- 7.1. Market Analysis, Insights and Forecast - by Function
- 8. North America Mining Chemicals Market Analysis, Insights and Forecast, 2020-2032
- 8.1. Market Analysis, Insights and Forecast - by Function
- 8.1.1. Flotation Chemicals
- 8.1.1.1. Collectors
- 8.1.1.2. Depressants
- 8.1.1.3. Flocculants
- 8.1.1.4. Frothers
- 8.1.1.5. Dispersants
- 8.1.2. Extraction Chemicals
- 8.1.2.1. Diluents
- 8.1.2.2. Extractants
- 8.1.3. Grinding Aids
- 8.1.1. Flotation Chemicals
- 8.2. Market Analysis, Insights and Forecast - by Application
- 8.2.1. Mineral Processing
- 8.2.2. Wastewater Treatment
- 8.1. Market Analysis, Insights and Forecast - by Function
- 9. Europe Mining Chemicals Market Analysis, Insights and Forecast, 2020-2032
- 9.1. Market Analysis, Insights and Forecast - by Function
- 9.1.1. Flotation Chemicals
- 9.1.1.1. Collectors
- 9.1.1.2. Depressants
- 9.1.1.3. Flocculants
- 9.1.1.4. Frothers
- 9.1.1.5. Dispersants
- 9.1.2. Extraction Chemicals
- 9.1.2.1. Diluents
- 9.1.2.2. Extractants
- 9.1.3. Grinding Aids
- 9.1.1. Flotation Chemicals
- 9.2. Market Analysis, Insights and Forecast - by Application
- 9.2.1. Mineral Processing
- 9.2.2. Wastewater Treatment
- 9.1. Market Analysis, Insights and Forecast - by Function
- 10. South America Mining Chemicals Market Analysis, Insights and Forecast, 2020-2032
- 10.1. Market Analysis, Insights and Forecast - by Function
- 10.1.1. Flotation Chemicals
- 10.1.1.1. Collectors
- 10.1.1.2. Depressants
- 10.1.1.3. Flocculants
- 10.1.1.4. Frothers
- 10.1.1.5. Dispersants
- 10.1.2. Extraction Chemicals
- 10.1.2.1. Diluents
- 10.1.2.2. Extractants
- 10.1.3. Grinding Aids
- 10.1.1. Flotation Chemicals
- 10.2. Market Analysis, Insights and Forecast - by Application
- 10.2.1. Mineral Processing
- 10.2.2. Wastewater Treatment
- 10.1. Market Analysis, Insights and Forecast - by Function
- 11. Middle East and Africa Mining Chemicals Market Analysis, Insights and Forecast, 2020-2032
- 11.1. Market Analysis, Insights and Forecast - by Function
- 11.1.1. Flotation Chemicals
- 11.1.1.1. Collectors
- 11.1.1.2. Depressants
- 11.1.1.3. Flocculants
- 11.1.1.4. Frothers
- 11.1.1.5. Dispersants
- 11.1.2. Extraction Chemicals
- 11.1.2.1. Diluents
- 11.1.2.2. Extractants
- 11.1.3. Grinding Aids
- 11.1.1. Flotation Chemicals
- 11.2. Market Analysis, Insights and Forecast - by Application
- 11.2.1. Mineral Processing
- 11.2.2. Wastewater Treatment
- 11.1. Market Analysis, Insights and Forecast - by Function
- 12. Competitive Analysis
- 12.1. Company Profiles
- 12.1.1 Arkema
- 12.1.1.1. Company Overview
- 12.1.1.2. Products
- 12.1.1.3. Company Financials
- 12.1.1.4. SWOT Analysis
- 12.1.2 Solvay*List Not Exhaustive
- 12.1.2.1. Company Overview
- 12.1.2.2. Products
- 12.1.2.3. Company Financials
- 12.1.2.4. SWOT Analysis
- 12.1.3 Ecolab
- 12.1.3.1. Company Overview
- 12.1.3.2. Products
- 12.1.3.3. Company Financials
- 12.1.3.4. SWOT Analysis
- 12.1.4 Chevron Phillips Chemical Company LLC
- 12.1.4.1. Company Overview
- 12.1.4.2. Products
- 12.1.4.3. Company Financials
- 12.1.4.4. SWOT Analysis
- 12.1.5 NASACO
- 12.1.5.1. Company Overview
- 12.1.5.2. Products
- 12.1.5.3. Company Financials
- 12.1.5.4. SWOT Analysis
- 12.1.6 Qingdao Ruchang Mining Industry Co Ltd
- 12.1.6.1. Company Overview
- 12.1.6.2. Products
- 12.1.6.3. Company Financials
- 12.1.6.4. SWOT Analysis
- 12.1.7 3M
- 12.1.7.1. Company Overview
- 12.1.7.2. Products
- 12.1.7.3. Company Financials
- 12.1.7.4. SWOT Analysis
- 12.1.8 BASF SE
- 12.1.8.1. Company Overview
- 12.1.8.2. Products
- 12.1.8.3. Company Financials
- 12.1.8.4. SWOT Analysis
- 12.1.9 FMC Corporation
- 12.1.9.1. Company Overview
- 12.1.9.2. Products
- 12.1.9.3. Company Financials
- 12.1.9.4. SWOT Analysis
- 12.1.10 AECI
- 12.1.10.1. Company Overview
- 12.1.10.2. Products
- 12.1.10.3. Company Financials
- 12.1.10.4. SWOT Analysis
- 12.1.11 Kemira
- 12.1.11.1. Company Overview
- 12.1.11.2. Products
- 12.1.11.3. Company Financials
- 12.1.11.4. SWOT Analysis
- 12.1.12 Sasol Limited
- 12.1.12.1. Company Overview
- 12.1.12.2. Products
- 12.1.12.3. Company Financials
- 12.1.12.4. SWOT Analysis
- 12.1.13 Betachem (Pty) Ltd
- 12.1.13.1. Company Overview
- 12.1.13.2. Products
- 12.1.13.3. Company Financials
- 12.1.13.4. SWOT Analysis
- 12.1.14 Indorama Ventures Public Limited
- 12.1.14.1. Company Overview
- 12.1.14.2. Products
- 12.1.14.3. Company Financials
- 12.1.14.4. SWOT Analysis
- 12.1.15 CLARIANT
- 12.1.15.1. Company Overview
- 12.1.15.2. Products
- 12.1.15.3. Company Financials
- 12.1.15.4. SWOT Analysis
- 12.1.16 CTC (Tennant Consolidated Group)
- 12.1.16.1. Company Overview
- 12.1.16.2. Products
- 12.1.16.3. Company Financials
- 12.1.16.4. SWOT Analysis
- 12.1.17 Orica Limited
- 12.1.17.1. Company Overview
- 12.1.17.2. Products
- 12.1.17.3. Company Financials
- 12.1.17.4. SWOT Analysis
- 12.1.18 SNF Group
- 12.1.18.1. Company Overview
- 12.1.18.2. Products
- 12.1.18.3. Company Financials
- 12.1.18.4. SWOT Analysis
- 12.1.1 Arkema
- 12.2. Market Entropy
- 12.2.1 Company's Key Areas Served
- 12.2.2 Recent Developments
- 12.3. Company Market Share Analysis 2025
- 12.3.1 Top 5 Companies Market Share Analysis
- 12.3.2 Top 3 Companies Market Share Analysis
- 12.4. List of Potential Customers
- 13. Research Methodology
List of Figures
- Figure 1: Global Mining Chemicals Market Revenue Breakdown (Million, %) by Region 2025 & 2033
- Figure 2: Global Mining Chemicals Market Volume Breakdown (Million, %) by Region 2025 & 2033
- Figure 3: Asia Pacific Mining Chemicals Market Revenue (Million), by Function 2025 & 2033
- Figure 4: Asia Pacific Mining Chemicals Market Volume (Million), by Function 2025 & 2033
- Figure 5: Asia Pacific Mining Chemicals Market Revenue Share (%), by Function 2025 & 2033
- Figure 6: Asia Pacific Mining Chemicals Market Volume Share (%), by Function 2025 & 2033
- Figure 7: Asia Pacific Mining Chemicals Market Revenue (Million), by Application 2025 & 2033
- Figure 8: Asia Pacific Mining Chemicals Market Volume (Million), by Application 2025 & 2033
- Figure 9: Asia Pacific Mining Chemicals Market Revenue Share (%), by Application 2025 & 2033
- Figure 10: Asia Pacific Mining Chemicals Market Volume Share (%), by Application 2025 & 2033
- Figure 11: Asia Pacific Mining Chemicals Market Revenue (Million), by Country 2025 & 2033
- Figure 12: Asia Pacific Mining Chemicals Market Volume (Million), by Country 2025 & 2033
- Figure 13: Asia Pacific Mining Chemicals Market Revenue Share (%), by Country 2025 & 2033
- Figure 14: Asia Pacific Mining Chemicals Market Volume Share (%), by Country 2025 & 2033
- Figure 15: North America Mining Chemicals Market Revenue (Million), by Function 2025 & 2033
- Figure 16: North America Mining Chemicals Market Volume (Million), by Function 2025 & 2033
- Figure 17: North America Mining Chemicals Market Revenue Share (%), by Function 2025 & 2033
- Figure 18: North America Mining Chemicals Market Volume Share (%), by Function 2025 & 2033
- Figure 19: North America Mining Chemicals Market Revenue (Million), by Application 2025 & 2033
- Figure 20: North America Mining Chemicals Market Volume (Million), by Application 2025 & 2033
- Figure 21: North America Mining Chemicals Market Revenue Share (%), by Application 2025 & 2033
- Figure 22: North America Mining Chemicals Market Volume Share (%), by Application 2025 & 2033
- Figure 23: North America Mining Chemicals Market Revenue (Million), by Country 2025 & 2033
- Figure 24: North America Mining Chemicals Market Volume (Million), by Country 2025 & 2033
- Figure 25: North America Mining Chemicals Market Revenue Share (%), by Country 2025 & 2033
- Figure 26: North America Mining Chemicals Market Volume Share (%), by Country 2025 & 2033
- Figure 27: Europe Mining Chemicals Market Revenue (Million), by Function 2025 & 2033
- Figure 28: Europe Mining Chemicals Market Volume (Million), by Function 2025 & 2033
- Figure 29: Europe Mining Chemicals Market Revenue Share (%), by Function 2025 & 2033
- Figure 30: Europe Mining Chemicals Market Volume Share (%), by Function 2025 & 2033
- Figure 31: Europe Mining Chemicals Market Revenue (Million), by Application 2025 & 2033
- Figure 32: Europe Mining Chemicals Market Volume (Million), by Application 2025 & 2033
- Figure 33: Europe Mining Chemicals Market Revenue Share (%), by Application 2025 & 2033
- Figure 34: Europe Mining Chemicals Market Volume Share (%), by Application 2025 & 2033
- Figure 35: Europe Mining Chemicals Market Revenue (Million), by Country 2025 & 2033
- Figure 36: Europe Mining Chemicals Market Volume (Million), by Country 2025 & 2033
- Figure 37: Europe Mining Chemicals Market Revenue Share (%), by Country 2025 & 2033
- Figure 38: Europe Mining Chemicals Market Volume Share (%), by Country 2025 & 2033
- Figure 39: South America Mining Chemicals Market Revenue (Million), by Function 2025 & 2033
- Figure 40: South America Mining Chemicals Market Volume (Million), by Function 2025 & 2033
- Figure 41: South America Mining Chemicals Market Revenue Share (%), by Function 2025 & 2033
- Figure 42: South America Mining Chemicals Market Volume Share (%), by Function 2025 & 2033
- Figure 43: South America Mining Chemicals Market Revenue (Million), by Application 2025 & 2033
- Figure 44: South America Mining Chemicals Market Volume (Million), by Application 2025 & 2033
- Figure 45: South America Mining Chemicals Market Revenue Share (%), by Application 2025 & 2033
- Figure 46: South America Mining Chemicals Market Volume Share (%), by Application 2025 & 2033
- Figure 47: South America Mining Chemicals Market Revenue (Million), by Country 2025 & 2033
- Figure 48: South America Mining Chemicals Market Volume (Million), by Country 2025 & 2033
- Figure 49: South America Mining Chemicals Market Revenue Share (%), by Country 2025 & 2033
- Figure 50: South America Mining Chemicals Market Volume Share (%), by Country 2025 & 2033
- Figure 51: Middle East and Africa Mining Chemicals Market Revenue (Million), by Function 2025 & 2033
- Figure 52: Middle East and Africa Mining Chemicals Market Volume (Million), by Function 2025 & 2033
- Figure 53: Middle East and Africa Mining Chemicals Market Revenue Share (%), by Function 2025 & 2033
- Figure 54: Middle East and Africa Mining Chemicals Market Volume Share (%), by Function 2025 & 2033
- Figure 55: Middle East and Africa Mining Chemicals Market Revenue (Million), by Application 2025 & 2033
- Figure 56: Middle East and Africa Mining Chemicals Market Volume (Million), by Application 2025 & 2033
- Figure 57: Middle East and Africa Mining Chemicals Market Revenue Share (%), by Application 2025 & 2033
- Figure 58: Middle East and Africa Mining Chemicals Market Volume Share (%), by Application 2025 & 2033
- Figure 59: Middle East and Africa Mining Chemicals Market Revenue (Million), by Country 2025 & 2033
- Figure 60: Middle East and Africa Mining Chemicals Market Volume (Million), by Country 2025 & 2033
- Figure 61: Middle East and Africa Mining Chemicals Market Revenue Share (%), by Country 2025 & 2033
- Figure 62: Middle East and Africa Mining Chemicals Market Volume Share (%), by Country 2025 & 2033
List of Tables
- Table 1: Global Mining Chemicals Market Revenue Million Forecast, by Function 2020 & 2033
- Table 2: Global Mining Chemicals Market Volume Million Forecast, by Function 2020 & 2033
- Table 3: Global Mining Chemicals Market Revenue Million Forecast, by Application 2020 & 2033
- Table 4: Global Mining Chemicals Market Volume Million Forecast, by Application 2020 & 2033
- Table 5: Global Mining Chemicals Market Revenue Million Forecast, by Region 2020 & 2033
- Table 6: Global Mining Chemicals Market Volume Million Forecast, by Region 2020 & 2033
- Table 7: Global Mining Chemicals Market Revenue Million Forecast, by Function 2020 & 2033
- Table 8: Global Mining Chemicals Market Volume Million Forecast, by Function 2020 & 2033
- Table 9: Global Mining Chemicals Market Revenue Million Forecast, by Application 2020 & 2033
- Table 10: Global Mining Chemicals Market Volume Million Forecast, by Application 2020 & 2033
- Table 11: Global Mining Chemicals Market Revenue Million Forecast, by Country 2020 & 2033
- Table 12: Global Mining Chemicals Market Volume Million Forecast, by Country 2020 & 2033
- Table 13: China Mining Chemicals Market Revenue (Million) Forecast, by Application 2020 & 2033
- Table 14: China Mining Chemicals Market Volume (Million) Forecast, by Application 2020 & 2033
- Table 15: India Mining Chemicals Market Revenue (Million) Forecast, by Application 2020 & 2033
- Table 16: India Mining Chemicals Market Volume (Million) Forecast, by Application 2020 & 2033
- Table 17: Japan Mining Chemicals Market Revenue (Million) Forecast, by Application 2020 & 2033
- Table 18: Japan Mining Chemicals Market Volume (Million) Forecast, by Application 2020 & 2033
- Table 19: South Korea Mining Chemicals Market Revenue (Million) Forecast, by Application 2020 & 2033
- Table 20: South Korea Mining Chemicals Market Volume (Million) Forecast, by Application 2020 & 2033
- Table 21: Indonesia Mining Chemicals Market Revenue (Million) Forecast, by Application 2020 & 2033
- Table 22: Indonesia Mining Chemicals Market Volume (Million) Forecast, by Application 2020 & 2033
- Table 23: Malaysia Mining Chemicals Market Revenue (Million) Forecast, by Application 2020 & 2033
- Table 24: Malaysia Mining Chemicals Market Volume (Million) Forecast, by Application 2020 & 2033
- Table 25: Australia and New Zealand Mining Chemicals Market Revenue (Million) Forecast, by Application 2020 & 2033
- Table 26: Australia and New Zealand Mining Chemicals Market Volume (Million) Forecast, by Application 2020 & 2033
- Table 27: Rest of Asia Pacific Mining Chemicals Market Revenue (Million) Forecast, by Application 2020 & 2033
- Table 28: Rest of Asia Pacific Mining Chemicals Market Volume (Million) Forecast, by Application 2020 & 2033
- Table 29: Global Mining Chemicals Market Revenue Million Forecast, by Function 2020 & 2033
- Table 30: Global Mining Chemicals Market Volume Million Forecast, by Function 2020 & 2033
- Table 31: Global Mining Chemicals Market Revenue Million Forecast, by Application 2020 & 2033
- Table 32: Global Mining Chemicals Market Volume Million Forecast, by Application 2020 & 2033
- Table 33: Global Mining Chemicals Market Revenue Million Forecast, by Country 2020 & 2033
- Table 34: Global Mining Chemicals Market Volume Million Forecast, by Country 2020 & 2033
- Table 35: United States Mining Chemicals Market Revenue (Million) Forecast, by Application 2020 & 2033
- Table 36: United States Mining Chemicals Market Volume (Million) Forecast, by Application 2020 & 2033
- Table 37: Canada Mining Chemicals Market Revenue (Million) Forecast, by Application 2020 & 2033
- Table 38: Canada Mining Chemicals Market Volume (Million) Forecast, by Application 2020 & 2033
- Table 39: Mexico Mining Chemicals Market Revenue (Million) Forecast, by Application 2020 & 2033
- Table 40: Mexico Mining Chemicals Market Volume (Million) Forecast, by Application 2020 & 2033
- Table 41: Global Mining Chemicals Market Revenue Million Forecast, by Function 2020 & 2033
- Table 42: Global Mining Chemicals Market Volume Million Forecast, by Function 2020 & 2033
- Table 43: Global Mining Chemicals Market Revenue Million Forecast, by Application 2020 & 2033
- Table 44: Global Mining Chemicals Market Volume Million Forecast, by Application 2020 & 2033
- Table 45: Global Mining Chemicals Market Revenue Million Forecast, by Country 2020 & 2033
- Table 46: Global Mining Chemicals Market Volume Million Forecast, by Country 2020 & 2033
- Table 47: Germany Mining Chemicals Market Revenue (Million) Forecast, by Application 2020 & 2033
- Table 48: Germany Mining Chemicals Market Volume (Million) Forecast, by Application 2020 & 2033
- Table 49: United Kingdom Mining Chemicals Market Revenue (Million) Forecast, by Application 2020 & 2033
- Table 50: United Kingdom Mining Chemicals Market Volume (Million) Forecast, by Application 2020 & 2033
- Table 51: France Mining Chemicals Market Revenue (Million) Forecast, by Application 2020 & 2033
- Table 52: France Mining Chemicals Market Volume (Million) Forecast, by Application 2020 & 2033
- Table 53: Italy Mining Chemicals Market Revenue (Million) Forecast, by Application 2020 & 2033
- Table 54: Italy Mining Chemicals Market Volume (Million) Forecast, by Application 2020 & 2033
- Table 55: Russia Mining Chemicals Market Revenue (Million) Forecast, by Application 2020 & 2033
- Table 56: Russia Mining Chemicals Market Volume (Million) Forecast, by Application 2020 & 2033
- Table 57: Rest of Europe Mining Chemicals Market Revenue (Million) Forecast, by Application 2020 & 2033
- Table 58: Rest of Europe Mining Chemicals Market Volume (Million) Forecast, by Application 2020 & 2033
- Table 59: Global Mining Chemicals Market Revenue Million Forecast, by Function 2020 & 2033
- Table 60: Global Mining Chemicals Market Volume Million Forecast, by Function 2020 & 2033
- Table 61: Global Mining Chemicals Market Revenue Million Forecast, by Application 2020 & 2033
- Table 62: Global Mining Chemicals Market Volume Million Forecast, by Application 2020 & 2033
- Table 63: Global Mining Chemicals Market Revenue Million Forecast, by Country 2020 & 2033
- Table 64: Global Mining Chemicals Market Volume Million Forecast, by Country 2020 & 2033
- Table 65: Brazil Mining Chemicals Market Revenue (Million) Forecast, by Application 2020 & 2033
- Table 66: Brazil Mining Chemicals Market Volume (Million) Forecast, by Application 2020 & 2033
- Table 67: Argentina Mining Chemicals Market Revenue (Million) Forecast, by Application 2020 & 2033
- Table 68: Argentina Mining Chemicals Market Volume (Million) Forecast, by Application 2020 & 2033
- Table 69: Rest of South America Mining Chemicals Market Revenue (Million) Forecast, by Application 2020 & 2033
- Table 70: Rest of South America Mining Chemicals Market Volume (Million) Forecast, by Application 2020 & 2033
- Table 71: Global Mining Chemicals Market Revenue Million Forecast, by Function 2020 & 2033
- Table 72: Global Mining Chemicals Market Volume Million Forecast, by Function 2020 & 2033
- Table 73: Global Mining Chemicals Market Revenue Million Forecast, by Application 2020 & 2033
- Table 74: Global Mining Chemicals Market Volume Million Forecast, by Application 2020 & 2033
- Table 75: Global Mining Chemicals Market Revenue Million Forecast, by Country 2020 & 2033
- Table 76: Global Mining Chemicals Market Volume Million Forecast, by Country 2020 & 2033
- Table 77: Nigeria Mining Chemicals Market Revenue (Million) Forecast, by Application 2020 & 2033
- Table 78: Nigeria Mining Chemicals Market Volume (Million) Forecast, by Application 2020 & 2033
- Table 79: South Africa Mining Chemicals Market Revenue (Million) Forecast, by Application 2020 & 2033
- Table 80: South Africa Mining Chemicals Market Volume (Million) Forecast, by Application 2020 & 2033
- Table 81: Tanzania Mining Chemicals Market Revenue (Million) Forecast, by Application 2020 & 2033
- Table 82: Tanzania Mining Chemicals Market Volume (Million) Forecast, by Application 2020 & 2033
- Table 83: Rest of Middle East and Africa Mining Chemicals Market Revenue (Million) Forecast, by Application 2020 & 2033
- Table 84: Rest of Middle East and Africa Mining Chemicals Market Volume (Million) Forecast, by Application 2020 & 2033
Frequently Asked Questions
1. What is the projected Compound Annual Growth Rate (CAGR) of the Mining Chemicals Market?
The projected CAGR is approximately 4.26%.
2. Which companies are prominent players in the Mining Chemicals Market?
Key companies in the market include Arkema, Solvay*List Not Exhaustive, Ecolab, Chevron Phillips Chemical Company LLC, NASACO, Qingdao Ruchang Mining Industry Co Ltd, 3M, BASF SE, FMC Corporation, AECI, Kemira, Sasol Limited, Betachem (Pty) Ltd, Indorama Ventures Public Limited, CLARIANT, CTC (Tennant Consolidated Group), Orica Limited, SNF Group.
3. What are the main segments of the Mining Chemicals Market?
The market segments include Function, Application.
4. Can you provide details about the market size?
The market size is estimated to be USD XX Million as of 2022.
5. What are some drivers contributing to market growth?
Increasing Mining Activities in Asia-Pacific and North America; Rising Demand for Minerals Across Different End-use Industries.
6. What are the notable trends driving market growth?
Increasing Use of Mining Chemicals in Mineral Processing.
7. Are there any restraints impacting market growth?
Stringent Government Regulations Related to Mining Industry and Hazardous Mining Chemicals.
8. Can you provide examples of recent developments in the market?
February 2024: Orica Limited announced the acquisition of Cyanco, a US-based company primarily serving the gold mining industries. Through the acquisition, the company plans to strengthen its mining chemicals business.
9. What pricing options are available for accessing the report?
Pricing options include single-user, multi-user, and enterprise licenses priced at USD 4750, USD 5250, and USD 8750 respectively.
10. Is the market size provided in terms of value or volume?
The market size is provided in terms of value, measured in Million and volume, measured in Million.
11. Are there any specific market keywords associated with the report?
Yes, the market keyword associated with the report is "Mining Chemicals Market," which aids in identifying and referencing the specific market segment covered.
12. How do I determine which pricing option suits my needs best?
The pricing options vary based on user requirements and access needs. Individual users may opt for single-user licenses, while businesses requiring broader access may choose multi-user or enterprise licenses for cost-effective access to the report.
13. Are there any additional resources or data provided in the Mining Chemicals Market report?
While the report offers comprehensive insights, it's advisable to review the specific contents or supplementary materials provided to ascertain if additional resources or data are available.
14. How can I stay updated on further developments or reports in the Mining Chemicals Market?
To stay informed about further developments, trends, and reports in the Mining Chemicals Market, consider subscribing to industry newsletters, following relevant companies and organizations, or regularly checking reputable industry news sources and publications.
Methodology
Step 1 - Identification of Relevant Samples Size from Population Database


Step 2 - Approaches for Defining Global Market Size (Value, Volume* & Price*)

Note*: In applicable scenarios
Step 3 - Data Sources
Primary Research
- Web Analytics
- Survey Reports
- Research Institute
- Latest Research Reports
- Opinion Leaders
Secondary Research
- Annual Reports
- White Paper
- Latest Press Release
- Industry Association
- Paid Database
- Investor Presentations

Step 4 - Data Triangulation
Involves using different sources of information in order to increase the validity of a study
These sources are likely to be stakeholders in a program - participants, other researchers, program staff, other community members, and so on.
Then we put all data in single framework & apply various statistical tools to find out the dynamic on the market.
During the analysis stage, feedback from the stakeholder groups would be compared to determine areas of agreement as well as areas of divergence