Microgreens Market Trends and Opportunities for Growth

Microgreens Market by Production Analysis, by Consumption Analysis, by Import Market Analysis (Value & Volume), by Export Market Analysis (Value & Volume), by Price Trend Analysis, by North America (United States, Canada, Mexico), by South America (Brazil, Argentina, Rest of South America), by Europe (United Kingdom, Germany, France, Italy, Spain, Russia, Benelux, Nordics, Rest of Europe), by Middle East & Africa (Turkey, Israel, GCC, North Africa, South Africa, Rest of Middle East & Africa), by Asia Pacific (China, India, Japan, South Korea, ASEAN, Oceania, Rest of Asia Pacific) Forecast 2025-2033

Jun 26 2025
Base Year: 2024

234 Pages
Main Logo

Microgreens Market Trends and Opportunities for Growth


Home
Industries
Agriculture
sponsor image

Tailored for you

  • In-depth Analysis Tailored to Specified Regions or Segments
  • Company Profiles Customized to User Preferences
  • Comprehensive Insights Focused on Specific Segments or Regions
  • Customized Evaluation of Competitive Landscape to Meet Your Needs
  • Tailored Customization to Address Other Specific Requirements
Ask for customization


Key Insights

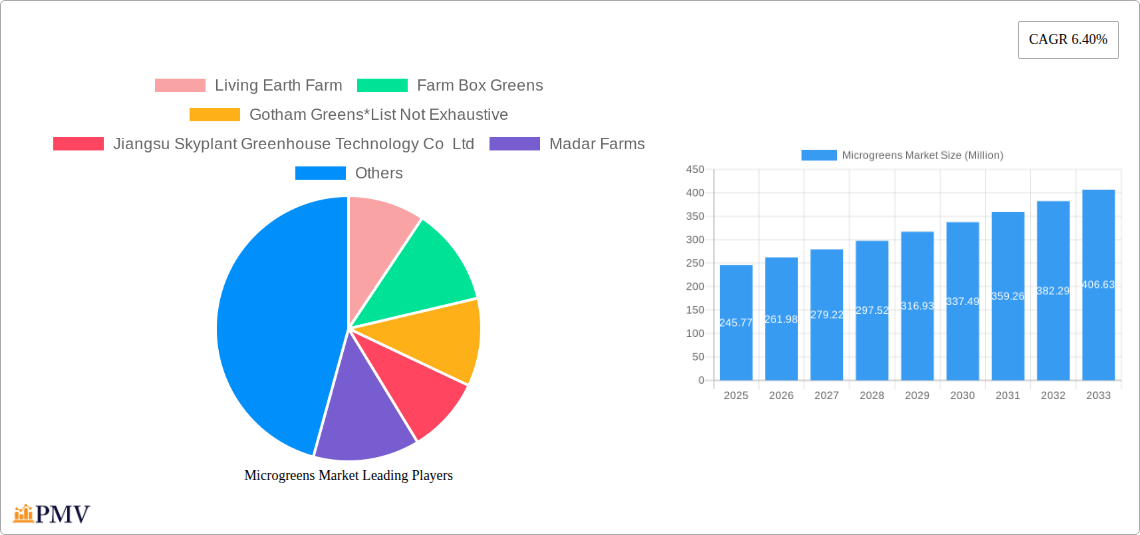
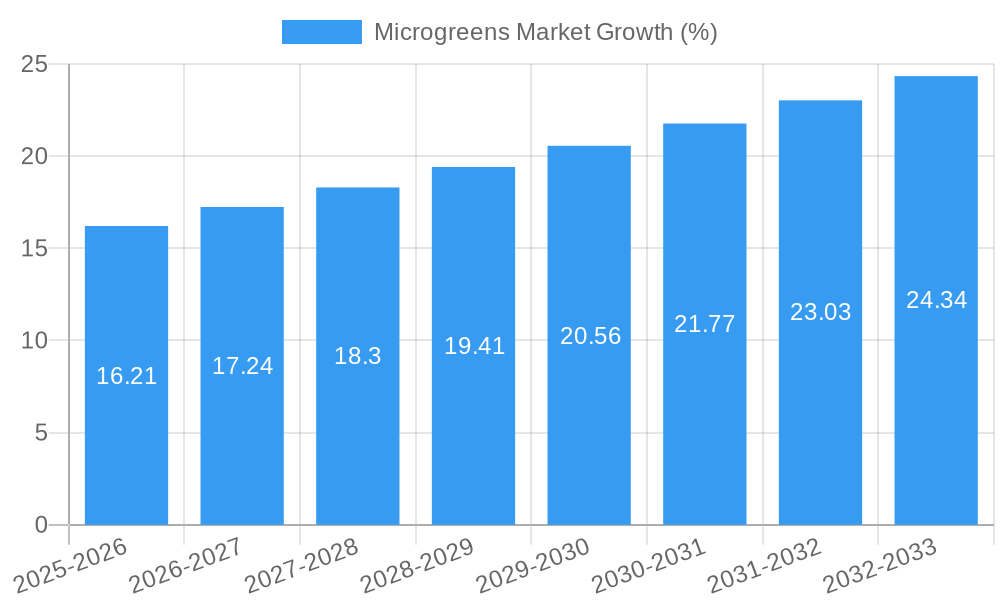
The global microgreens market, valued at $245.77 million in 2025, is projected to experience robust growth, driven by a Compound Annual Growth Rate (CAGR) of 6.40% from 2025 to 2033. This expansion is fueled by several key factors. The increasing consumer demand for nutritious and healthy food options is a primary driver, with microgreens offering a concentrated source of vitamins and minerals. The rising popularity of plant-based diets and the growing awareness of the health benefits associated with consuming microgreens are further bolstering market growth. Furthermore, the expansion of the food service industry, particularly restaurants and cafes incorporating microgreens into their menus, significantly contributes to market expansion. The diverse range of microgreen types, including broccoli, lettuce, and basil, caters to varied consumer preferences, adding to market dynamism. Advancements in farming techniques, such as indoor and vertical farming, are improving production efficiency and yield, making microgreens more accessible and affordable. These innovative farming methods also address concerns surrounding sustainability and environmental impact.

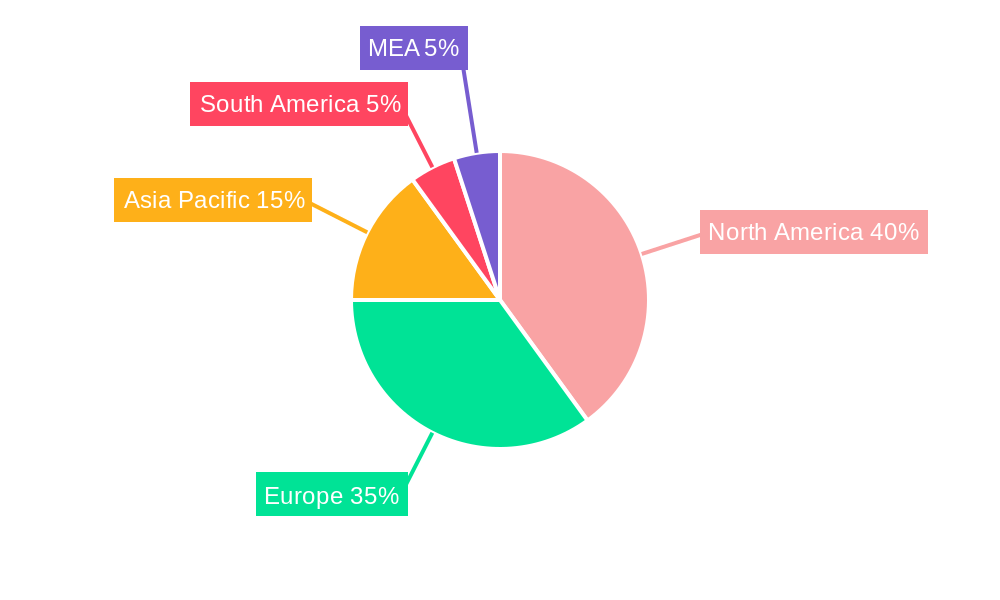
However, the market faces certain challenges. Fluctuations in raw material costs and climate change affecting crop yields could impact production and pricing. Maintaining consistent quality and ensuring food safety are also crucial aspects that producers must address to maintain consumer trust. Despite these constraints, the long-term outlook for the microgreens market remains positive, driven by ongoing innovation, increasing consumer awareness of health benefits, and the expanding reach of distribution channels. The market segmentation reveals significant potential across various distribution channels (hypermarkets, restaurants, etc.), farming methods (indoor, vertical, greenhouse), and growth mediums (peat moss, soil, etc.), providing opportunities for targeted market strategies. North America and Europe currently hold a significant market share, but the Asia-Pacific region is expected to witness substantial growth in the coming years due to increasing disposable incomes and changing dietary preferences.

Microgreens Market Research Report - Market Size, Growth & Forecast

Microgreens Market: A Comprehensive Report (2019-2033)

This comprehensive report provides an in-depth analysis of the global microgreens market, offering invaluable insights for industry stakeholders, investors, and strategic decision-makers. With a study period spanning 2019-2033, a base year of 2025, and a forecast period of 2025-2033, this report leverages extensive market research to deliver actionable intelligence on market size, growth drivers, competitive landscape, and future trends. The report covers key segments including distribution channels, microgreen types, farming methods, and growth mediums, providing a holistic understanding of this dynamic market poised for significant growth. The total market value is projected to reach xx Million by 2033.

Microgreens Market Structure & Competitive Dynamics

The microgreens market exhibits a moderately fragmented structure, with a mix of large multinational corporations and smaller, specialized producers. Market concentration is relatively low, with no single dominant player controlling a significant market share. However, key players like AeroFarms LLC and Goodleaf Farms are actively expanding their market presence through strategic partnerships and technological advancements. Innovation is a key driver, with companies continuously exploring new farming techniques, packaging solutions, and product varieties to meet evolving consumer demands. Regulatory frameworks, while generally favorable, vary across regions, impacting production and distribution. Product substitutes, such as sprouts and other leafy greens, pose a competitive challenge, though microgreens' unique nutritional profile and flavor profile provide a distinct advantage. The market has witnessed several mergers and acquisitions (M&A) activities in recent years, although the exact deal values remain largely undisclosed. These M&A activities often aim to enhance production capacity, expand distribution networks, or acquire specialized technologies.

  • Market Share: AeroFarms LLC holds an estimated xx% market share, followed by Goodleaf Farms with approximately xx%. The remaining share is dispersed among numerous smaller players.
  • M&A Activity: While precise figures are unavailable, several significant M&A deals involving smaller microgreen producers have been observed in the historical period, valued in the range of xx Million to xx Million.

Microgreens Market Industry Trends & Insights

The global microgreens market is experiencing robust growth, driven by several key factors. The increasing consumer awareness of health and wellness is a major catalyst, with microgreens' high nutritional density and rich flavor profile appealing to health-conscious individuals. Technological advancements in vertical farming and indoor agriculture are significantly boosting production efficiency and yields, reducing reliance on traditional land-based farming. The rise of plant-based diets and the growing demand for fresh, locally sourced produce further fuel market expansion. Consumer preferences are shifting towards convenient, ready-to-eat products, leading to increased demand for pre-packaged microgreens. However, the market also faces challenges, including relatively high production costs, shorter shelf life compared to conventional greens, and potential supply chain disruptions. The Compound Annual Growth Rate (CAGR) for the microgreens market is projected to be xx% during the forecast period (2025-2033). Market penetration remains relatively low in many regions, suggesting significant untapped potential.

Microgreens Market Growth

Dominant Markets & Segments in Microgreens Market

The North American market currently dominates the global microgreens market, driven by high consumer demand, robust infrastructure, and a thriving startup ecosystem. Within North America, the United States holds the largest share, followed by Canada. The European market is also experiencing significant growth.

  • Distribution Channel: Hypermarkets/supermarkets represent the largest distribution channel, accounting for approximately xx% of market revenue, driven by the increasing availability of microgreens in mainstream grocery stores. Restaurants represent a significant secondary channel, utilizing microgreens as a high-value ingredient in gourmet dishes.
  • Type: Broccoli, lettuce and chicory are the most popular types, collectively accounting for around xx% of the market due to their widespread acceptance and ease of cultivation. Arugula and basil follow as popular choices, driven by their distinct flavors and versatility.
  • Farming: Indoor farming and vertical farming are rapidly gaining popularity due to their higher yields, improved control over environmental factors, and reduced reliance on land and water resources.
  • Growth Medium: Peat moss and soil remain the dominant growth mediums, although the use of coconut coir and tissue paper is increasing due to their sustainability credentials.

Key Drivers: North America's dominance is fueled by high disposable incomes, strong consumer interest in healthy foods, and well-established distribution networks. Europe benefits from a growing awareness of sustainable food production and a preference for locally sourced produce. Key drivers include favorable economic policies promoting sustainable agriculture, sophisticated infrastructure supporting food distribution, and consumer preference for organic and sustainably grown produce.

Microgreens Market Product Innovations

Recent innovations in the microgreens market focus on enhancing shelf life through improved packaging, developing unique flavor profiles through hybrid varieties, and optimizing production processes through automation and data analytics. This includes the use of advanced hydroponic and aeroponic systems to enhance yields and reduce resource consumption. These innovations align with increasing consumer demand for convenient, flavorful, and sustainably produced microgreens, driving competitive advantages for companies that successfully integrate these technologies.

Report Segmentation & Scope

This report segments the microgreens market across several key parameters:

  • Distribution Channel: Hypermarkets/Supermarkets (xx Million, xx% CAGR), Restaurants (xx Million, xx% CAGR), Other Distribution Channels (xx Million, xx% CAGR). Competition is intense in the supermarket channel, while restaurants offer a niche market with higher price points.
  • Type: Broccoli, Lettuce & Chicory (xx Million, xx% CAGR), Arugula (xx Million, xx% CAGR), Basil (xx Million, xx% CAGR), Fennel (xx Million, xx% CAGR), Carrots (xx Million, xx% CAGR), Sunflower (xx Million, xx% CAGR), Radish (xx Million, xx% CAGR), Peas (xx Million, xx% CAGR), Other Types (xx Million, xx% CAGR). Market dynamics vary across types, with some exhibiting faster growth than others.
  • Farming: Indoor Farming (xx Million, xx% CAGR), Vertical Farming (xx Million, xx% CAGR), Commercial Greenhouses (xx Million, xx% CAGR), Other Farming (xx Million, xx% CAGR). Technological advancements are driving significant growth in indoor and vertical farming.
  • Growth Medium: Peat Moss (xx Million, xx% CAGR), Soil (xx Million, xx% CAGR), Coconut Coir (xx Million, xx% CAGR), Tissue Paper (xx Million, xx% CAGR), Other Growth Mediums (xx Million, xx% CAGR). The use of sustainable growth mediums is gaining traction.

Key Drivers of Microgreens Market Growth

The microgreens market is propelled by a confluence of factors: increasing consumer awareness of health benefits, rising demand for fresh and nutritious foods, technological advancements in controlled-environment agriculture (CEA), and growing adoption of plant-based diets. Government initiatives promoting sustainable agriculture also contribute to market growth. The convenience factor, with pre-packaged microgreens readily available in supermarkets, further accelerates market penetration.

Challenges in the Microgreens Market Sector

The microgreens market faces challenges including the relatively high production costs compared to conventional leafy greens, shorter shelf life requiring efficient cold chain management, and the potential for supply chain disruptions. Competition from substitute products and the need for specialized knowledge and technology in controlled environment agriculture also pose barriers to entry for new market participants. These challenges result in a xx% reduction in overall market potential annually.

Leading Players in the Microgreens Market Market

  • Living Earth Farm
  • Farm Box Greens
  • Gotham Greens
  • Jiangsu Skyplant Greenhouse Technology Co Ltd
  • Madar Farms
  • Chef's Garden Inc
  • Shanghai Dehuan Industry Co Ltd
  • Metro Microgreens
  • Goodleaf Farms
  • AeroFarms LLC

Key Developments in Microgreens Market Sector

  • August 2022: AeroFarms expands retail presence to 160 Fresh Market stores across 22 states.
  • February 2023: Good Leaf Farm partners with Unfold to introduce premium vertically farmed greens.
  • May 2023: AeroFarms launches nationwide expansion through collaboration with Amazon Fresh.

Strategic Microgreens Market Outlook

The future of the microgreens market is bright, with continued growth driven by technological innovation, shifting consumer preferences, and increasing awareness of the health benefits of microgreens. Strategic opportunities exist in developing sustainable farming practices, exploring new microgreen varieties, and enhancing distribution networks to reach wider consumer bases. The market is expected to witness significant expansion in emerging economies, presenting lucrative opportunities for businesses that can navigate the challenges and leverage the growth drivers identified in this report.

Microgreens Market Segmentation

  • 1. Production Analysis
  • 2. Consumption Analysis
  • 3. Import Market Analysis (Value & Volume)
  • 4. Export Market Analysis (Value & Volume)
  • 5. Price Trend Analysis

Microgreens Market Segmentation By Geography

  • 1. North America
    • 1.1. United States
    • 1.2. Canada
    • 1.3. Mexico
  • 2. South America
    • 2.1. Brazil
    • 2.2. Argentina
    • 2.3. Rest of South America
  • 3. Europe
    • 3.1. United Kingdom
    • 3.2. Germany
    • 3.3. France
    • 3.4. Italy
    • 3.5. Spain
    • 3.6. Russia
    • 3.7. Benelux
    • 3.8. Nordics
    • 3.9. Rest of Europe
  • 4. Middle East & Africa
    • 4.1. Turkey
    • 4.2. Israel
    • 4.3. GCC
    • 4.4. North Africa
    • 4.5. South Africa
    • 4.6. Rest of Middle East & Africa
  • 5. Asia Pacific
    • 5.1. China
    • 5.2. India
    • 5.3. Japan
    • 5.4. South Korea
    • 5.5. ASEAN
    • 5.6. Oceania
    • 5.7. Rest of Asia Pacific
Microgreens Market Regional Share


Microgreens Market REPORT HIGHLIGHTS

AspectsDetails
Study Period 2019-2033
Base Year 2024
Estimated Year 2025
Forecast Period2025-2033
Historical Period2019-2024
Growth RateCAGR of 6.40% from 2019-2033
Segmentation
    • By Production Analysis
    • By Consumption Analysis
    • By Import Market Analysis (Value & Volume)
    • By Export Market Analysis (Value & Volume)
    • By Price Trend Analysis
  • By Geography
    • North America
      • United States
      • Canada
      • Mexico
    • South America
      • Brazil
      • Argentina
      • Rest of South America
    • Europe
      • United Kingdom
      • Germany
      • France
      • Italy
      • Spain
      • Russia
      • Benelux
      • Nordics
      • Rest of Europe
    • Middle East & Africa
      • Turkey
      • Israel
      • GCC
      • North Africa
      • South Africa
      • Rest of Middle East & Africa
    • Asia Pacific
      • China
      • India
      • Japan
      • South Korea
      • ASEAN
      • Oceania
      • Rest of Asia Pacific


Table of Contents

  1. 1. Introduction
    • 1.1. Research Scope
    • 1.2. Market Segmentation
    • 1.3. Research Methodology
    • 1.4. Definitions and Assumptions
  2. 2. Executive Summary
    • 2.1. Introduction
  3. 3. Market Dynamics
    • 3.1. Introduction
      • 3.2. Market Drivers
        • 3.2.1. Seed Treatment As A Solution To Enhance Yield; Growing Awareness For Seed Treatment Among The Farmers; Rising Trend Of Organic Farming
      • 3.3. Market Restrains
        • 3.3.1. Limitations Across Farm-Level Seed Treatment; Rising Environmental Concerns
      • 3.4. Market Trends
        • 3.4.1. Rise in Adoption of Indoor Farming
  4. 4. Market Factor Analysis
    • 4.1. Porters Five Forces
    • 4.2. Supply/Value Chain
    • 4.3. PESTEL analysis
    • 4.4. Market Entropy
    • 4.5. Patent/Trademark Analysis
  5. 5. Global Microgreens Market Analysis, Insights and Forecast, 2019-2031
    • 5.1. Market Analysis, Insights and Forecast - by Production Analysis
      • 5.2. Market Analysis, Insights and Forecast - by Consumption Analysis
        • 5.3. Market Analysis, Insights and Forecast - by Import Market Analysis (Value & Volume)
          • 5.4. Market Analysis, Insights and Forecast - by Export Market Analysis (Value & Volume)
            • 5.5. Market Analysis, Insights and Forecast - by Price Trend Analysis
              • 5.6. Market Analysis, Insights and Forecast - by Region
                • 5.6.1. North America
                • 5.6.2. South America
                • 5.6.3. Europe
                • 5.6.4. Middle East & Africa
                • 5.6.5. Asia Pacific
            • 6. North America Microgreens Market Analysis, Insights and Forecast, 2019-2031
              • 6.1. Market Analysis, Insights and Forecast - by Production Analysis
                • 6.2. Market Analysis, Insights and Forecast - by Consumption Analysis
                  • 6.3. Market Analysis, Insights and Forecast - by Import Market Analysis (Value & Volume)
                    • 6.4. Market Analysis, Insights and Forecast - by Export Market Analysis (Value & Volume)
                      • 6.5. Market Analysis, Insights and Forecast - by Price Trend Analysis
                      • 7. South America Microgreens Market Analysis, Insights and Forecast, 2019-2031
                        • 7.1. Market Analysis, Insights and Forecast - by Production Analysis
                          • 7.2. Market Analysis, Insights and Forecast - by Consumption Analysis
                            • 7.3. Market Analysis, Insights and Forecast - by Import Market Analysis (Value & Volume)
                              • 7.4. Market Analysis, Insights and Forecast - by Export Market Analysis (Value & Volume)
                                • 7.5. Market Analysis, Insights and Forecast - by Price Trend Analysis
                                • 8. Europe Microgreens Market Analysis, Insights and Forecast, 2019-2031
                                  • 8.1. Market Analysis, Insights and Forecast - by Production Analysis
                                    • 8.2. Market Analysis, Insights and Forecast - by Consumption Analysis
                                      • 8.3. Market Analysis, Insights and Forecast - by Import Market Analysis (Value & Volume)
                                        • 8.4. Market Analysis, Insights and Forecast - by Export Market Analysis (Value & Volume)
                                          • 8.5. Market Analysis, Insights and Forecast - by Price Trend Analysis
                                          • 9. Middle East & Africa Microgreens Market Analysis, Insights and Forecast, 2019-2031
                                            • 9.1. Market Analysis, Insights and Forecast - by Production Analysis
                                              • 9.2. Market Analysis, Insights and Forecast - by Consumption Analysis
                                                • 9.3. Market Analysis, Insights and Forecast - by Import Market Analysis (Value & Volume)
                                                  • 9.4. Market Analysis, Insights and Forecast - by Export Market Analysis (Value & Volume)
                                                    • 9.5. Market Analysis, Insights and Forecast - by Price Trend Analysis
                                                    • 10. Asia Pacific Microgreens Market Analysis, Insights and Forecast, 2019-2031
                                                      • 10.1. Market Analysis, Insights and Forecast - by Production Analysis
                                                        • 10.2. Market Analysis, Insights and Forecast - by Consumption Analysis
                                                          • 10.3. Market Analysis, Insights and Forecast - by Import Market Analysis (Value & Volume)
                                                            • 10.4. Market Analysis, Insights and Forecast - by Export Market Analysis (Value & Volume)
                                                              • 10.5. Market Analysis, Insights and Forecast - by Price Trend Analysis
                                                              • 11. North America Microgreens Market Analysis, Insights and Forecast, 2019-2031
                                                                  • 11.1. Market Analysis, Insights and Forecast - By Country/Sub-region
                                                                    • 11.1.1 United States
                                                                    • 11.1.2 Canada
                                                                    • 11.1.3 Mexico
                                                              • 12. Europe Microgreens Market Analysis, Insights and Forecast, 2019-2031
                                                                  • 12.1. Market Analysis, Insights and Forecast - By Country/Sub-region
                                                                    • 12.1.1 Germany
                                                                    • 12.1.2 United Kingdom
                                                                    • 12.1.3 France
                                                                    • 12.1.4 Spain
                                                                    • 12.1.5 Italy
                                                                    • 12.1.6 Spain
                                                                    • 12.1.7 Belgium
                                                                    • 12.1.8 Netherland
                                                                    • 12.1.9 Nordics
                                                                    • 12.1.10 Rest of Europe
                                                              • 13. Asia Pacific Microgreens Market Analysis, Insights and Forecast, 2019-2031
                                                                  • 13.1. Market Analysis, Insights and Forecast - By Country/Sub-region
                                                                    • 13.1.1 China
                                                                    • 13.1.2 Japan
                                                                    • 13.1.3 India
                                                                    • 13.1.4 South Korea
                                                                    • 13.1.5 Southeast Asia
                                                                    • 13.1.6 Australia
                                                                    • 13.1.7 Indonesia
                                                                    • 13.1.8 Phillipes
                                                                    • 13.1.9 Singapore
                                                                    • 13.1.10 Thailandc
                                                                    • 13.1.11 Rest of Asia Pacific
                                                              • 14. South America Microgreens Market Analysis, Insights and Forecast, 2019-2031
                                                                  • 14.1. Market Analysis, Insights and Forecast - By Country/Sub-region
                                                                    • 14.1.1 Brazil
                                                                    • 14.1.2 Argentina
                                                                    • 14.1.3 Peru
                                                                    • 14.1.4 Chile
                                                                    • 14.1.5 Colombia
                                                                    • 14.1.6 Ecuador
                                                                    • 14.1.7 Venezuela
                                                                    • 14.1.8 Rest of South America
                                                              • 15. North America Microgreens Market Analysis, Insights and Forecast, 2019-2031
                                                                  • 15.1. Market Analysis, Insights and Forecast - By Country/Sub-region
                                                                    • 15.1.1 United States
                                                                    • 15.1.2 Canada
                                                                    • 15.1.3 Mexico
                                                              • 16. MEA Microgreens Market Analysis, Insights and Forecast, 2019-2031
                                                                  • 16.1. Market Analysis, Insights and Forecast - By Country/Sub-region
                                                                    • 16.1.1 United Arab Emirates
                                                                    • 16.1.2 Saudi Arabia
                                                                    • 16.1.3 South Africa
                                                                    • 16.1.4 Rest of Middle East and Africa
                                                              • 17. Competitive Analysis
                                                                • 17.1. Global Market Share Analysis 2024
                                                                  • 17.2. Company Profiles
                                                                    • 17.2.1 Living Earth Farm
                                                                      • 17.2.1.1. Overview
                                                                      • 17.2.1.2. Products
                                                                      • 17.2.1.3. SWOT Analysis
                                                                      • 17.2.1.4. Recent Developments
                                                                      • 17.2.1.5. Financials (Based on Availability)
                                                                    • 17.2.2 Farm Box Greens
                                                                      • 17.2.2.1. Overview
                                                                      • 17.2.2.2. Products
                                                                      • 17.2.2.3. SWOT Analysis
                                                                      • 17.2.2.4. Recent Developments
                                                                      • 17.2.2.5. Financials (Based on Availability)
                                                                    • 17.2.3 Gotham Greens*List Not Exhaustive
                                                                      • 17.2.3.1. Overview
                                                                      • 17.2.3.2. Products
                                                                      • 17.2.3.3. SWOT Analysis
                                                                      • 17.2.3.4. Recent Developments
                                                                      • 17.2.3.5. Financials (Based on Availability)
                                                                    • 17.2.4 Jiangsu Skyplant Greenhouse Technology Co Ltd
                                                                      • 17.2.4.1. Overview
                                                                      • 17.2.4.2. Products
                                                                      • 17.2.4.3. SWOT Analysis
                                                                      • 17.2.4.4. Recent Developments
                                                                      • 17.2.4.5. Financials (Based on Availability)
                                                                    • 17.2.5 Madar Farms
                                                                      • 17.2.5.1. Overview
                                                                      • 17.2.5.2. Products
                                                                      • 17.2.5.3. SWOT Analysis
                                                                      • 17.2.5.4. Recent Developments
                                                                      • 17.2.5.5. Financials (Based on Availability)
                                                                    • 17.2.6 Chef's Garden Inc
                                                                      • 17.2.6.1. Overview
                                                                      • 17.2.6.2. Products
                                                                      • 17.2.6.3. SWOT Analysis
                                                                      • 17.2.6.4. Recent Developments
                                                                      • 17.2.6.5. Financials (Based on Availability)
                                                                    • 17.2.7 Shanghai Dehuan Industry Co Ltd
                                                                      • 17.2.7.1. Overview
                                                                      • 17.2.7.2. Products
                                                                      • 17.2.7.3. SWOT Analysis
                                                                      • 17.2.7.4. Recent Developments
                                                                      • 17.2.7.5. Financials (Based on Availability)
                                                                    • 17.2.8 Metro Microgreens
                                                                      • 17.2.8.1. Overview
                                                                      • 17.2.8.2. Products
                                                                      • 17.2.8.3. SWOT Analysis
                                                                      • 17.2.8.4. Recent Developments
                                                                      • 17.2.8.5. Financials (Based on Availability)
                                                                    • 17.2.9 Goodleaf Farms
                                                                      • 17.2.9.1. Overview
                                                                      • 17.2.9.2. Products
                                                                      • 17.2.9.3. SWOT Analysis
                                                                      • 17.2.9.4. Recent Developments
                                                                      • 17.2.9.5. Financials (Based on Availability)
                                                                    • 17.2.10 AeroFarms LLC
                                                                      • 17.2.10.1. Overview
                                                                      • 17.2.10.2. Products
                                                                      • 17.2.10.3. SWOT Analysis
                                                                      • 17.2.10.4. Recent Developments
                                                                      • 17.2.10.5. Financials (Based on Availability)

                                                              List of Figures

                                                              1. Figure 1: Global Microgreens Market Revenue Breakdown (Million, %) by Region 2024 & 2032
                                                              2. Figure 2: North America Microgreens Market Revenue (Million), by Country 2024 & 2032
                                                              3. Figure 3: North America Microgreens Market Revenue Share (%), by Country 2024 & 2032
                                                              4. Figure 4: Europe Microgreens Market Revenue (Million), by Country 2024 & 2032
                                                              5. Figure 5: Europe Microgreens Market Revenue Share (%), by Country 2024 & 2032
                                                              6. Figure 6: Asia Pacific Microgreens Market Revenue (Million), by Country 2024 & 2032
                                                              7. Figure 7: Asia Pacific Microgreens Market Revenue Share (%), by Country 2024 & 2032
                                                              8. Figure 8: South America Microgreens Market Revenue (Million), by Country 2024 & 2032
                                                              9. Figure 9: South America Microgreens Market Revenue Share (%), by Country 2024 & 2032
                                                              10. Figure 10: North America Microgreens Market Revenue (Million), by Country 2024 & 2032
                                                              11. Figure 11: North America Microgreens Market Revenue Share (%), by Country 2024 & 2032
                                                              12. Figure 12: MEA Microgreens Market Revenue (Million), by Country 2024 & 2032
                                                              13. Figure 13: MEA Microgreens Market Revenue Share (%), by Country 2024 & 2032
                                                              14. Figure 14: North America Microgreens Market Revenue (Million), by Production Analysis 2024 & 2032
                                                              15. Figure 15: North America Microgreens Market Revenue Share (%), by Production Analysis 2024 & 2032
                                                              16. Figure 16: North America Microgreens Market Revenue (Million), by Consumption Analysis 2024 & 2032
                                                              17. Figure 17: North America Microgreens Market Revenue Share (%), by Consumption Analysis 2024 & 2032
                                                              18. Figure 18: North America Microgreens Market Revenue (Million), by Import Market Analysis (Value & Volume) 2024 & 2032
                                                              19. Figure 19: North America Microgreens Market Revenue Share (%), by Import Market Analysis (Value & Volume) 2024 & 2032
                                                              20. Figure 20: North America Microgreens Market Revenue (Million), by Export Market Analysis (Value & Volume) 2024 & 2032
                                                              21. Figure 21: North America Microgreens Market Revenue Share (%), by Export Market Analysis (Value & Volume) 2024 & 2032
                                                              22. Figure 22: North America Microgreens Market Revenue (Million), by Price Trend Analysis 2024 & 2032
                                                              23. Figure 23: North America Microgreens Market Revenue Share (%), by Price Trend Analysis 2024 & 2032
                                                              24. Figure 24: North America Microgreens Market Revenue (Million), by Country 2024 & 2032
                                                              25. Figure 25: North America Microgreens Market Revenue Share (%), by Country 2024 & 2032
                                                              26. Figure 26: South America Microgreens Market Revenue (Million), by Production Analysis 2024 & 2032
                                                              27. Figure 27: South America Microgreens Market Revenue Share (%), by Production Analysis 2024 & 2032
                                                              28. Figure 28: South America Microgreens Market Revenue (Million), by Consumption Analysis 2024 & 2032
                                                              29. Figure 29: South America Microgreens Market Revenue Share (%), by Consumption Analysis 2024 & 2032
                                                              30. Figure 30: South America Microgreens Market Revenue (Million), by Import Market Analysis (Value & Volume) 2024 & 2032
                                                              31. Figure 31: South America Microgreens Market Revenue Share (%), by Import Market Analysis (Value & Volume) 2024 & 2032
                                                              32. Figure 32: South America Microgreens Market Revenue (Million), by Export Market Analysis (Value & Volume) 2024 & 2032
                                                              33. Figure 33: South America Microgreens Market Revenue Share (%), by Export Market Analysis (Value & Volume) 2024 & 2032
                                                              34. Figure 34: South America Microgreens Market Revenue (Million), by Price Trend Analysis 2024 & 2032
                                                              35. Figure 35: South America Microgreens Market Revenue Share (%), by Price Trend Analysis 2024 & 2032
                                                              36. Figure 36: South America Microgreens Market Revenue (Million), by Country 2024 & 2032
                                                              37. Figure 37: South America Microgreens Market Revenue Share (%), by Country 2024 & 2032
                                                              38. Figure 38: Europe Microgreens Market Revenue (Million), by Production Analysis 2024 & 2032
                                                              39. Figure 39: Europe Microgreens Market Revenue Share (%), by Production Analysis 2024 & 2032
                                                              40. Figure 40: Europe Microgreens Market Revenue (Million), by Consumption Analysis 2024 & 2032
                                                              41. Figure 41: Europe Microgreens Market Revenue Share (%), by Consumption Analysis 2024 & 2032
                                                              42. Figure 42: Europe Microgreens Market Revenue (Million), by Import Market Analysis (Value & Volume) 2024 & 2032
                                                              43. Figure 43: Europe Microgreens Market Revenue Share (%), by Import Market Analysis (Value & Volume) 2024 & 2032
                                                              44. Figure 44: Europe Microgreens Market Revenue (Million), by Export Market Analysis (Value & Volume) 2024 & 2032
                                                              45. Figure 45: Europe Microgreens Market Revenue Share (%), by Export Market Analysis (Value & Volume) 2024 & 2032
                                                              46. Figure 46: Europe Microgreens Market Revenue (Million), by Price Trend Analysis 2024 & 2032
                                                              47. Figure 47: Europe Microgreens Market Revenue Share (%), by Price Trend Analysis 2024 & 2032
                                                              48. Figure 48: Europe Microgreens Market Revenue (Million), by Country 2024 & 2032
                                                              49. Figure 49: Europe Microgreens Market Revenue Share (%), by Country 2024 & 2032
                                                              50. Figure 50: Middle East & Africa Microgreens Market Revenue (Million), by Production Analysis 2024 & 2032
                                                              51. Figure 51: Middle East & Africa Microgreens Market Revenue Share (%), by Production Analysis 2024 & 2032
                                                              52. Figure 52: Middle East & Africa Microgreens Market Revenue (Million), by Consumption Analysis 2024 & 2032
                                                              53. Figure 53: Middle East & Africa Microgreens Market Revenue Share (%), by Consumption Analysis 2024 & 2032
                                                              54. Figure 54: Middle East & Africa Microgreens Market Revenue (Million), by Import Market Analysis (Value & Volume) 2024 & 2032
                                                              55. Figure 55: Middle East & Africa Microgreens Market Revenue Share (%), by Import Market Analysis (Value & Volume) 2024 & 2032
                                                              56. Figure 56: Middle East & Africa Microgreens Market Revenue (Million), by Export Market Analysis (Value & Volume) 2024 & 2032
                                                              57. Figure 57: Middle East & Africa Microgreens Market Revenue Share (%), by Export Market Analysis (Value & Volume) 2024 & 2032
                                                              58. Figure 58: Middle East & Africa Microgreens Market Revenue (Million), by Price Trend Analysis 2024 & 2032
                                                              59. Figure 59: Middle East & Africa Microgreens Market Revenue Share (%), by Price Trend Analysis 2024 & 2032
                                                              60. Figure 60: Middle East & Africa Microgreens Market Revenue (Million), by Country 2024 & 2032
                                                              61. Figure 61: Middle East & Africa Microgreens Market Revenue Share (%), by Country 2024 & 2032
                                                              62. Figure 62: Asia Pacific Microgreens Market Revenue (Million), by Production Analysis 2024 & 2032
                                                              63. Figure 63: Asia Pacific Microgreens Market Revenue Share (%), by Production Analysis 2024 & 2032
                                                              64. Figure 64: Asia Pacific Microgreens Market Revenue (Million), by Consumption Analysis 2024 & 2032
                                                              65. Figure 65: Asia Pacific Microgreens Market Revenue Share (%), by Consumption Analysis 2024 & 2032
                                                              66. Figure 66: Asia Pacific Microgreens Market Revenue (Million), by Import Market Analysis (Value & Volume) 2024 & 2032
                                                              67. Figure 67: Asia Pacific Microgreens Market Revenue Share (%), by Import Market Analysis (Value & Volume) 2024 & 2032
                                                              68. Figure 68: Asia Pacific Microgreens Market Revenue (Million), by Export Market Analysis (Value & Volume) 2024 & 2032
                                                              69. Figure 69: Asia Pacific Microgreens Market Revenue Share (%), by Export Market Analysis (Value & Volume) 2024 & 2032
                                                              70. Figure 70: Asia Pacific Microgreens Market Revenue (Million), by Price Trend Analysis 2024 & 2032
                                                              71. Figure 71: Asia Pacific Microgreens Market Revenue Share (%), by Price Trend Analysis 2024 & 2032
                                                              72. Figure 72: Asia Pacific Microgreens Market Revenue (Million), by Country 2024 & 2032
                                                              73. Figure 73: Asia Pacific Microgreens Market Revenue Share (%), by Country 2024 & 2032

                                                              List of Tables

                                                              1. Table 1: Global Microgreens Market Revenue Million Forecast, by Region 2019 & 2032
                                                              2. Table 2: Global Microgreens Market Revenue Million Forecast, by Production Analysis 2019 & 2032
                                                              3. Table 3: Global Microgreens Market Revenue Million Forecast, by Consumption Analysis 2019 & 2032
                                                              4. Table 4: Global Microgreens Market Revenue Million Forecast, by Import Market Analysis (Value & Volume) 2019 & 2032
                                                              5. Table 5: Global Microgreens Market Revenue Million Forecast, by Export Market Analysis (Value & Volume) 2019 & 2032
                                                              6. Table 6: Global Microgreens Market Revenue Million Forecast, by Price Trend Analysis 2019 & 2032
                                                              7. Table 7: Global Microgreens Market Revenue Million Forecast, by Region 2019 & 2032
                                                              8. Table 8: Global Microgreens Market Revenue Million Forecast, by Country 2019 & 2032
                                                              9. Table 9: United States Microgreens Market Revenue (Million) Forecast, by Application 2019 & 2032
                                                              10. Table 10: Canada Microgreens Market Revenue (Million) Forecast, by Application 2019 & 2032
                                                              11. Table 11: Mexico Microgreens Market Revenue (Million) Forecast, by Application 2019 & 2032
                                                              12. Table 12: Global Microgreens Market Revenue Million Forecast, by Country 2019 & 2032
                                                              13. Table 13: Germany Microgreens Market Revenue (Million) Forecast, by Application 2019 & 2032
                                                              14. Table 14: United Kingdom Microgreens Market Revenue (Million) Forecast, by Application 2019 & 2032
                                                              15. Table 15: France Microgreens Market Revenue (Million) Forecast, by Application 2019 & 2032
                                                              16. Table 16: Spain Microgreens Market Revenue (Million) Forecast, by Application 2019 & 2032
                                                              17. Table 17: Italy Microgreens Market Revenue (Million) Forecast, by Application 2019 & 2032
                                                              18. Table 18: Spain Microgreens Market Revenue (Million) Forecast, by Application 2019 & 2032
                                                              19. Table 19: Belgium Microgreens Market Revenue (Million) Forecast, by Application 2019 & 2032
                                                              20. Table 20: Netherland Microgreens Market Revenue (Million) Forecast, by Application 2019 & 2032
                                                              21. Table 21: Nordics Microgreens Market Revenue (Million) Forecast, by Application 2019 & 2032
                                                              22. Table 22: Rest of Europe Microgreens Market Revenue (Million) Forecast, by Application 2019 & 2032
                                                              23. Table 23: Global Microgreens Market Revenue Million Forecast, by Country 2019 & 2032
                                                              24. Table 24: China Microgreens Market Revenue (Million) Forecast, by Application 2019 & 2032
                                                              25. Table 25: Japan Microgreens Market Revenue (Million) Forecast, by Application 2019 & 2032
                                                              26. Table 26: India Microgreens Market Revenue (Million) Forecast, by Application 2019 & 2032
                                                              27. Table 27: South Korea Microgreens Market Revenue (Million) Forecast, by Application 2019 & 2032
                                                              28. Table 28: Southeast Asia Microgreens Market Revenue (Million) Forecast, by Application 2019 & 2032
                                                              29. Table 29: Australia Microgreens Market Revenue (Million) Forecast, by Application 2019 & 2032
                                                              30. Table 30: Indonesia Microgreens Market Revenue (Million) Forecast, by Application 2019 & 2032
                                                              31. Table 31: Phillipes Microgreens Market Revenue (Million) Forecast, by Application 2019 & 2032
                                                              32. Table 32: Singapore Microgreens Market Revenue (Million) Forecast, by Application 2019 & 2032
                                                              33. Table 33: Thailandc Microgreens Market Revenue (Million) Forecast, by Application 2019 & 2032
                                                              34. Table 34: Rest of Asia Pacific Microgreens Market Revenue (Million) Forecast, by Application 2019 & 2032
                                                              35. Table 35: Global Microgreens Market Revenue Million Forecast, by Country 2019 & 2032
                                                              36. Table 36: Brazil Microgreens Market Revenue (Million) Forecast, by Application 2019 & 2032
                                                              37. Table 37: Argentina Microgreens Market Revenue (Million) Forecast, by Application 2019 & 2032
                                                              38. Table 38: Peru Microgreens Market Revenue (Million) Forecast, by Application 2019 & 2032
                                                              39. Table 39: Chile Microgreens Market Revenue (Million) Forecast, by Application 2019 & 2032
                                                              40. Table 40: Colombia Microgreens Market Revenue (Million) Forecast, by Application 2019 & 2032
                                                              41. Table 41: Ecuador Microgreens Market Revenue (Million) Forecast, by Application 2019 & 2032
                                                              42. Table 42: Venezuela Microgreens Market Revenue (Million) Forecast, by Application 2019 & 2032
                                                              43. Table 43: Rest of South America Microgreens Market Revenue (Million) Forecast, by Application 2019 & 2032
                                                              44. Table 44: Global Microgreens Market Revenue Million Forecast, by Country 2019 & 2032
                                                              45. Table 45: United States Microgreens Market Revenue (Million) Forecast, by Application 2019 & 2032
                                                              46. Table 46: Canada Microgreens Market Revenue (Million) Forecast, by Application 2019 & 2032
                                                              47. Table 47: Mexico Microgreens Market Revenue (Million) Forecast, by Application 2019 & 2032
                                                              48. Table 48: Global Microgreens Market Revenue Million Forecast, by Country 2019 & 2032
                                                              49. Table 49: United Arab Emirates Microgreens Market Revenue (Million) Forecast, by Application 2019 & 2032
                                                              50. Table 50: Saudi Arabia Microgreens Market Revenue (Million) Forecast, by Application 2019 & 2032
                                                              51. Table 51: South Africa Microgreens Market Revenue (Million) Forecast, by Application 2019 & 2032
                                                              52. Table 52: Rest of Middle East and Africa Microgreens Market Revenue (Million) Forecast, by Application 2019 & 2032
                                                              53. Table 53: Global Microgreens Market Revenue Million Forecast, by Production Analysis 2019 & 2032
                                                              54. Table 54: Global Microgreens Market Revenue Million Forecast, by Consumption Analysis 2019 & 2032
                                                              55. Table 55: Global Microgreens Market Revenue Million Forecast, by Import Market Analysis (Value & Volume) 2019 & 2032
                                                              56. Table 56: Global Microgreens Market Revenue Million Forecast, by Export Market Analysis (Value & Volume) 2019 & 2032
                                                              57. Table 57: Global Microgreens Market Revenue Million Forecast, by Price Trend Analysis 2019 & 2032
                                                              58. Table 58: Global Microgreens Market Revenue Million Forecast, by Country 2019 & 2032
                                                              59. Table 59: United States Microgreens Market Revenue (Million) Forecast, by Application 2019 & 2032
                                                              60. Table 60: Canada Microgreens Market Revenue (Million) Forecast, by Application 2019 & 2032
                                                              61. Table 61: Mexico Microgreens Market Revenue (Million) Forecast, by Application 2019 & 2032
                                                              62. Table 62: Global Microgreens Market Revenue Million Forecast, by Production Analysis 2019 & 2032
                                                              63. Table 63: Global Microgreens Market Revenue Million Forecast, by Consumption Analysis 2019 & 2032
                                                              64. Table 64: Global Microgreens Market Revenue Million Forecast, by Import Market Analysis (Value & Volume) 2019 & 2032
                                                              65. Table 65: Global Microgreens Market Revenue Million Forecast, by Export Market Analysis (Value & Volume) 2019 & 2032
                                                              66. Table 66: Global Microgreens Market Revenue Million Forecast, by Price Trend Analysis 2019 & 2032
                                                              67. Table 67: Global Microgreens Market Revenue Million Forecast, by Country 2019 & 2032
                                                              68. Table 68: Brazil Microgreens Market Revenue (Million) Forecast, by Application 2019 & 2032
                                                              69. Table 69: Argentina Microgreens Market Revenue (Million) Forecast, by Application 2019 & 2032
                                                              70. Table 70: Rest of South America Microgreens Market Revenue (Million) Forecast, by Application 2019 & 2032
                                                              71. Table 71: Global Microgreens Market Revenue Million Forecast, by Production Analysis 2019 & 2032
                                                              72. Table 72: Global Microgreens Market Revenue Million Forecast, by Consumption Analysis 2019 & 2032
                                                              73. Table 73: Global Microgreens Market Revenue Million Forecast, by Import Market Analysis (Value & Volume) 2019 & 2032
                                                              74. Table 74: Global Microgreens Market Revenue Million Forecast, by Export Market Analysis (Value & Volume) 2019 & 2032
                                                              75. Table 75: Global Microgreens Market Revenue Million Forecast, by Price Trend Analysis 2019 & 2032
                                                              76. Table 76: Global Microgreens Market Revenue Million Forecast, by Country 2019 & 2032
                                                              77. Table 77: United Kingdom Microgreens Market Revenue (Million) Forecast, by Application 2019 & 2032
                                                              78. Table 78: Germany Microgreens Market Revenue (Million) Forecast, by Application 2019 & 2032
                                                              79. Table 79: France Microgreens Market Revenue (Million) Forecast, by Application 2019 & 2032
                                                              80. Table 80: Italy Microgreens Market Revenue (Million) Forecast, by Application 2019 & 2032
                                                              81. Table 81: Spain Microgreens Market Revenue (Million) Forecast, by Application 2019 & 2032
                                                              82. Table 82: Russia Microgreens Market Revenue (Million) Forecast, by Application 2019 & 2032
                                                              83. Table 83: Benelux Microgreens Market Revenue (Million) Forecast, by Application 2019 & 2032
                                                              84. Table 84: Nordics Microgreens Market Revenue (Million) Forecast, by Application 2019 & 2032
                                                              85. Table 85: Rest of Europe Microgreens Market Revenue (Million) Forecast, by Application 2019 & 2032
                                                              86. Table 86: Global Microgreens Market Revenue Million Forecast, by Production Analysis 2019 & 2032
                                                              87. Table 87: Global Microgreens Market Revenue Million Forecast, by Consumption Analysis 2019 & 2032
                                                              88. Table 88: Global Microgreens Market Revenue Million Forecast, by Import Market Analysis (Value & Volume) 2019 & 2032
                                                              89. Table 89: Global Microgreens Market Revenue Million Forecast, by Export Market Analysis (Value & Volume) 2019 & 2032
                                                              90. Table 90: Global Microgreens Market Revenue Million Forecast, by Price Trend Analysis 2019 & 2032
                                                              91. Table 91: Global Microgreens Market Revenue Million Forecast, by Country 2019 & 2032
                                                              92. Table 92: Turkey Microgreens Market Revenue (Million) Forecast, by Application 2019 & 2032
                                                              93. Table 93: Israel Microgreens Market Revenue (Million) Forecast, by Application 2019 & 2032
                                                              94. Table 94: GCC Microgreens Market Revenue (Million) Forecast, by Application 2019 & 2032
                                                              95. Table 95: North Africa Microgreens Market Revenue (Million) Forecast, by Application 2019 & 2032
                                                              96. Table 96: South Africa Microgreens Market Revenue (Million) Forecast, by Application 2019 & 2032
                                                              97. Table 97: Rest of Middle East & Africa Microgreens Market Revenue (Million) Forecast, by Application 2019 & 2032
                                                              98. Table 98: Global Microgreens Market Revenue Million Forecast, by Production Analysis 2019 & 2032
                                                              99. Table 99: Global Microgreens Market Revenue Million Forecast, by Consumption Analysis 2019 & 2032
                                                              100. Table 100: Global Microgreens Market Revenue Million Forecast, by Import Market Analysis (Value & Volume) 2019 & 2032
                                                              101. Table 101: Global Microgreens Market Revenue Million Forecast, by Export Market Analysis (Value & Volume) 2019 & 2032
                                                              102. Table 102: Global Microgreens Market Revenue Million Forecast, by Price Trend Analysis 2019 & 2032
                                                              103. Table 103: Global Microgreens Market Revenue Million Forecast, by Country 2019 & 2032
                                                              104. Table 104: China Microgreens Market Revenue (Million) Forecast, by Application 2019 & 2032
                                                              105. Table 105: India Microgreens Market Revenue (Million) Forecast, by Application 2019 & 2032
                                                              106. Table 106: Japan Microgreens Market Revenue (Million) Forecast, by Application 2019 & 2032
                                                              107. Table 107: South Korea Microgreens Market Revenue (Million) Forecast, by Application 2019 & 2032
                                                              108. Table 108: ASEAN Microgreens Market Revenue (Million) Forecast, by Application 2019 & 2032
                                                              109. Table 109: Oceania Microgreens Market Revenue (Million) Forecast, by Application 2019 & 2032
                                                              110. Table 110: Rest of Asia Pacific Microgreens Market Revenue (Million) Forecast, by Application 2019 & 2032


                                                              Frequently Asked Questions

                                                              1. What is the projected Compound Annual Growth Rate (CAGR) of the Microgreens Market?

                                                              The projected CAGR is approximately 6.40%.

                                                              2. Which companies are prominent players in the Microgreens Market?

                                                              Key companies in the market include Living Earth Farm, Farm Box Greens, Gotham Greens*List Not Exhaustive, Jiangsu Skyplant Greenhouse Technology Co Ltd, Madar Farms, Chef's Garden Inc, Shanghai Dehuan Industry Co Ltd, Metro Microgreens, Goodleaf Farms, AeroFarms LLC.

                                                              3. What are the main segments of the Microgreens Market?

                                                              The market segments include Production Analysis, Consumption Analysis, Import Market Analysis (Value & Volume), Export Market Analysis (Value & Volume), Price Trend Analysis.

                                                              4. Can you provide details about the market size?

                                                              The market size is estimated to be USD 245.77 Million as of 2022.

                                                              5. What are some drivers contributing to market growth?

                                                              Seed Treatment As A Solution To Enhance Yield; Growing Awareness For Seed Treatment Among The Farmers; Rising Trend Of Organic Farming.

                                                              6. What are the notable trends driving market growth?

                                                              Rise in Adoption of Indoor Farming.

                                                              7. Are there any restraints impacting market growth?

                                                              Limitations Across Farm-Level Seed Treatment; Rising Environmental Concerns.

                                                              8. Can you provide examples of recent developments in the market?

                                                              May 2023: AeroFarms, a Certified B Corporation and a prominent figure in indoor vertical farming took a significant step forward by launching a nationwide expansion through a collaboration with Amazon Fresh. This partnership aims to enhance the high-tech consumer grocery experience. Building on their prior success with Whole Foods Market in 2022, AeroFarms became the first indoor leafy greens grower to be included in Whole Foods Market's Global Planogram, setting an industry precedent.

                                                              9. What pricing options are available for accessing the report?

                                                              Pricing options include single-user, multi-user, and enterprise licenses priced at USD 4750, USD 5250, and USD 8750 respectively.

                                                              10. Is the market size provided in terms of value or volume?

                                                              The market size is provided in terms of value, measured in Million.

                                                              11. Are there any specific market keywords associated with the report?

                                                              Yes, the market keyword associated with the report is "Microgreens Market," which aids in identifying and referencing the specific market segment covered.

                                                              12. How do I determine which pricing option suits my needs best?

                                                              The pricing options vary based on user requirements and access needs. Individual users may opt for single-user licenses, while businesses requiring broader access may choose multi-user or enterprise licenses for cost-effective access to the report.

                                                              13. Are there any additional resources or data provided in the Microgreens Market report?

                                                              While the report offers comprehensive insights, it's advisable to review the specific contents or supplementary materials provided to ascertain if additional resources or data are available.

                                                              14. How can I stay updated on further developments or reports in the Microgreens Market?

                                                              To stay informed about further developments, trends, and reports in the Microgreens Market, consider subscribing to industry newsletters, following relevant companies and organizations, or regularly checking reputable industry news sources and publications.


                                                              Methodology

                                                              Step 1 - Identification of Relevant Samples Size from Population Database

                                                              Step Chart
                                                              Bar Chart
                                                              Method Chart

                                                              Step 2 - Approaches for Defining Global Market Size (Value, Volume* & Price*)

                                                              Approach Chart
                                                              Top-down and bottom-up approaches are used to validate the global market size and estimate the market size for manufactures, regional segments, product, and application.

                                                              Note*: In applicable scenarios

                                                              Step 3 - Data Sources

                                                              Primary Research

                                                              • Web Analytics
                                                              • Survey Reports
                                                              • Research Institute
                                                              • Latest Research Reports
                                                              • Opinion Leaders

                                                              Secondary Research

                                                              • Annual Reports
                                                              • White Paper
                                                              • Latest Press Release
                                                              • Industry Association
                                                              • Paid Database
                                                              • Investor Presentations
                                                              Analyst Chart

                                                              Step 4 - Data Triangulation

                                                              Involves using different sources of information in order to increase the validity of a study

                                                              These sources are likely to be stakeholders in a program - participants, other researchers, program staff, other community members, and so on.

                                                              Then we put all data in single framework & apply various statistical tools to find out the dynamic on the market.

                                                              During the analysis stage, feedback from the stakeholder groups would be compared to determine areas of agreement as well as areas of divergence

                                                              Additionally, after gathering mixed and scattered data from a wide range of sources, data is triangulated and correlated to come up with estimated figures which are further validated through primary mediums or industry experts, opinion leaders.

                                                              About Precision Market View

                                                              Precision Market View offers precise market research, industry intelligence, and data analysis for healthcare, manufacturing, technology, and energy. Our reports provide the clarity you need to make informed decisions and drive growth.

                                                              Our team combines primary research, advanced analytics, and industry expertise to deliver actionable intelligence. We offer syndicated reports, custom research, and consulting services tailored to your business needs.

                                                              At Precision Market View, we are committed to quality, transparency, and client satisfaction. Every report is rigorously validated to ensure accuracy and relevance. Our global perspective and local expertise help you understand both the big picture and the finer details of your market.

                                                              Stay informed with Precision Market View. Subscribe to our newsletter for the latest updates and research highlights, and follow us on social media for real-time insights.

                                                              Precision Market View – Clarity for Your Strategic Decisions.

                                                              artwork spiralartwork spiralRelated Reports
                                                              artwork underline

                                                              India Maize Seed Market Market Strategies for the Next Decade: 2025-2033

                                                              Discover the booming Indian maize seed market! This comprehensive analysis reveals a CAGR of 10.20% (2025-2033), driven by hybrid seed adoption and rising demand. Explore key players, regional trends, and growth projections for this lucrative sector.

                                                              July 2025
                                                              Base Year: 2024
                                                              No Of Pages: 197
                                                              Price: $3800

                                                              Future Forecasts for India Combine Harvester Market Industry Growth

                                                              The India Combine Harvester Market is booming, projected to reach ₹[estimated 2033 value] million by 2033 with a 5.70% CAGR. Discover key trends, drivers, and restraints shaping this dynamic sector, including leading players like Kubota and Mahindra. Explore regional market analysis and growth forecasts for self-propelled, track, and tractor-powered harvesters.

                                                              July 2025
                                                              Base Year: 2024
                                                              No Of Pages: 197
                                                              Price: $3800

                                                              Canada Crop Protection Chemicals Industry Unlocking Growth Potential: 2025-2033 Analysis and Forecasts

                                                              Discover the growth trajectory of Canada's crop protection chemicals market (2025-2033). This in-depth analysis reveals market size, CAGR, key segments (insecticides, fungicides, herbicides), leading companies, and regional trends. Learn about market drivers, restraints, and future opportunities in the Canadian agricultural sector.

                                                              July 2025
                                                              Base Year: 2024
                                                              No Of Pages: 150
                                                              Price: $3800

                                                              Turf & Ornamental Chemical Input Industry Market Report: Trends and Growth

                                                              The Turf & Ornamental Chemical Input market is booming, projected to reach $9.875 billion by 2033 with a 4.34% CAGR. Discover key trends, leading companies (FMC, Bayer, Syngenta), and regional insights in this comprehensive market analysis. Explore the impact of pesticides, fertilizers, and growth regulators on landscaping and gardening.

                                                              July 2025
                                                              Base Year: 2024
                                                              No Of Pages: 234
                                                              Price: $4750

                                                              Brazil Maize Market: Growth Opportunities and Competitive Landscape Overview 2025-2033

                                                              Discover the booming Brazil maize market forecast (2025-2033)! This in-depth analysis reveals key trends, drivers, and challenges impacting hybrid maize, conventional maize, and applications across animal feed, human consumption, and biofuels. Learn about major players like Syngenta and Corteva and the projected market size and CAGR.

                                                              July 2025
                                                              Base Year: 2024
                                                              No Of Pages: 180
                                                              Price: $3800

                                                              Opportunities in North America Crop Protection Chemicals Industry Market 2025-2033

                                                              The North American crop protection chemicals market is booming, projected to reach [estimated 2033 market size in millions] by 2033 with a 4.34% CAGR. Discover key trends, driving forces, and major players shaping this dynamic industry, including insecticides, herbicides, fungicides, and more. Learn about regional variations and market segmentation across various crop types and application methods.

                                                              July 2025
                                                              Base Year: 2024
                                                              No Of Pages: 180
                                                              Price: $3800

                                                              Apple Industry to Grow at XX CAGR: Market Size Analysis and Forecasts 2025-2033

                                                              Discover the latest trends in the global apple industry. This in-depth market analysis reveals a steady growth trajectory, driven by consumer demand, diverse product applications, and expanding online retail. Learn about key players, regional insights, and future projections for the apple market from 2025-2033.

                                                              July 2025
                                                              Base Year: 2024
                                                              No Of Pages: 234
                                                              Price: $4750

                                                              Digital Agriculture Market 2025-2033: Preparing for Growth and Change

                                                              The booming digital agriculture market is projected to reach \$44.14 billion by 2033, fueled by precision farming, AI, and drone technology. Explore market trends, key players (AGCO, Microsoft, Deere), and regional growth in this comprehensive analysis.

                                                              July 2025
                                                              Base Year: 2024
                                                              No Of Pages: 150
                                                              Price: $4750

                                                              North America Maize Industry Charting Growth Trajectories 2025-2033: Strategic Insights and Forecasts

                                                              Discover the booming North American maize market! This comprehensive analysis reveals key trends, drivers, and restraints, including insights into hybrid seeds, field corn, sweet corn, popcorn, and major players like Bayer & Syngenta. Project your business strategy with our forecast to 2033.

                                                              July 2025
                                                              Base Year: 2024
                                                              No Of Pages: 180
                                                              Price: $3800

                                                              North America Agricultural Tractors Machinery Market 2025-2033 Overview: Trends, Competitor Dynamics, and Opportunities

                                                              Discover the booming North American agricultural tractors market! This comprehensive analysis reveals key trends, drivers, and restraints impacting the $16.39 billion industry through 2033, focusing on key players like Deere & Company and Mahindra & Mahindra. Explore market segmentation by HP and drive type, plus regional breakdowns.

                                                              July 2025
                                                              Base Year: 2024
                                                              No Of Pages: 234
                                                              Price: $4750

                                                              APAC Biofertilizers Market Growth Opportunities: Market Size Forecast to 2033

                                                              Discover the booming APAC biofertilizers market! This comprehensive analysis reveals a CAGR of 10.80%, driven by sustainable agriculture and growing demand for organic food. Explore market size projections, key segments (Rhizobium, Azospirillum, etc.), and leading companies shaping this dynamic industry.

                                                              July 2025
                                                              Base Year: 2024
                                                              No Of Pages: 180
                                                              Price: $4750

                                                              Turkey Agricultural Tractor Market Dynamics and Forecasts: 2025-2033 Strategic Insights

                                                              Discover the booming Turkish agricultural tractor market! This comprehensive analysis reveals a 6.10% CAGR, driven by government support and technological advancements. Explore market trends, segmentation by horsepower (50HP, 75HP, 100HP, 200HP+), key players, and growth projections to 2033. Invest wisely in this expanding sector!

                                                              July 2025
                                                              Base Year: 2024
                                                              No Of Pages: 197
                                                              Price: $3800

                                                              North America Herbicide Market Insightful Analysis: Trends, Competitor Dynamics, and Opportunities 2025-2033

                                                              Discover the surging North American herbicide market, projected to reach $XX million by 2033 with a 4.34% CAGR. This in-depth analysis explores key drivers, trends, restraints, and competitive landscapes, covering chemigation, foliar application, crop types, and leading companies like FMC and Bayer. Gain insights into regional market shares and future growth projections.

                                                              July 2025
                                                              Base Year: 2024
                                                              No Of Pages: 180
                                                              Price: $3800

                                                              Vietnam Agro Machinery Market Insights: Growth at XX CAGR Through 2033

                                                              Discover the booming Vietnam agro-machinery market, projected to reach [estimated value] by 2033 with a CAGR of 11.50%. This in-depth analysis explores market drivers, trends, restraints, key players (Yanmar, Kubota, VEAM), and segment insights (tractors, rice transplanters, harvesting machinery). Learn about investment opportunities and future growth potential.

                                                              July 2025
                                                              Base Year: 2024
                                                              No Of Pages: 150
                                                              Price: $3800

                                                              Exploring Key Dynamics of Honey Industry Industry

                                                              Discover the booming honey market! This comprehensive analysis reveals a $11.08B industry with a 5.20% CAGR, exploring key drivers, trends, regional insights (North America, Europe, Asia-Pacific), and leading brands like Dabur Honey and Patanjali Ayurved. Learn about raw honey, organic honey, Manuka honey, and more. Get your free market research now!

                                                              July 2025
                                                              Base Year: 2024
                                                              No Of Pages: 234
                                                              Price: $4750

                                                              Emerging Market Insights in Cotton Trade Analysis Market: 2025-2033 Overview

                                                              Discover the latest insights into the booming global cotton trade market. This comprehensive analysis reveals a $60B market (2025) projected to grow at a 4.5% CAGR through 2033, driven by textile industry growth and sustainable cotton demand. Explore key trends, restraints, and regional market shares.

                                                              July 2025
                                                              Base Year: 2024
                                                              No Of Pages: 150
                                                              Price: $4750

                                                              Asia-pacific Tomato Seed Market Projected to Grow at XX CAGR: Insights and Forecasts 2025-2033

                                                              The Asia-Pacific tomato seed market is booming, driven by rising demand and advancements in breeding technology. Discover key market trends, growth projections (2025-2033), major players, and regional insights in this comprehensive market analysis.

                                                              July 2025
                                                              Base Year: 2024
                                                              No Of Pages: 180
                                                              Price: $3800

                                                              Uganda Agriculture Industry Market Strategies for the Next Decade: 2025-2033

                                                              Discover the booming Ugandan agriculture industry! Explore market size ($4.07B in 2025), 4.20% CAGR growth projections to 2033, key players, and regional trends in cereals, oilseeds, fruits, and vegetables. Invest in Uganda's agricultural future.

                                                              July 2025
                                                              Base Year: 2024
                                                              No Of Pages: 150
                                                              Price: $3800

                                                              Artichokes Industry: Harnessing Emerging Innovations for Growth 2025-2033

                                                              Discover the booming artichoke market! Explore key trends, regional analysis, and leading companies driving growth in this $XX million industry projected to reach [estimated 2033 value] by 2033. Learn about the rising demand for fresh, canned, frozen, and marinated artichokes in the food service, household, and industrial sectors.

                                                              July 2025
                                                              Base Year: 2024
                                                              No Of Pages: 197
                                                              Price: $3800

                                                              Agricultural Inoculants Market Growth Opportunities and Market Forecast 2025-2033: A Strategic Analysis

                                                              Discover the booming agricultural inoculants market! Our comprehensive analysis reveals a CAGR of 10.50%, driven by sustainable farming trends and rising food demands. Explore market size, segmentation, key players (Bioceres, Novozymes, BASF), and regional insights for 2025-2033. Learn how bio-based solutions are revolutionizing agriculture.

                                                              July 2025
                                                              Base Year: 2024
                                                              No Of Pages: 150
                                                              Price: $4750
                                                              • Home
                                                              • About Us
                                                              • Industries
                                                                • Aerospace & Defense
                                                                • Agriculture
                                                                • Animal Nutrition & Wellness
                                                                • Automotive
                                                                • Chemicals & Materials
                                                                • Consumer Goods and Services
                                                                • Energy & Power
                                                                • Financial Services and Investment Intelligence
                                                                • Food & Beverage
                                                                • Home and Property Improvement
                                                                • Hospitality and Tourism
                                                                • Logistics
                                                                • Manufacturing Products and Services
                                                                • Packaging
                                                                • Professional and Commercial Services
                                                                • Real Estate and Construction
                                                                • Retail
                                                                • Technology, Media and Telecom
                                                                • Healthcare
                                                              • Services
                                                              • Contact
                                                              Main Logo
                                                              • Home
                                                              • About Us
                                                              • Industries
                                                                • Aerospace & Defense
                                                                • Agriculture
                                                                • Animal Nutrition & Wellness
                                                                • Automotive
                                                                • Chemicals & Materials
                                                                • Consumer Goods and Services
                                                                • Energy & Power
                                                                • Financial Services and Investment Intelligence
                                                                • Food & Beverage
                                                                • Home and Property Improvement
                                                                • Hospitality and Tourism
                                                                • Logistics
                                                                • Manufacturing Products and Services
                                                                • Packaging
                                                                • Professional and Commercial Services
                                                                • Real Estate and Construction
                                                                • Retail
                                                                • Technology, Media and Telecom
                                                                • Healthcare
                                                              • Services
                                                              • Contact
                                                              +17162654855
                                                              [email protected]

                                                              +17162654855

                                                              [email protected]

                                                              Business Address

                                                              Head Office

                                                              Office no. A 5010, fifth floor, Solitaire Business Hub, Near Phoenix mall, Pune, Maharashtra 411014

                                                              Contact Information

                                                              Craig Francis

                                                              Business Development Head

                                                              +17162654855

                                                              [email protected]

                                                              Connect With Us

                                                              Secure Payment Partners

                                                              payment image
                                                              RetailLogisticsPackagingAutomotiveHealthcareAgricultureEnergy & PowerFood & BeverageAerospace & DefenseChemicals & MaterialsHospitality and TourismAnimal Nutrition & WellnessConsumer Goods and ServicesReal Estate and ConstructionHome and Property ImprovementTechnology, Media and TelecomManufacturing Products and ServicesFinancial Services and Investment Intelligence

                                                              © 2025 All rights reserved


                                                              Privacy Policy
                                                              Terms and Conditions
                                                              FAQ