
Key Insights
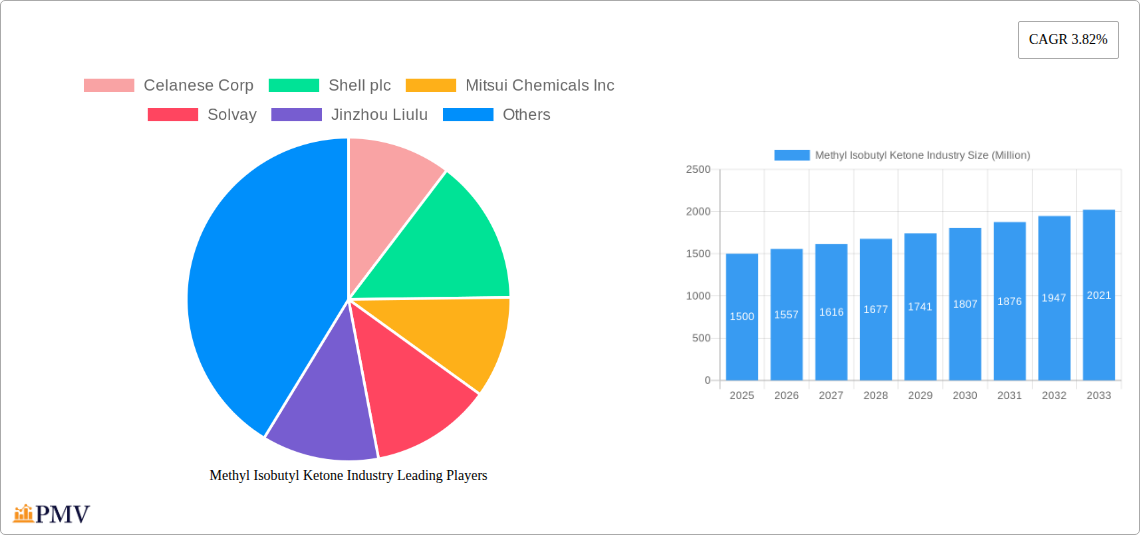
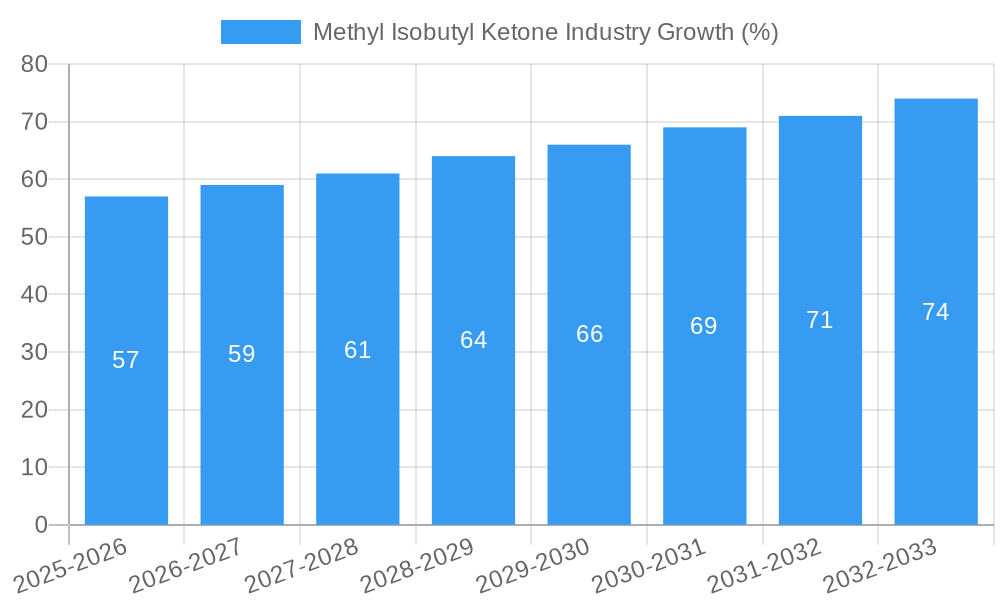
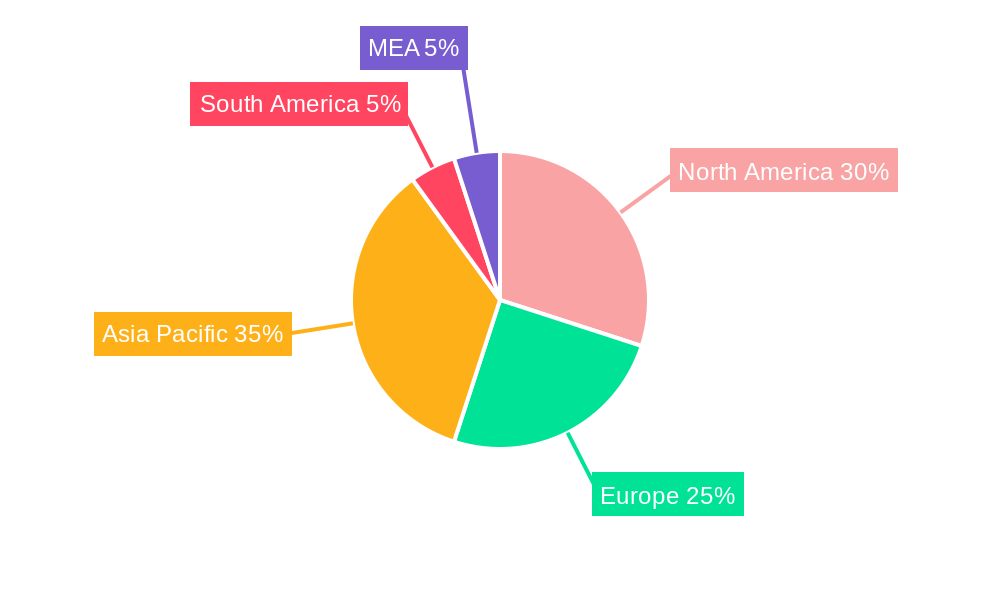
The Methyl Isobutyl Ketone (MIBK) market, valued at approximately $1.5 billion in 2025, is projected to experience steady growth, driven by increasing demand from key end-user industries. The Compound Annual Growth Rate (CAGR) of 3.82% from 2025 to 2033 indicates a positive outlook, largely attributed to the expanding paints and coatings sector, the burgeoning pharmaceutical industry’s reliance on MIBK as a solvent, and its crucial role in rubber processing. Growth in developing economies, particularly in Asia-Pacific, is further fueling market expansion. However, stringent environmental regulations concerning volatile organic compounds (VOCs) and the potential for substitute solvents pose significant challenges. The market segmentation highlights the dominance of solvents as the primary application, followed by rubber processing chemicals and surfactants. Major players like Celanese, Shell, and Mitsui Chemicals are driving innovation and capacity expansion, while regional variations in demand and regulatory landscapes influence market dynamics. The North American and Asia-Pacific regions are expected to maintain significant market share due to established industrial bases and robust growth in construction and manufacturing.
The competitive landscape is characterized by a mix of large multinational corporations and regional players. Strategic partnerships, acquisitions, and technological advancements are shaping the industry’s future. The continued growth in the construction, automotive, and pharmaceutical sectors will significantly influence MIBK demand in the coming years. Furthermore, the development of more sustainable and environmentally friendly MIBK production methods will be crucial for long-term market success, addressing concerns surrounding VOC emissions and promoting environmentally responsible manufacturing practices. Focus on optimizing production processes and exploring biodegradable alternatives could be key differentiators for companies aiming to secure a competitive edge.
Methyl Isobutyl Ketone (MIBK) Industry Market Report: 2019-2033
This comprehensive report provides an in-depth analysis of the global Methyl Isobutyl Ketone (MIBK) industry, covering market structure, competitive dynamics, industry trends, dominant segments, product innovations, and future outlook. The study period spans from 2019 to 2033, with 2025 as the base and estimated year. The forecast period is 2025-2033, and the historical period encompasses 2019-2024. This report is crucial for businesses, investors, and researchers seeking to understand and navigate the complexities of the MIBK market.
Methyl Isobutyl Ketone Industry Market Structure & Competitive Dynamics
The global MIBK market exhibits a moderately consolidated structure, with several major players holding significant market share. Celanese Corp, Shell plc, Mitsui Chemicals Inc, and Solvay are prominent examples, collectively accounting for an estimated xx% of the global market in 2025. The industry’s competitive landscape is characterized by ongoing innovation in production processes and product formulations, driving efficiency and expanding application possibilities. Regulatory frameworks, varying across regions, influence production costs and market access. Product substitutes, such as other ketones and esters, pose competitive pressure, particularly in price-sensitive segments. End-user trends, especially in the paints and coatings sector, significantly influence MIBK demand. M&A activity has been moderate in recent years, with deal values totaling approximately $xx Million since 2019, primarily focused on expanding geographical reach and product portfolios.
- Market Concentration: Moderately consolidated, with top 4 players holding xx% market share (2025).
- Innovation Ecosystems: Focused on process efficiency and new applications.
- Regulatory Frameworks: Vary by region, impacting production costs and market access.
- Product Substitutes: Ketones and esters pose competitive pressure.
- End-User Trends: Paints and coatings sector drives significant demand.
- M&A Activity: Moderate activity since 2019, with total deal values of approximately $xx Million.
Methyl Isobutyl Ketone Industry Industry Trends & Insights
The MIBK market is experiencing steady growth, driven by increasing demand from various end-user industries. The global market is projected to register a Compound Annual Growth Rate (CAGR) of xx% during the forecast period (2025-2033), reaching a value of $xx Million by 2033. This growth is fueled by several factors: expanding applications in paints and coatings, the rising popularity of high-performance coatings, and growing demand from the pharmaceutical industry for high-purity MIBK. Technological disruptions, such as the adoption of more efficient production methods, are also contributing to market expansion. However, fluctuating raw material prices and environmental regulations pose challenges. The market penetration of MIBK in various applications remains relatively high, especially in solvents and rubber processing chemicals, although further penetration is expected in emerging applications such as surfactants and denaturants. Competitive dynamics are primarily centered around price competitiveness, product quality, and geographical reach.
Dominant Markets & Segments in Methyl Isobutyl Ketone Industry
The Asia-Pacific region is currently the dominant market for MIBK, driven by robust economic growth and expanding industrial sectors in countries like China and India. Within end-user industries, paints and coatings remain the largest segment, fueled by construction activity and automotive production. In terms of applications, solvents represent the most significant segment, accounting for approximately xx% of total MIBK consumption in 2025.
Key Drivers in Asia-Pacific:
- Rapid industrialization and urbanization.
- Growing automotive and construction sectors.
- Favorable government policies supporting industrial growth.
Dominant End-User Industry: Paints and Coatings (driven by construction and automotive).
Dominant Application: Solvents (due to wide use in various industries).
Dominance Analysis: The continued growth of the Asia-Pacific region is expected due to its substantial infrastructure development and manufacturing expansion. The paints and coatings segment will continue to lead due to consistent demand and the high-performance nature of MIBK-based products. The solvent application segment will maintain its dominance due to MIBK's versatility and effectiveness.
Methyl Isobutyl Ketone Industry Product Innovations
Recent advancements in MIBK production focus on enhancing efficiency and sustainability. This includes the development of more selective catalysts and improved purification techniques. New applications are being explored, particularly in the area of high-performance coatings and specialized adhesives, leveraging MIBK's unique solvency properties. The competitive advantage lies in offering high-purity MIBK, optimized formulations for specific applications, and sustainable production methods.
Report Segmentation & Scope
This report segments the MIBK market by end-user industry (Paints and Coatings, Pharmaceuticals, Rubber, Other End-user Industries) and application (Solvents, Rubber Processing Chemicals, Surfactants, Denaturants, Other Applications). Each segment's growth projection, market size (in Millions of dollars), and competitive dynamics are analyzed in detail. The Paints and Coatings segment is projected to witness significant growth due to increasing construction activities globally, while the Pharmaceuticals segment benefits from its use in various drug formulations. The Rubber segment is largely driven by tire production needs. The Solvents application segment is expected to maintain its dominance due to its broad industrial applications.
Key Drivers of Methyl Isobutyl Ketone Industry Growth
The growth of the MIBK industry is fueled by several key factors: the increasing demand from various end-use sectors like paints and coatings; advancements in manufacturing processes leading to cost reductions and improved product quality; and expansion in emerging economies driving industrial production. Favorable government policies and supportive regulatory frameworks in certain regions further stimulate market expansion.
Challenges in the Methyl Isobutyl Ketone Industry Sector
The MIBK industry faces challenges such as fluctuating raw material prices, stringent environmental regulations, and competitive pressure from substitute products. Supply chain disruptions can also impact production and availability, potentially leading to price volatility. These factors can affect profitability and long-term market growth, especially in price-sensitive regions.
Leading Players in the Methyl Isobutyl Ketone Industry Market
- Celanese Corp
- Shell plc
- Mitsui Chemicals Inc
- Solvay
- Jinzhou Liulu
- KH Neochem
- Sigma-Aldrich
- Arkema Group
- Monument Chemical
- Sasol
- Dow
- Carboclor
- Zhongneng Petrochemical
- KUMHO P&B CHEMICALS INC
Key Developments in Methyl Isobutyl Ketone Industry Sector
- October 2022: Celanese Corp announced an expansion of its MIBK production capacity.
- June 2023: Shell plc invested in research and development for sustainable MIBK production.
- (Add other relevant developments with dates and brief descriptions)
Strategic Methyl Isobutyl Ketone Industry Market Outlook
The MIBK market exhibits strong future potential, driven by sustained demand from various applications and technological advancements. Strategic opportunities lie in developing sustainable and cost-effective production processes, expanding into new applications, and focusing on high-growth regions like Asia-Pacific. Companies that invest in R&D, prioritize sustainability, and adapt to evolving regulatory landscapes will be best positioned to capitalize on the market's future growth.
Methyl Isobutyl Ketone Industry Segmentation
-
1. Application
- 1.1. Solvents
- 1.2. Rubber Processing Chemicals
- 1.3. Surfactants
- 1.4. Denaturants
- 1.5. Other Applications
-
2. End-user Industry
- 2.1. Paints and Coatings
- 2.2. Pharmaceuticals
- 2.3. Rubber
- 2.4. Other End-user Industries
Methyl Isobutyl Ketone Industry Segmentation By Geography
-
1. Asia Pacific
- 1.1. China
- 1.2. India
- 1.3. Japan
- 1.4. South Korea
- 1.5. Rest of Asia Pacific
-
2. North America
- 2.1. United States
- 2.2. Canada
- 2.3. Mexico
-
3. Europe
- 3.1. Germany
- 3.2. United Kingdom
- 3.3. Italy
- 3.4. France
- 3.5. Rest of Europe
-
4. South America
- 4.1. Brazil
- 4.2. Argentina
- 4.3. Rest of South America
-
5. Middle East and Africa
- 5.1. Saudi Arabia
- 5.2. South Africa
- 5.3. Rest of Middle East and Africa
Methyl Isobutyl Ketone Industry REPORT HIGHLIGHTS
| Aspects | Details |
|---|---|
| Study Period | 2019-2033 |
| Base Year | 2024 |
| Estimated Year | 2025 |
| Forecast Period | 2025-2033 |
| Historical Period | 2019-2024 |
| Growth Rate | CAGR of 3.82% from 2019-2033 |
| Segmentation |
|
Table of Contents
- 1. Introduction
- 1.1. Research Scope
- 1.2. Market Segmentation
- 1.3. Research Methodology
- 1.4. Definitions and Assumptions
- 2. Executive Summary
- 2.1. Introduction
- 3. Market Dynamics
- 3.1. Introduction
- 3.2. Market Drivers
- 3.2.1. Increasing Demand for MIBK in the Synthesis of Anti-ozonant Additive for Rubber; Increasing Demand for Solvents for Rubber Processing Chemicals in Asia; Increasing Demand for Surface Coatings
- 3.3. Market Restrains
- 3.3.1. Increasing Awareness About Toxic Effects of MIBK on Environment; Other Restraints
- 3.4. Market Trends
- 3.4.1. Increasing Demand from Paints and Coatings Industry
- 4. Market Factor Analysis
- 4.1. Porters Five Forces
- 4.2. Supply/Value Chain
- 4.3. PESTEL analysis
- 4.4. Market Entropy
- 4.5. Patent/Trademark Analysis
- 5. Global Methyl Isobutyl Ketone Industry Analysis, Insights and Forecast, 2019-2031
- 5.1. Market Analysis, Insights and Forecast - by Application
- 5.1.1. Solvents
- 5.1.2. Rubber Processing Chemicals
- 5.1.3. Surfactants
- 5.1.4. Denaturants
- 5.1.5. Other Applications
- 5.2. Market Analysis, Insights and Forecast - by End-user Industry
- 5.2.1. Paints and Coatings
- 5.2.2. Pharmaceuticals
- 5.2.3. Rubber
- 5.2.4. Other End-user Industries
- 5.3. Market Analysis, Insights and Forecast - by Region
- 5.3.1. Asia Pacific
- 5.3.2. North America
- 5.3.3. Europe
- 5.3.4. South America
- 5.3.5. Middle East and Africa
- 5.1. Market Analysis, Insights and Forecast - by Application
- 6. Asia Pacific Methyl Isobutyl Ketone Industry Analysis, Insights and Forecast, 2019-2031
- 6.1. Market Analysis, Insights and Forecast - by Application
- 6.1.1. Solvents
- 6.1.2. Rubber Processing Chemicals
- 6.1.3. Surfactants
- 6.1.4. Denaturants
- 6.1.5. Other Applications
- 6.2. Market Analysis, Insights and Forecast - by End-user Industry
- 6.2.1. Paints and Coatings
- 6.2.2. Pharmaceuticals
- 6.2.3. Rubber
- 6.2.4. Other End-user Industries
- 6.1. Market Analysis, Insights and Forecast - by Application
- 7. North America Methyl Isobutyl Ketone Industry Analysis, Insights and Forecast, 2019-2031
- 7.1. Market Analysis, Insights and Forecast - by Application
- 7.1.1. Solvents
- 7.1.2. Rubber Processing Chemicals
- 7.1.3. Surfactants
- 7.1.4. Denaturants
- 7.1.5. Other Applications
- 7.2. Market Analysis, Insights and Forecast - by End-user Industry
- 7.2.1. Paints and Coatings
- 7.2.2. Pharmaceuticals
- 7.2.3. Rubber
- 7.2.4. Other End-user Industries
- 7.1. Market Analysis, Insights and Forecast - by Application
- 8. Europe Methyl Isobutyl Ketone Industry Analysis, Insights and Forecast, 2019-2031
- 8.1. Market Analysis, Insights and Forecast - by Application
- 8.1.1. Solvents
- 8.1.2. Rubber Processing Chemicals
- 8.1.3. Surfactants
- 8.1.4. Denaturants
- 8.1.5. Other Applications
- 8.2. Market Analysis, Insights and Forecast - by End-user Industry
- 8.2.1. Paints and Coatings
- 8.2.2. Pharmaceuticals
- 8.2.3. Rubber
- 8.2.4. Other End-user Industries
- 8.1. Market Analysis, Insights and Forecast - by Application
- 9. South America Methyl Isobutyl Ketone Industry Analysis, Insights and Forecast, 2019-2031
- 9.1. Market Analysis, Insights and Forecast - by Application
- 9.1.1. Solvents
- 9.1.2. Rubber Processing Chemicals
- 9.1.3. Surfactants
- 9.1.4. Denaturants
- 9.1.5. Other Applications
- 9.2. Market Analysis, Insights and Forecast - by End-user Industry
- 9.2.1. Paints and Coatings
- 9.2.2. Pharmaceuticals
- 9.2.3. Rubber
- 9.2.4. Other End-user Industries
- 9.1. Market Analysis, Insights and Forecast - by Application
- 10. Middle East and Africa Methyl Isobutyl Ketone Industry Analysis, Insights and Forecast, 2019-2031
- 10.1. Market Analysis, Insights and Forecast - by Application
- 10.1.1. Solvents
- 10.1.2. Rubber Processing Chemicals
- 10.1.3. Surfactants
- 10.1.4. Denaturants
- 10.1.5. Other Applications
- 10.2. Market Analysis, Insights and Forecast - by End-user Industry
- 10.2.1. Paints and Coatings
- 10.2.2. Pharmaceuticals
- 10.2.3. Rubber
- 10.2.4. Other End-user Industries
- 10.1. Market Analysis, Insights and Forecast - by Application
- 11. North America Methyl Isobutyl Ketone Industry Analysis, Insights and Forecast, 2019-2031
- 11.1. Market Analysis, Insights and Forecast - By Country/Sub-region
- 11.1.1 United States
- 11.1.2 Canada
- 11.1.3 Mexico
- 12. Europe Methyl Isobutyl Ketone Industry Analysis, Insights and Forecast, 2019-2031
- 12.1. Market Analysis, Insights and Forecast - By Country/Sub-region
- 12.1.1 Germany
- 12.1.2 France
- 12.1.3 Italy
- 12.1.4 United Kingdom
- 12.1.5 Netherlands
- 12.1.6 Rest of Europe
- 13. Asia Pacific Methyl Isobutyl Ketone Industry Analysis, Insights and Forecast, 2019-2031
- 13.1. Market Analysis, Insights and Forecast - By Country/Sub-region
- 13.1.1 China
- 13.1.2 Japan
- 13.1.3 India
- 13.1.4 South Korea
- 13.1.5 Taiwan
- 13.1.6 Australia
- 13.1.7 Rest of Asia-Pacific
- 14. South America Methyl Isobutyl Ketone Industry Analysis, Insights and Forecast, 2019-2031
- 14.1. Market Analysis, Insights and Forecast - By Country/Sub-region
- 14.1.1 Brazil
- 14.1.2 Argentina
- 14.1.3 Rest of South America
- 15. MEA Methyl Isobutyl Ketone Industry Analysis, Insights and Forecast, 2019-2031
- 15.1. Market Analysis, Insights and Forecast - By Country/Sub-region
- 15.1.1 Middle East
- 15.1.2 Africa
- 16. Competitive Analysis
- 16.1. Global Market Share Analysis 2024
- 16.2. Company Profiles
- 16.2.1 Celanese Corp
- 16.2.1.1. Overview
- 16.2.1.2. Products
- 16.2.1.3. SWOT Analysis
- 16.2.1.4. Recent Developments
- 16.2.1.5. Financials (Based on Availability)
- 16.2.2 Shell plc
- 16.2.2.1. Overview
- 16.2.2.2. Products
- 16.2.2.3. SWOT Analysis
- 16.2.2.4. Recent Developments
- 16.2.2.5. Financials (Based on Availability)
- 16.2.3 Mitsui Chemicals Inc
- 16.2.3.1. Overview
- 16.2.3.2. Products
- 16.2.3.3. SWOT Analysis
- 16.2.3.4. Recent Developments
- 16.2.3.5. Financials (Based on Availability)
- 16.2.4 Solvay
- 16.2.4.1. Overview
- 16.2.4.2. Products
- 16.2.4.3. SWOT Analysis
- 16.2.4.4. Recent Developments
- 16.2.4.5. Financials (Based on Availability)
- 16.2.5 Jinzhou Liulu
- 16.2.5.1. Overview
- 16.2.5.2. Products
- 16.2.5.3. SWOT Analysis
- 16.2.5.4. Recent Developments
- 16.2.5.5. Financials (Based on Availability)
- 16.2.6 KH Neochem
- 16.2.6.1. Overview
- 16.2.6.2. Products
- 16.2.6.3. SWOT Analysis
- 16.2.6.4. Recent Developments
- 16.2.6.5. Financials (Based on Availability)
- 16.2.7 Sigma-Aldrich
- 16.2.7.1. Overview
- 16.2.7.2. Products
- 16.2.7.3. SWOT Analysis
- 16.2.7.4. Recent Developments
- 16.2.7.5. Financials (Based on Availability)
- 16.2.8 Arkema Group
- 16.2.8.1. Overview
- 16.2.8.2. Products
- 16.2.8.3. SWOT Analysis
- 16.2.8.4. Recent Developments
- 16.2.8.5. Financials (Based on Availability)
- 16.2.9 Monument Chemical
- 16.2.9.1. Overview
- 16.2.9.2. Products
- 16.2.9.3. SWOT Analysis
- 16.2.9.4. Recent Developments
- 16.2.9.5. Financials (Based on Availability)
- 16.2.10 Sasol
- 16.2.10.1. Overview
- 16.2.10.2. Products
- 16.2.10.3. SWOT Analysis
- 16.2.10.4. Recent Developments
- 16.2.10.5. Financials (Based on Availability)
- 16.2.11 Dow
- 16.2.11.1. Overview
- 16.2.11.2. Products
- 16.2.11.3. SWOT Analysis
- 16.2.11.4. Recent Developments
- 16.2.11.5. Financials (Based on Availability)
- 16.2.12 Carboclor
- 16.2.12.1. Overview
- 16.2.12.2. Products
- 16.2.12.3. SWOT Analysis
- 16.2.12.4. Recent Developments
- 16.2.12.5. Financials (Based on Availability)
- 16.2.13 Zhongneng Petrochemical
- 16.2.13.1. Overview
- 16.2.13.2. Products
- 16.2.13.3. SWOT Analysis
- 16.2.13.4. Recent Developments
- 16.2.13.5. Financials (Based on Availability)
- 16.2.14 KUMHO P&B CHEMICALS INC
- 16.2.14.1. Overview
- 16.2.14.2. Products
- 16.2.14.3. SWOT Analysis
- 16.2.14.4. Recent Developments
- 16.2.14.5. Financials (Based on Availability)
- 16.2.1 Celanese Corp
List of Figures
- Figure 1: Global Methyl Isobutyl Ketone Industry Revenue Breakdown (Million, %) by Region 2024 & 2032
- Figure 2: Global Methyl Isobutyl Ketone Industry Volume Breakdown (K Tons, %) by Region 2024 & 2032
- Figure 3: North America Methyl Isobutyl Ketone Industry Revenue (Million), by Country 2024 & 2032
- Figure 4: North America Methyl Isobutyl Ketone Industry Volume (K Tons), by Country 2024 & 2032
- Figure 5: North America Methyl Isobutyl Ketone Industry Revenue Share (%), by Country 2024 & 2032
- Figure 6: North America Methyl Isobutyl Ketone Industry Volume Share (%), by Country 2024 & 2032
- Figure 7: Europe Methyl Isobutyl Ketone Industry Revenue (Million), by Country 2024 & 2032
- Figure 8: Europe Methyl Isobutyl Ketone Industry Volume (K Tons), by Country 2024 & 2032
- Figure 9: Europe Methyl Isobutyl Ketone Industry Revenue Share (%), by Country 2024 & 2032
- Figure 10: Europe Methyl Isobutyl Ketone Industry Volume Share (%), by Country 2024 & 2032
- Figure 11: Asia Pacific Methyl Isobutyl Ketone Industry Revenue (Million), by Country 2024 & 2032
- Figure 12: Asia Pacific Methyl Isobutyl Ketone Industry Volume (K Tons), by Country 2024 & 2032
- Figure 13: Asia Pacific Methyl Isobutyl Ketone Industry Revenue Share (%), by Country 2024 & 2032
- Figure 14: Asia Pacific Methyl Isobutyl Ketone Industry Volume Share (%), by Country 2024 & 2032
- Figure 15: South America Methyl Isobutyl Ketone Industry Revenue (Million), by Country 2024 & 2032
- Figure 16: South America Methyl Isobutyl Ketone Industry Volume (K Tons), by Country 2024 & 2032
- Figure 17: South America Methyl Isobutyl Ketone Industry Revenue Share (%), by Country 2024 & 2032
- Figure 18: South America Methyl Isobutyl Ketone Industry Volume Share (%), by Country 2024 & 2032
- Figure 19: MEA Methyl Isobutyl Ketone Industry Revenue (Million), by Country 2024 & 2032
- Figure 20: MEA Methyl Isobutyl Ketone Industry Volume (K Tons), by Country 2024 & 2032
- Figure 21: MEA Methyl Isobutyl Ketone Industry Revenue Share (%), by Country 2024 & 2032
- Figure 22: MEA Methyl Isobutyl Ketone Industry Volume Share (%), by Country 2024 & 2032
- Figure 23: Asia Pacific Methyl Isobutyl Ketone Industry Revenue (Million), by Application 2024 & 2032
- Figure 24: Asia Pacific Methyl Isobutyl Ketone Industry Volume (K Tons), by Application 2024 & 2032
- Figure 25: Asia Pacific Methyl Isobutyl Ketone Industry Revenue Share (%), by Application 2024 & 2032
- Figure 26: Asia Pacific Methyl Isobutyl Ketone Industry Volume Share (%), by Application 2024 & 2032
- Figure 27: Asia Pacific Methyl Isobutyl Ketone Industry Revenue (Million), by End-user Industry 2024 & 2032
- Figure 28: Asia Pacific Methyl Isobutyl Ketone Industry Volume (K Tons), by End-user Industry 2024 & 2032
- Figure 29: Asia Pacific Methyl Isobutyl Ketone Industry Revenue Share (%), by End-user Industry 2024 & 2032
- Figure 30: Asia Pacific Methyl Isobutyl Ketone Industry Volume Share (%), by End-user Industry 2024 & 2032
- Figure 31: Asia Pacific Methyl Isobutyl Ketone Industry Revenue (Million), by Country 2024 & 2032
- Figure 32: Asia Pacific Methyl Isobutyl Ketone Industry Volume (K Tons), by Country 2024 & 2032
- Figure 33: Asia Pacific Methyl Isobutyl Ketone Industry Revenue Share (%), by Country 2024 & 2032
- Figure 34: Asia Pacific Methyl Isobutyl Ketone Industry Volume Share (%), by Country 2024 & 2032
- Figure 35: North America Methyl Isobutyl Ketone Industry Revenue (Million), by Application 2024 & 2032
- Figure 36: North America Methyl Isobutyl Ketone Industry Volume (K Tons), by Application 2024 & 2032
- Figure 37: North America Methyl Isobutyl Ketone Industry Revenue Share (%), by Application 2024 & 2032
- Figure 38: North America Methyl Isobutyl Ketone Industry Volume Share (%), by Application 2024 & 2032
- Figure 39: North America Methyl Isobutyl Ketone Industry Revenue (Million), by End-user Industry 2024 & 2032
- Figure 40: North America Methyl Isobutyl Ketone Industry Volume (K Tons), by End-user Industry 2024 & 2032
- Figure 41: North America Methyl Isobutyl Ketone Industry Revenue Share (%), by End-user Industry 2024 & 2032
- Figure 42: North America Methyl Isobutyl Ketone Industry Volume Share (%), by End-user Industry 2024 & 2032
- Figure 43: North America Methyl Isobutyl Ketone Industry Revenue (Million), by Country 2024 & 2032
- Figure 44: North America Methyl Isobutyl Ketone Industry Volume (K Tons), by Country 2024 & 2032
- Figure 45: North America Methyl Isobutyl Ketone Industry Revenue Share (%), by Country 2024 & 2032
- Figure 46: North America Methyl Isobutyl Ketone Industry Volume Share (%), by Country 2024 & 2032
- Figure 47: Europe Methyl Isobutyl Ketone Industry Revenue (Million), by Application 2024 & 2032
- Figure 48: Europe Methyl Isobutyl Ketone Industry Volume (K Tons), by Application 2024 & 2032
- Figure 49: Europe Methyl Isobutyl Ketone Industry Revenue Share (%), by Application 2024 & 2032
- Figure 50: Europe Methyl Isobutyl Ketone Industry Volume Share (%), by Application 2024 & 2032
- Figure 51: Europe Methyl Isobutyl Ketone Industry Revenue (Million), by End-user Industry 2024 & 2032
- Figure 52: Europe Methyl Isobutyl Ketone Industry Volume (K Tons), by End-user Industry 2024 & 2032
- Figure 53: Europe Methyl Isobutyl Ketone Industry Revenue Share (%), by End-user Industry 2024 & 2032
- Figure 54: Europe Methyl Isobutyl Ketone Industry Volume Share (%), by End-user Industry 2024 & 2032
- Figure 55: Europe Methyl Isobutyl Ketone Industry Revenue (Million), by Country 2024 & 2032
- Figure 56: Europe Methyl Isobutyl Ketone Industry Volume (K Tons), by Country 2024 & 2032
- Figure 57: Europe Methyl Isobutyl Ketone Industry Revenue Share (%), by Country 2024 & 2032
- Figure 58: Europe Methyl Isobutyl Ketone Industry Volume Share (%), by Country 2024 & 2032
- Figure 59: South America Methyl Isobutyl Ketone Industry Revenue (Million), by Application 2024 & 2032
- Figure 60: South America Methyl Isobutyl Ketone Industry Volume (K Tons), by Application 2024 & 2032
- Figure 61: South America Methyl Isobutyl Ketone Industry Revenue Share (%), by Application 2024 & 2032
- Figure 62: South America Methyl Isobutyl Ketone Industry Volume Share (%), by Application 2024 & 2032
- Figure 63: South America Methyl Isobutyl Ketone Industry Revenue (Million), by End-user Industry 2024 & 2032
- Figure 64: South America Methyl Isobutyl Ketone Industry Volume (K Tons), by End-user Industry 2024 & 2032
- Figure 65: South America Methyl Isobutyl Ketone Industry Revenue Share (%), by End-user Industry 2024 & 2032
- Figure 66: South America Methyl Isobutyl Ketone Industry Volume Share (%), by End-user Industry 2024 & 2032
- Figure 67: South America Methyl Isobutyl Ketone Industry Revenue (Million), by Country 2024 & 2032
- Figure 68: South America Methyl Isobutyl Ketone Industry Volume (K Tons), by Country 2024 & 2032
- Figure 69: South America Methyl Isobutyl Ketone Industry Revenue Share (%), by Country 2024 & 2032
- Figure 70: South America Methyl Isobutyl Ketone Industry Volume Share (%), by Country 2024 & 2032
- Figure 71: Middle East and Africa Methyl Isobutyl Ketone Industry Revenue (Million), by Application 2024 & 2032
- Figure 72: Middle East and Africa Methyl Isobutyl Ketone Industry Volume (K Tons), by Application 2024 & 2032
- Figure 73: Middle East and Africa Methyl Isobutyl Ketone Industry Revenue Share (%), by Application 2024 & 2032
- Figure 74: Middle East and Africa Methyl Isobutyl Ketone Industry Volume Share (%), by Application 2024 & 2032
- Figure 75: Middle East and Africa Methyl Isobutyl Ketone Industry Revenue (Million), by End-user Industry 2024 & 2032
- Figure 76: Middle East and Africa Methyl Isobutyl Ketone Industry Volume (K Tons), by End-user Industry 2024 & 2032
- Figure 77: Middle East and Africa Methyl Isobutyl Ketone Industry Revenue Share (%), by End-user Industry 2024 & 2032
- Figure 78: Middle East and Africa Methyl Isobutyl Ketone Industry Volume Share (%), by End-user Industry 2024 & 2032
- Figure 79: Middle East and Africa Methyl Isobutyl Ketone Industry Revenue (Million), by Country 2024 & 2032
- Figure 80: Middle East and Africa Methyl Isobutyl Ketone Industry Volume (K Tons), by Country 2024 & 2032
- Figure 81: Middle East and Africa Methyl Isobutyl Ketone Industry Revenue Share (%), by Country 2024 & 2032
- Figure 82: Middle East and Africa Methyl Isobutyl Ketone Industry Volume Share (%), by Country 2024 & 2032
List of Tables
- Table 1: Global Methyl Isobutyl Ketone Industry Revenue Million Forecast, by Region 2019 & 2032
- Table 2: Global Methyl Isobutyl Ketone Industry Volume K Tons Forecast, by Region 2019 & 2032
- Table 3: Global Methyl Isobutyl Ketone Industry Revenue Million Forecast, by Application 2019 & 2032
- Table 4: Global Methyl Isobutyl Ketone Industry Volume K Tons Forecast, by Application 2019 & 2032
- Table 5: Global Methyl Isobutyl Ketone Industry Revenue Million Forecast, by End-user Industry 2019 & 2032
- Table 6: Global Methyl Isobutyl Ketone Industry Volume K Tons Forecast, by End-user Industry 2019 & 2032
- Table 7: Global Methyl Isobutyl Ketone Industry Revenue Million Forecast, by Region 2019 & 2032
- Table 8: Global Methyl Isobutyl Ketone Industry Volume K Tons Forecast, by Region 2019 & 2032
- Table 9: Global Methyl Isobutyl Ketone Industry Revenue Million Forecast, by Country 2019 & 2032
- Table 10: Global Methyl Isobutyl Ketone Industry Volume K Tons Forecast, by Country 2019 & 2032
- Table 11: United States Methyl Isobutyl Ketone Industry Revenue (Million) Forecast, by Application 2019 & 2032
- Table 12: United States Methyl Isobutyl Ketone Industry Volume (K Tons) Forecast, by Application 2019 & 2032
- Table 13: Canada Methyl Isobutyl Ketone Industry Revenue (Million) Forecast, by Application 2019 & 2032
- Table 14: Canada Methyl Isobutyl Ketone Industry Volume (K Tons) Forecast, by Application 2019 & 2032
- Table 15: Mexico Methyl Isobutyl Ketone Industry Revenue (Million) Forecast, by Application 2019 & 2032
- Table 16: Mexico Methyl Isobutyl Ketone Industry Volume (K Tons) Forecast, by Application 2019 & 2032
- Table 17: Global Methyl Isobutyl Ketone Industry Revenue Million Forecast, by Country 2019 & 2032
- Table 18: Global Methyl Isobutyl Ketone Industry Volume K Tons Forecast, by Country 2019 & 2032
- Table 19: Germany Methyl Isobutyl Ketone Industry Revenue (Million) Forecast, by Application 2019 & 2032
- Table 20: Germany Methyl Isobutyl Ketone Industry Volume (K Tons) Forecast, by Application 2019 & 2032
- Table 21: France Methyl Isobutyl Ketone Industry Revenue (Million) Forecast, by Application 2019 & 2032
- Table 22: France Methyl Isobutyl Ketone Industry Volume (K Tons) Forecast, by Application 2019 & 2032
- Table 23: Italy Methyl Isobutyl Ketone Industry Revenue (Million) Forecast, by Application 2019 & 2032
- Table 24: Italy Methyl Isobutyl Ketone Industry Volume (K Tons) Forecast, by Application 2019 & 2032
- Table 25: United Kingdom Methyl Isobutyl Ketone Industry Revenue (Million) Forecast, by Application 2019 & 2032
- Table 26: United Kingdom Methyl Isobutyl Ketone Industry Volume (K Tons) Forecast, by Application 2019 & 2032
- Table 27: Netherlands Methyl Isobutyl Ketone Industry Revenue (Million) Forecast, by Application 2019 & 2032
- Table 28: Netherlands Methyl Isobutyl Ketone Industry Volume (K Tons) Forecast, by Application 2019 & 2032
- Table 29: Rest of Europe Methyl Isobutyl Ketone Industry Revenue (Million) Forecast, by Application 2019 & 2032
- Table 30: Rest of Europe Methyl Isobutyl Ketone Industry Volume (K Tons) Forecast, by Application 2019 & 2032
- Table 31: Global Methyl Isobutyl Ketone Industry Revenue Million Forecast, by Country 2019 & 2032
- Table 32: Global Methyl Isobutyl Ketone Industry Volume K Tons Forecast, by Country 2019 & 2032
- Table 33: China Methyl Isobutyl Ketone Industry Revenue (Million) Forecast, by Application 2019 & 2032
- Table 34: China Methyl Isobutyl Ketone Industry Volume (K Tons) Forecast, by Application 2019 & 2032
- Table 35: Japan Methyl Isobutyl Ketone Industry Revenue (Million) Forecast, by Application 2019 & 2032
- Table 36: Japan Methyl Isobutyl Ketone Industry Volume (K Tons) Forecast, by Application 2019 & 2032
- Table 37: India Methyl Isobutyl Ketone Industry Revenue (Million) Forecast, by Application 2019 & 2032
- Table 38: India Methyl Isobutyl Ketone Industry Volume (K Tons) Forecast, by Application 2019 & 2032
- Table 39: South Korea Methyl Isobutyl Ketone Industry Revenue (Million) Forecast, by Application 2019 & 2032
- Table 40: South Korea Methyl Isobutyl Ketone Industry Volume (K Tons) Forecast, by Application 2019 & 2032
- Table 41: Taiwan Methyl Isobutyl Ketone Industry Revenue (Million) Forecast, by Application 2019 & 2032
- Table 42: Taiwan Methyl Isobutyl Ketone Industry Volume (K Tons) Forecast, by Application 2019 & 2032
- Table 43: Australia Methyl Isobutyl Ketone Industry Revenue (Million) Forecast, by Application 2019 & 2032
- Table 44: Australia Methyl Isobutyl Ketone Industry Volume (K Tons) Forecast, by Application 2019 & 2032
- Table 45: Rest of Asia-Pacific Methyl Isobutyl Ketone Industry Revenue (Million) Forecast, by Application 2019 & 2032
- Table 46: Rest of Asia-Pacific Methyl Isobutyl Ketone Industry Volume (K Tons) Forecast, by Application 2019 & 2032
- Table 47: Global Methyl Isobutyl Ketone Industry Revenue Million Forecast, by Country 2019 & 2032
- Table 48: Global Methyl Isobutyl Ketone Industry Volume K Tons Forecast, by Country 2019 & 2032
- Table 49: Brazil Methyl Isobutyl Ketone Industry Revenue (Million) Forecast, by Application 2019 & 2032
- Table 50: Brazil Methyl Isobutyl Ketone Industry Volume (K Tons) Forecast, by Application 2019 & 2032
- Table 51: Argentina Methyl Isobutyl Ketone Industry Revenue (Million) Forecast, by Application 2019 & 2032
- Table 52: Argentina Methyl Isobutyl Ketone Industry Volume (K Tons) Forecast, by Application 2019 & 2032
- Table 53: Rest of South America Methyl Isobutyl Ketone Industry Revenue (Million) Forecast, by Application 2019 & 2032
- Table 54: Rest of South America Methyl Isobutyl Ketone Industry Volume (K Tons) Forecast, by Application 2019 & 2032
- Table 55: Global Methyl Isobutyl Ketone Industry Revenue Million Forecast, by Country 2019 & 2032
- Table 56: Global Methyl Isobutyl Ketone Industry Volume K Tons Forecast, by Country 2019 & 2032
- Table 57: Middle East Methyl Isobutyl Ketone Industry Revenue (Million) Forecast, by Application 2019 & 2032
- Table 58: Middle East Methyl Isobutyl Ketone Industry Volume (K Tons) Forecast, by Application 2019 & 2032
- Table 59: Africa Methyl Isobutyl Ketone Industry Revenue (Million) Forecast, by Application 2019 & 2032
- Table 60: Africa Methyl Isobutyl Ketone Industry Volume (K Tons) Forecast, by Application 2019 & 2032
- Table 61: Global Methyl Isobutyl Ketone Industry Revenue Million Forecast, by Application 2019 & 2032
- Table 62: Global Methyl Isobutyl Ketone Industry Volume K Tons Forecast, by Application 2019 & 2032
- Table 63: Global Methyl Isobutyl Ketone Industry Revenue Million Forecast, by End-user Industry 2019 & 2032
- Table 64: Global Methyl Isobutyl Ketone Industry Volume K Tons Forecast, by End-user Industry 2019 & 2032
- Table 65: Global Methyl Isobutyl Ketone Industry Revenue Million Forecast, by Country 2019 & 2032
- Table 66: Global Methyl Isobutyl Ketone Industry Volume K Tons Forecast, by Country 2019 & 2032
- Table 67: China Methyl Isobutyl Ketone Industry Revenue (Million) Forecast, by Application 2019 & 2032
- Table 68: China Methyl Isobutyl Ketone Industry Volume (K Tons) Forecast, by Application 2019 & 2032
- Table 69: India Methyl Isobutyl Ketone Industry Revenue (Million) Forecast, by Application 2019 & 2032
- Table 70: India Methyl Isobutyl Ketone Industry Volume (K Tons) Forecast, by Application 2019 & 2032
- Table 71: Japan Methyl Isobutyl Ketone Industry Revenue (Million) Forecast, by Application 2019 & 2032
- Table 72: Japan Methyl Isobutyl Ketone Industry Volume (K Tons) Forecast, by Application 2019 & 2032
- Table 73: South Korea Methyl Isobutyl Ketone Industry Revenue (Million) Forecast, by Application 2019 & 2032
- Table 74: South Korea Methyl Isobutyl Ketone Industry Volume (K Tons) Forecast, by Application 2019 & 2032
- Table 75: Rest of Asia Pacific Methyl Isobutyl Ketone Industry Revenue (Million) Forecast, by Application 2019 & 2032
- Table 76: Rest of Asia Pacific Methyl Isobutyl Ketone Industry Volume (K Tons) Forecast, by Application 2019 & 2032
- Table 77: Global Methyl Isobutyl Ketone Industry Revenue Million Forecast, by Application 2019 & 2032
- Table 78: Global Methyl Isobutyl Ketone Industry Volume K Tons Forecast, by Application 2019 & 2032
- Table 79: Global Methyl Isobutyl Ketone Industry Revenue Million Forecast, by End-user Industry 2019 & 2032
- Table 80: Global Methyl Isobutyl Ketone Industry Volume K Tons Forecast, by End-user Industry 2019 & 2032
- Table 81: Global Methyl Isobutyl Ketone Industry Revenue Million Forecast, by Country 2019 & 2032
- Table 82: Global Methyl Isobutyl Ketone Industry Volume K Tons Forecast, by Country 2019 & 2032
- Table 83: United States Methyl Isobutyl Ketone Industry Revenue (Million) Forecast, by Application 2019 & 2032
- Table 84: United States Methyl Isobutyl Ketone Industry Volume (K Tons) Forecast, by Application 2019 & 2032
- Table 85: Canada Methyl Isobutyl Ketone Industry Revenue (Million) Forecast, by Application 2019 & 2032
- Table 86: Canada Methyl Isobutyl Ketone Industry Volume (K Tons) Forecast, by Application 2019 & 2032
- Table 87: Mexico Methyl Isobutyl Ketone Industry Revenue (Million) Forecast, by Application 2019 & 2032
- Table 88: Mexico Methyl Isobutyl Ketone Industry Volume (K Tons) Forecast, by Application 2019 & 2032
- Table 89: Global Methyl Isobutyl Ketone Industry Revenue Million Forecast, by Application 2019 & 2032
- Table 90: Global Methyl Isobutyl Ketone Industry Volume K Tons Forecast, by Application 2019 & 2032
- Table 91: Global Methyl Isobutyl Ketone Industry Revenue Million Forecast, by End-user Industry 2019 & 2032
- Table 92: Global Methyl Isobutyl Ketone Industry Volume K Tons Forecast, by End-user Industry 2019 & 2032
- Table 93: Global Methyl Isobutyl Ketone Industry Revenue Million Forecast, by Country 2019 & 2032
- Table 94: Global Methyl Isobutyl Ketone Industry Volume K Tons Forecast, by Country 2019 & 2032
- Table 95: Germany Methyl Isobutyl Ketone Industry Revenue (Million) Forecast, by Application 2019 & 2032
- Table 96: Germany Methyl Isobutyl Ketone Industry Volume (K Tons) Forecast, by Application 2019 & 2032
- Table 97: United Kingdom Methyl Isobutyl Ketone Industry Revenue (Million) Forecast, by Application 2019 & 2032
- Table 98: United Kingdom Methyl Isobutyl Ketone Industry Volume (K Tons) Forecast, by Application 2019 & 2032
- Table 99: Italy Methyl Isobutyl Ketone Industry Revenue (Million) Forecast, by Application 2019 & 2032
- Table 100: Italy Methyl Isobutyl Ketone Industry Volume (K Tons) Forecast, by Application 2019 & 2032
- Table 101: France Methyl Isobutyl Ketone Industry Revenue (Million) Forecast, by Application 2019 & 2032
- Table 102: France Methyl Isobutyl Ketone Industry Volume (K Tons) Forecast, by Application 2019 & 2032
- Table 103: Rest of Europe Methyl Isobutyl Ketone Industry Revenue (Million) Forecast, by Application 2019 & 2032
- Table 104: Rest of Europe Methyl Isobutyl Ketone Industry Volume (K Tons) Forecast, by Application 2019 & 2032
- Table 105: Global Methyl Isobutyl Ketone Industry Revenue Million Forecast, by Application 2019 & 2032
- Table 106: Global Methyl Isobutyl Ketone Industry Volume K Tons Forecast, by Application 2019 & 2032
- Table 107: Global Methyl Isobutyl Ketone Industry Revenue Million Forecast, by End-user Industry 2019 & 2032
- Table 108: Global Methyl Isobutyl Ketone Industry Volume K Tons Forecast, by End-user Industry 2019 & 2032
- Table 109: Global Methyl Isobutyl Ketone Industry Revenue Million Forecast, by Country 2019 & 2032
- Table 110: Global Methyl Isobutyl Ketone Industry Volume K Tons Forecast, by Country 2019 & 2032
- Table 111: Brazil Methyl Isobutyl Ketone Industry Revenue (Million) Forecast, by Application 2019 & 2032
- Table 112: Brazil Methyl Isobutyl Ketone Industry Volume (K Tons) Forecast, by Application 2019 & 2032
- Table 113: Argentina Methyl Isobutyl Ketone Industry Revenue (Million) Forecast, by Application 2019 & 2032
- Table 114: Argentina Methyl Isobutyl Ketone Industry Volume (K Tons) Forecast, by Application 2019 & 2032
- Table 115: Rest of South America Methyl Isobutyl Ketone Industry Revenue (Million) Forecast, by Application 2019 & 2032
- Table 116: Rest of South America Methyl Isobutyl Ketone Industry Volume (K Tons) Forecast, by Application 2019 & 2032
- Table 117: Global Methyl Isobutyl Ketone Industry Revenue Million Forecast, by Application 2019 & 2032
- Table 118: Global Methyl Isobutyl Ketone Industry Volume K Tons Forecast, by Application 2019 & 2032
- Table 119: Global Methyl Isobutyl Ketone Industry Revenue Million Forecast, by End-user Industry 2019 & 2032
- Table 120: Global Methyl Isobutyl Ketone Industry Volume K Tons Forecast, by End-user Industry 2019 & 2032
- Table 121: Global Methyl Isobutyl Ketone Industry Revenue Million Forecast, by Country 2019 & 2032
- Table 122: Global Methyl Isobutyl Ketone Industry Volume K Tons Forecast, by Country 2019 & 2032
- Table 123: Saudi Arabia Methyl Isobutyl Ketone Industry Revenue (Million) Forecast, by Application 2019 & 2032
- Table 124: Saudi Arabia Methyl Isobutyl Ketone Industry Volume (K Tons) Forecast, by Application 2019 & 2032
- Table 125: South Africa Methyl Isobutyl Ketone Industry Revenue (Million) Forecast, by Application 2019 & 2032
- Table 126: South Africa Methyl Isobutyl Ketone Industry Volume (K Tons) Forecast, by Application 2019 & 2032
- Table 127: Rest of Middle East and Africa Methyl Isobutyl Ketone Industry Revenue (Million) Forecast, by Application 2019 & 2032
- Table 128: Rest of Middle East and Africa Methyl Isobutyl Ketone Industry Volume (K Tons) Forecast, by Application 2019 & 2032
Frequently Asked Questions
1. What is the projected Compound Annual Growth Rate (CAGR) of the Methyl Isobutyl Ketone Industry?
The projected CAGR is approximately 3.82%.
2. Which companies are prominent players in the Methyl Isobutyl Ketone Industry?
Key companies in the market include Celanese Corp, Shell plc, Mitsui Chemicals Inc, Solvay, Jinzhou Liulu, KH Neochem, Sigma-Aldrich, Arkema Group, Monument Chemical, Sasol, Dow, Carboclor, Zhongneng Petrochemical, KUMHO P&B CHEMICALS INC.
3. What are the main segments of the Methyl Isobutyl Ketone Industry?
The market segments include Application, End-user Industry.
4. Can you provide details about the market size?
The market size is estimated to be USD XX Million as of 2022.
5. What are some drivers contributing to market growth?
Increasing Demand for MIBK in the Synthesis of Anti-ozonant Additive for Rubber; Increasing Demand for Solvents for Rubber Processing Chemicals in Asia; Increasing Demand for Surface Coatings.
6. What are the notable trends driving market growth?
Increasing Demand from Paints and Coatings Industry.
7. Are there any restraints impacting market growth?
Increasing Awareness About Toxic Effects of MIBK on Environment; Other Restraints.
8. Can you provide examples of recent developments in the market?
N/A
9. What pricing options are available for accessing the report?
Pricing options include single-user, multi-user, and enterprise licenses priced at USD 4750, USD 5250, and USD 8750 respectively.
10. Is the market size provided in terms of value or volume?
The market size is provided in terms of value, measured in Million and volume, measured in K Tons.
11. Are there any specific market keywords associated with the report?
Yes, the market keyword associated with the report is "Methyl Isobutyl Ketone Industry," which aids in identifying and referencing the specific market segment covered.
12. How do I determine which pricing option suits my needs best?
The pricing options vary based on user requirements and access needs. Individual users may opt for single-user licenses, while businesses requiring broader access may choose multi-user or enterprise licenses for cost-effective access to the report.
13. Are there any additional resources or data provided in the Methyl Isobutyl Ketone Industry report?
While the report offers comprehensive insights, it's advisable to review the specific contents or supplementary materials provided to ascertain if additional resources or data are available.
14. How can I stay updated on further developments or reports in the Methyl Isobutyl Ketone Industry?
To stay informed about further developments, trends, and reports in the Methyl Isobutyl Ketone Industry, consider subscribing to industry newsletters, following relevant companies and organizations, or regularly checking reputable industry news sources and publications.
Methodology
Step 1 - Identification of Relevant Samples Size from Population Database


Step 2 - Approaches for Defining Global Market Size (Value, Volume* & Price*)

Note*: In applicable scenarios
Step 3 - Data Sources
Primary Research
- Web Analytics
- Survey Reports
- Research Institute
- Latest Research Reports
- Opinion Leaders
Secondary Research
- Annual Reports
- White Paper
- Latest Press Release
- Industry Association
- Paid Database
- Investor Presentations

Step 4 - Data Triangulation
Involves using different sources of information in order to increase the validity of a study
These sources are likely to be stakeholders in a program - participants, other researchers, program staff, other community members, and so on.
Then we put all data in single framework & apply various statistical tools to find out the dynamic on the market.
During the analysis stage, feedback from the stakeholder groups would be compared to determine areas of agreement as well as areas of divergence


