
Key Insights
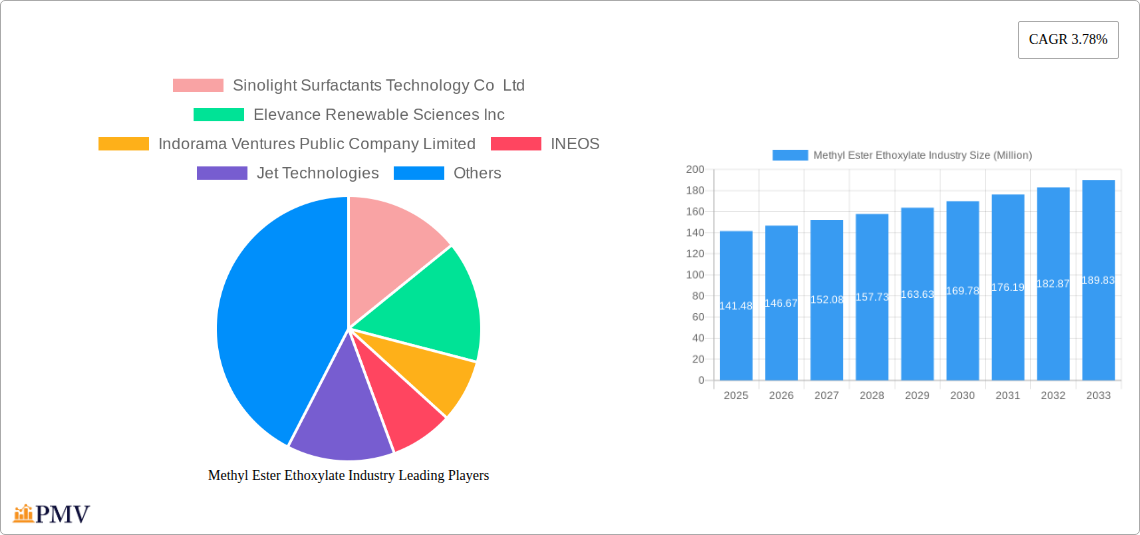
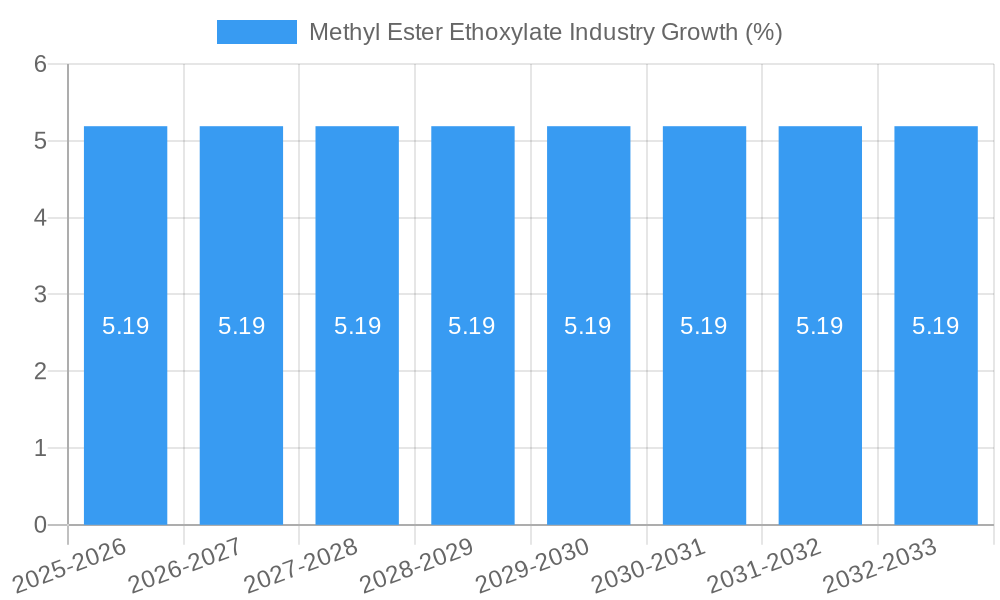
The Methyl Ester Ethoxylate (MEE) market, valued at $141.48 million in 2025, is projected to experience steady growth, exhibiting a Compound Annual Growth Rate (CAGR) of 3.78% from 2025 to 2033. This growth is driven by the increasing demand for MEE in various applications, including detergents, emulsifiers, and lubricants. The rising adoption of sustainable and biodegradable surfactants across industries, particularly in personal care and cleaning products, further fuels market expansion. Innovation in MEE production methods, focusing on enhanced efficiency and reduced environmental impact, is also contributing to this positive outlook. However, potential price fluctuations in raw materials and stringent regulatory requirements regarding the use of certain chemicals could act as restraints. Key players like Sinolight Surfactants Technology Co Ltd, Elevance Renewable Sciences Inc, and Indorama Ventures are actively shaping the market landscape through product diversification and strategic partnerships. The market is segmented based on application (e.g., detergents, textiles, etc.) and geographic regions, with regional variations influenced by factors like industrial development and environmental regulations. Competition is expected to intensify as companies focus on improving product performance and expanding their geographical reach.
The forecast period (2025-2033) anticipates consistent growth driven by continuous innovation and increasing consumer preference for eco-friendly products. This includes the development of bio-based MEEs which offer superior biodegradability compared to traditional petroleum-based alternatives. While the industry faces challenges related to raw material costs and regulations, the long-term outlook remains positive due to the inherent advantages of MEE in various applications and growing sustainability concerns within multiple sectors. Further market segmentation analysis based on application-specific needs and geographical market penetration will provide more granular insights into future opportunities.
Methyl Ester Ethoxylate Industry Market Report: 2019-2033
This comprehensive report provides an in-depth analysis of the Methyl Ester Ethoxylate industry, offering invaluable insights for businesses, investors, and stakeholders seeking to navigate this dynamic market. Covering the period from 2019 to 2033, with a base year of 2025 and a forecast period spanning 2025-2033, this report delivers a detailed understanding of market trends, competitive landscapes, and future growth potential. The report is structured to provide actionable intelligence, utilizing quantitative data and qualitative analysis to unlock strategic opportunities. The total market size in 2025 is estimated at xx Million.
Methyl Ester Ethoxylate Industry Market Structure & Competitive Dynamics
The Methyl Ester Ethoxylate market exhibits a moderately concentrated structure, with several key players holding significant market share. The industry is characterized by a dynamic interplay of innovation, regulatory pressures, and evolving end-user demands. Companies are actively engaged in R&D to enhance product performance and expand applications. Regulatory frameworks, particularly concerning environmental sustainability and product safety, significantly influence market dynamics. The presence of substitute products, such as other non-ionic surfactants, exerts competitive pressure.
- Market Concentration: The top five players account for approximately xx% of the global market share in 2025.
- Innovation Ecosystems: Collaborative partnerships and strategic alliances are prevalent, driving innovation in product formulations and manufacturing processes.
- Regulatory Frameworks: Stringent environmental regulations, especially in developed markets, are prompting the adoption of more sustainable manufacturing practices.
- Product Substitutes: The availability of alternative surfactants influences pricing and market share dynamics.
- End-User Trends: Growing demand from key sectors such as detergents, cosmetics, and textiles fuels market growth.
- M&A Activities: The acquisition of Oxiteno SA Indústria e Comércio by Indorama Ventures Public Company Limited in April 2022 exemplifies the strategic consolidation within the industry. The deal value was xx Million, highlighting the significant investment in market expansion.
Methyl Ester Ethoxylate Industry Industry Trends & Insights
The Methyl Ester Ethoxylate market is experiencing robust growth, driven by increasing demand across various end-use sectors. The market's Compound Annual Growth Rate (CAGR) during the forecast period (2025-2033) is projected to be xx%. Technological advancements, particularly in bio-based raw materials and sustainable manufacturing processes, are reshaping the industry landscape. Consumer preferences are shifting towards environmentally friendly and biodegradable products, impacting product development and marketing strategies. Intense competition necessitates continuous innovation and strategic partnerships to maintain market share and profitability. Market penetration is currently at xx% and is expected to increase to xx% by 2033.
Dominant Markets & Segments in Methyl Ester Ethoxylate Industry
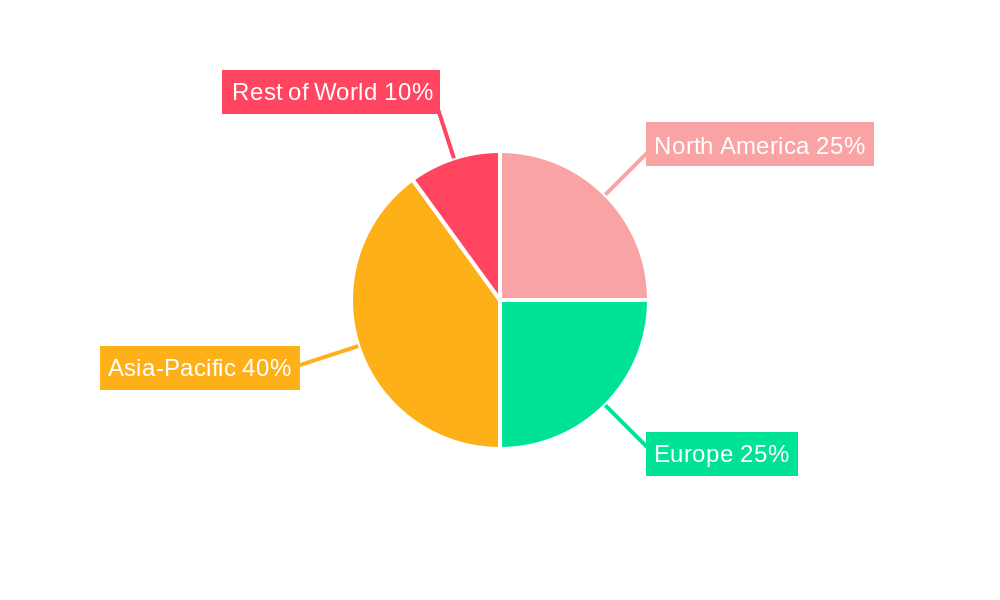
The Asia-Pacific region is currently the dominant market for Methyl Ester Ethoxylates, fueled by rapid economic growth and expanding industrialization. China, in particular, is a major consumer, owing to its substantial textile and detergent industries.
- Key Drivers in Asia-Pacific:
- Rapid industrialization and urbanization.
- Growth in the detergent and textile sectors.
- Favorable government policies supporting industrial development.
- Increasing disposable incomes and changing consumer preferences.
The dominance of the Asia-Pacific region stems from a confluence of factors. The region's burgeoning economies, particularly in countries like China and India, are driving demand for various consumer goods, thus increasing the consumption of Methyl Ester Ethoxylates in numerous applications. Furthermore, supportive government policies and robust infrastructure contribute to the region's prominent position in the global market.
Methyl Ester Ethoxylate Industry Product Innovations
Recent innovations focus on developing bio-based Methyl Ester Ethoxylates derived from renewable resources to meet the growing demand for sustainable products. These bio-based alternatives offer comparable performance to conventional products while reducing environmental impact. Furthermore, advancements in manufacturing processes are improving efficiency and reducing production costs. These innovations are enabling manufacturers to expand into new applications and cater to a wider range of customer needs.
Report Segmentation & Scope
This report segments the Methyl Ester Ethoxylate market based on several factors, including product type (e.g., different ethoxylation degrees), application (e.g., detergents, cosmetics), and geographic region (e.g., North America, Europe, Asia-Pacific). Each segment’s market size, growth projections, and competitive dynamics are analyzed in detail, providing a comprehensive understanding of the market structure. Each segment displays distinct growth rates, driven by varying industry demands and regional factors.
Key Drivers of Methyl Ester Ethoxylate Industry Growth
Several factors propel the growth of the Methyl Ester Ethoxylate industry. These include rising demand from end-use sectors like detergents and personal care products, increasing focus on eco-friendly and sustainable solutions, technological advancements in manufacturing and formulation, and favorable government policies supporting the chemical industry in key regions. The expansion of the textile and construction industries is also a significant driver.
Challenges in the Methyl Ester Ethoxylate Industry Sector
The Methyl Ester Ethoxylate industry faces several challenges, including fluctuating raw material prices, stringent environmental regulations, and intense competition. Supply chain disruptions and the volatility of the global economy impact profitability and market stability. The increasing regulatory scrutiny necessitates substantial investments in compliance, potentially affecting margins.
Leading Players in the Methyl Ester Ethoxylate Industry Market
- Sinolight Surfactants Technology Co Ltd
- Elevance Renewable Sciences Inc
- Indorama Ventures Public Company Limited
- INEOS
- Jet Technologies
- KLK OLEO
- Lion Specialty Chemicals Co Ltd
- Nanjing Chemical Material Corp
- Sino-Japan Chemical Co Ltd
- Venus Ethoxyethers Pvt Ltd
*List Not Exhaustive
Key Developments in Methyl Ester Ethoxylate Industry Sector
- April 2022: Indorama Ventures Public Company Limited (IVL) completed its acquisition of 100% of Brazil-based Oxiteno SA Indústria e Comércio, a leading global supplier of high-value surfactants. This acquisition significantly expands IVL's market reach and product portfolio, strengthening its position in the global Methyl Ester Ethoxylate market.
Strategic Methyl Ester Ethoxylate Industry Market Outlook
The Methyl Ester Ethoxylate market presents substantial growth opportunities, particularly in emerging economies and within the sustainable product segment. Focus on developing bio-based and eco-friendly alternatives, strategic partnerships to access new technologies and markets, and investments in efficient manufacturing processes will be critical for success. The increasing demand for sustainable products creates a significant avenue for growth and innovation within the industry.
Methyl Ester Ethoxylate Industry Segmentation
-
1. Application
- 1.1. Detergents and Industrial Cleaning Agents
- 1.2. Personal Care and Cosmetics
- 1.3. Other Applications
Methyl Ester Ethoxylate Industry Segmentation By Geography
-
1. Asia Pacific
- 1.1. China
- 1.2. India
- 1.3. Japan
- 1.4. South Korea
- 1.5. Rest of Asia Pacific
-
2. North America
- 2.1. United States
- 2.2. Canada
- 2.3. Mexico
-
3. Europe
- 3.1. Germany
- 3.2. United Kingdom
- 3.3. France
- 3.4. Italy
- 3.5. Rest of Europe
-
4. South America
- 4.1. Brazil
- 4.2. Argentina
- 4.3. Rest of South America
-
5. Middle East and Africa
- 5.1. Saudi Arabia
- 5.2. South Africa
- 5.3. Rest of Middle East and Africa
Methyl Ester Ethoxylate Industry REPORT HIGHLIGHTS
| Aspects | Details |
|---|---|
| Study Period | 2019-2033 |
| Base Year | 2024 |
| Estimated Year | 2025 |
| Forecast Period | 2025-2033 |
| Historical Period | 2019-2024 |
| Growth Rate | CAGR of 3.78% from 2019-2033 |
| Segmentation |
|
Table of Contents
- 1. Introduction
- 1.1. Research Scope
- 1.2. Market Segmentation
- 1.3. Research Methodology
- 1.4. Definitions and Assumptions
- 2. Executive Summary
- 2.1. Introduction
- 3. Market Dynamics
- 3.1. Introduction
- 3.2. Market Drivers
- 3.2.1 Surging Demand from Personal Care and Cosmetics; Growing Awareness Regarding Low Foam
- 3.2.2 Low Rinse
- 3.2.3 and Single Wash Detergents
- 3.3. Market Restrains
- 3.3.1 Surging Demand from Personal Care and Cosmetics; Growing Awareness Regarding Low Foam
- 3.3.2 Low Rinse
- 3.3.3 and Single Wash Detergents
- 3.4. Market Trends
- 3.4.1. Growing Demand from Detergents and Industrial Cleaning Agents
- 4. Market Factor Analysis
- 4.1. Porters Five Forces
- 4.2. Supply/Value Chain
- 4.3. PESTEL analysis
- 4.4. Market Entropy
- 4.5. Patent/Trademark Analysis
- 5. Global Methyl Ester Ethoxylate Industry Analysis, Insights and Forecast, 2019-2031
- 5.1. Market Analysis, Insights and Forecast - by Application
- 5.1.1. Detergents and Industrial Cleaning Agents
- 5.1.2. Personal Care and Cosmetics
- 5.1.3. Other Applications
- 5.2. Market Analysis, Insights and Forecast - by Region
- 5.2.1. Asia Pacific
- 5.2.2. North America
- 5.2.3. Europe
- 5.2.4. South America
- 5.2.5. Middle East and Africa
- 5.1. Market Analysis, Insights and Forecast - by Application
- 6. Asia Pacific Methyl Ester Ethoxylate Industry Analysis, Insights and Forecast, 2019-2031
- 6.1. Market Analysis, Insights and Forecast - by Application
- 6.1.1. Detergents and Industrial Cleaning Agents
- 6.1.2. Personal Care and Cosmetics
- 6.1.3. Other Applications
- 6.1. Market Analysis, Insights and Forecast - by Application
- 7. North America Methyl Ester Ethoxylate Industry Analysis, Insights and Forecast, 2019-2031
- 7.1. Market Analysis, Insights and Forecast - by Application
- 7.1.1. Detergents and Industrial Cleaning Agents
- 7.1.2. Personal Care and Cosmetics
- 7.1.3. Other Applications
- 7.1. Market Analysis, Insights and Forecast - by Application
- 8. Europe Methyl Ester Ethoxylate Industry Analysis, Insights and Forecast, 2019-2031
- 8.1. Market Analysis, Insights and Forecast - by Application
- 8.1.1. Detergents and Industrial Cleaning Agents
- 8.1.2. Personal Care and Cosmetics
- 8.1.3. Other Applications
- 8.1. Market Analysis, Insights and Forecast - by Application
- 9. South America Methyl Ester Ethoxylate Industry Analysis, Insights and Forecast, 2019-2031
- 9.1. Market Analysis, Insights and Forecast - by Application
- 9.1.1. Detergents and Industrial Cleaning Agents
- 9.1.2. Personal Care and Cosmetics
- 9.1.3. Other Applications
- 9.1. Market Analysis, Insights and Forecast - by Application
- 10. Middle East and Africa Methyl Ester Ethoxylate Industry Analysis, Insights and Forecast, 2019-2031
- 10.1. Market Analysis, Insights and Forecast - by Application
- 10.1.1. Detergents and Industrial Cleaning Agents
- 10.1.2. Personal Care and Cosmetics
- 10.1.3. Other Applications
- 10.1. Market Analysis, Insights and Forecast - by Application
- 11. Competitive Analysis
- 11.1. Global Market Share Analysis 2024
- 11.2. Company Profiles
- 11.2.1 Sinolight Surfactants Technology Co Ltd
- 11.2.1.1. Overview
- 11.2.1.2. Products
- 11.2.1.3. SWOT Analysis
- 11.2.1.4. Recent Developments
- 11.2.1.5. Financials (Based on Availability)
- 11.2.2 Elevance Renewable Sciences Inc
- 11.2.2.1. Overview
- 11.2.2.2. Products
- 11.2.2.3. SWOT Analysis
- 11.2.2.4. Recent Developments
- 11.2.2.5. Financials (Based on Availability)
- 11.2.3 Indorama Ventures Public Company Limited
- 11.2.3.1. Overview
- 11.2.3.2. Products
- 11.2.3.3. SWOT Analysis
- 11.2.3.4. Recent Developments
- 11.2.3.5. Financials (Based on Availability)
- 11.2.4 INEOS
- 11.2.4.1. Overview
- 11.2.4.2. Products
- 11.2.4.3. SWOT Analysis
- 11.2.4.4. Recent Developments
- 11.2.4.5. Financials (Based on Availability)
- 11.2.5 Jet Technologies
- 11.2.5.1. Overview
- 11.2.5.2. Products
- 11.2.5.3. SWOT Analysis
- 11.2.5.4. Recent Developments
- 11.2.5.5. Financials (Based on Availability)
- 11.2.6 KLK OLEO
- 11.2.6.1. Overview
- 11.2.6.2. Products
- 11.2.6.3. SWOT Analysis
- 11.2.6.4. Recent Developments
- 11.2.6.5. Financials (Based on Availability)
- 11.2.7 Lion Specialty Chemicals Co Ltd
- 11.2.7.1. Overview
- 11.2.7.2. Products
- 11.2.7.3. SWOT Analysis
- 11.2.7.4. Recent Developments
- 11.2.7.5. Financials (Based on Availability)
- 11.2.8 Nanjing Chemical Material Corp
- 11.2.8.1. Overview
- 11.2.8.2. Products
- 11.2.8.3. SWOT Analysis
- 11.2.8.4. Recent Developments
- 11.2.8.5. Financials (Based on Availability)
- 11.2.9 Sino-Japan Chemical Co Ltd
- 11.2.9.1. Overview
- 11.2.9.2. Products
- 11.2.9.3. SWOT Analysis
- 11.2.9.4. Recent Developments
- 11.2.9.5. Financials (Based on Availability)
- 11.2.10 Venus Ethoxyethers Pvt Ltd*List Not Exhaustive
- 11.2.10.1. Overview
- 11.2.10.2. Products
- 11.2.10.3. SWOT Analysis
- 11.2.10.4. Recent Developments
- 11.2.10.5. Financials (Based on Availability)
- 11.2.1 Sinolight Surfactants Technology Co Ltd
List of Figures
- Figure 1: Global Methyl Ester Ethoxylate Industry Revenue Breakdown (Million, %) by Region 2024 & 2032
- Figure 2: Global Methyl Ester Ethoxylate Industry Volume Breakdown (Million, %) by Region 2024 & 2032
- Figure 3: Asia Pacific Methyl Ester Ethoxylate Industry Revenue (Million), by Application 2024 & 2032
- Figure 4: Asia Pacific Methyl Ester Ethoxylate Industry Volume (Million), by Application 2024 & 2032
- Figure 5: Asia Pacific Methyl Ester Ethoxylate Industry Revenue Share (%), by Application 2024 & 2032
- Figure 6: Asia Pacific Methyl Ester Ethoxylate Industry Volume Share (%), by Application 2024 & 2032
- Figure 7: Asia Pacific Methyl Ester Ethoxylate Industry Revenue (Million), by Country 2024 & 2032
- Figure 8: Asia Pacific Methyl Ester Ethoxylate Industry Volume (Million), by Country 2024 & 2032
- Figure 9: Asia Pacific Methyl Ester Ethoxylate Industry Revenue Share (%), by Country 2024 & 2032
- Figure 10: Asia Pacific Methyl Ester Ethoxylate Industry Volume Share (%), by Country 2024 & 2032
- Figure 11: North America Methyl Ester Ethoxylate Industry Revenue (Million), by Application 2024 & 2032
- Figure 12: North America Methyl Ester Ethoxylate Industry Volume (Million), by Application 2024 & 2032
- Figure 13: North America Methyl Ester Ethoxylate Industry Revenue Share (%), by Application 2024 & 2032
- Figure 14: North America Methyl Ester Ethoxylate Industry Volume Share (%), by Application 2024 & 2032
- Figure 15: North America Methyl Ester Ethoxylate Industry Revenue (Million), by Country 2024 & 2032
- Figure 16: North America Methyl Ester Ethoxylate Industry Volume (Million), by Country 2024 & 2032
- Figure 17: North America Methyl Ester Ethoxylate Industry Revenue Share (%), by Country 2024 & 2032
- Figure 18: North America Methyl Ester Ethoxylate Industry Volume Share (%), by Country 2024 & 2032
- Figure 19: Europe Methyl Ester Ethoxylate Industry Revenue (Million), by Application 2024 & 2032
- Figure 20: Europe Methyl Ester Ethoxylate Industry Volume (Million), by Application 2024 & 2032
- Figure 21: Europe Methyl Ester Ethoxylate Industry Revenue Share (%), by Application 2024 & 2032
- Figure 22: Europe Methyl Ester Ethoxylate Industry Volume Share (%), by Application 2024 & 2032
- Figure 23: Europe Methyl Ester Ethoxylate Industry Revenue (Million), by Country 2024 & 2032
- Figure 24: Europe Methyl Ester Ethoxylate Industry Volume (Million), by Country 2024 & 2032
- Figure 25: Europe Methyl Ester Ethoxylate Industry Revenue Share (%), by Country 2024 & 2032
- Figure 26: Europe Methyl Ester Ethoxylate Industry Volume Share (%), by Country 2024 & 2032
- Figure 27: South America Methyl Ester Ethoxylate Industry Revenue (Million), by Application 2024 & 2032
- Figure 28: South America Methyl Ester Ethoxylate Industry Volume (Million), by Application 2024 & 2032
- Figure 29: South America Methyl Ester Ethoxylate Industry Revenue Share (%), by Application 2024 & 2032
- Figure 30: South America Methyl Ester Ethoxylate Industry Volume Share (%), by Application 2024 & 2032
- Figure 31: South America Methyl Ester Ethoxylate Industry Revenue (Million), by Country 2024 & 2032
- Figure 32: South America Methyl Ester Ethoxylate Industry Volume (Million), by Country 2024 & 2032
- Figure 33: South America Methyl Ester Ethoxylate Industry Revenue Share (%), by Country 2024 & 2032
- Figure 34: South America Methyl Ester Ethoxylate Industry Volume Share (%), by Country 2024 & 2032
- Figure 35: Middle East and Africa Methyl Ester Ethoxylate Industry Revenue (Million), by Application 2024 & 2032
- Figure 36: Middle East and Africa Methyl Ester Ethoxylate Industry Volume (Million), by Application 2024 & 2032
- Figure 37: Middle East and Africa Methyl Ester Ethoxylate Industry Revenue Share (%), by Application 2024 & 2032
- Figure 38: Middle East and Africa Methyl Ester Ethoxylate Industry Volume Share (%), by Application 2024 & 2032
- Figure 39: Middle East and Africa Methyl Ester Ethoxylate Industry Revenue (Million), by Country 2024 & 2032
- Figure 40: Middle East and Africa Methyl Ester Ethoxylate Industry Volume (Million), by Country 2024 & 2032
- Figure 41: Middle East and Africa Methyl Ester Ethoxylate Industry Revenue Share (%), by Country 2024 & 2032
- Figure 42: Middle East and Africa Methyl Ester Ethoxylate Industry Volume Share (%), by Country 2024 & 2032
List of Tables
- Table 1: Global Methyl Ester Ethoxylate Industry Revenue Million Forecast, by Region 2019 & 2032
- Table 2: Global Methyl Ester Ethoxylate Industry Volume Million Forecast, by Region 2019 & 2032
- Table 3: Global Methyl Ester Ethoxylate Industry Revenue Million Forecast, by Application 2019 & 2032
- Table 4: Global Methyl Ester Ethoxylate Industry Volume Million Forecast, by Application 2019 & 2032
- Table 5: Global Methyl Ester Ethoxylate Industry Revenue Million Forecast, by Region 2019 & 2032
- Table 6: Global Methyl Ester Ethoxylate Industry Volume Million Forecast, by Region 2019 & 2032
- Table 7: Global Methyl Ester Ethoxylate Industry Revenue Million Forecast, by Application 2019 & 2032
- Table 8: Global Methyl Ester Ethoxylate Industry Volume Million Forecast, by Application 2019 & 2032
- Table 9: Global Methyl Ester Ethoxylate Industry Revenue Million Forecast, by Country 2019 & 2032
- Table 10: Global Methyl Ester Ethoxylate Industry Volume Million Forecast, by Country 2019 & 2032
- Table 11: China Methyl Ester Ethoxylate Industry Revenue (Million) Forecast, by Application 2019 & 2032
- Table 12: China Methyl Ester Ethoxylate Industry Volume (Million) Forecast, by Application 2019 & 2032
- Table 13: India Methyl Ester Ethoxylate Industry Revenue (Million) Forecast, by Application 2019 & 2032
- Table 14: India Methyl Ester Ethoxylate Industry Volume (Million) Forecast, by Application 2019 & 2032
- Table 15: Japan Methyl Ester Ethoxylate Industry Revenue (Million) Forecast, by Application 2019 & 2032
- Table 16: Japan Methyl Ester Ethoxylate Industry Volume (Million) Forecast, by Application 2019 & 2032
- Table 17: South Korea Methyl Ester Ethoxylate Industry Revenue (Million) Forecast, by Application 2019 & 2032
- Table 18: South Korea Methyl Ester Ethoxylate Industry Volume (Million) Forecast, by Application 2019 & 2032
- Table 19: Rest of Asia Pacific Methyl Ester Ethoxylate Industry Revenue (Million) Forecast, by Application 2019 & 2032
- Table 20: Rest of Asia Pacific Methyl Ester Ethoxylate Industry Volume (Million) Forecast, by Application 2019 & 2032
- Table 21: Global Methyl Ester Ethoxylate Industry Revenue Million Forecast, by Application 2019 & 2032
- Table 22: Global Methyl Ester Ethoxylate Industry Volume Million Forecast, by Application 2019 & 2032
- Table 23: Global Methyl Ester Ethoxylate Industry Revenue Million Forecast, by Country 2019 & 2032
- Table 24: Global Methyl Ester Ethoxylate Industry Volume Million Forecast, by Country 2019 & 2032
- Table 25: United States Methyl Ester Ethoxylate Industry Revenue (Million) Forecast, by Application 2019 & 2032
- Table 26: United States Methyl Ester Ethoxylate Industry Volume (Million) Forecast, by Application 2019 & 2032
- Table 27: Canada Methyl Ester Ethoxylate Industry Revenue (Million) Forecast, by Application 2019 & 2032
- Table 28: Canada Methyl Ester Ethoxylate Industry Volume (Million) Forecast, by Application 2019 & 2032
- Table 29: Mexico Methyl Ester Ethoxylate Industry Revenue (Million) Forecast, by Application 2019 & 2032
- Table 30: Mexico Methyl Ester Ethoxylate Industry Volume (Million) Forecast, by Application 2019 & 2032
- Table 31: Global Methyl Ester Ethoxylate Industry Revenue Million Forecast, by Application 2019 & 2032
- Table 32: Global Methyl Ester Ethoxylate Industry Volume Million Forecast, by Application 2019 & 2032
- Table 33: Global Methyl Ester Ethoxylate Industry Revenue Million Forecast, by Country 2019 & 2032
- Table 34: Global Methyl Ester Ethoxylate Industry Volume Million Forecast, by Country 2019 & 2032
- Table 35: Germany Methyl Ester Ethoxylate Industry Revenue (Million) Forecast, by Application 2019 & 2032
- Table 36: Germany Methyl Ester Ethoxylate Industry Volume (Million) Forecast, by Application 2019 & 2032
- Table 37: United Kingdom Methyl Ester Ethoxylate Industry Revenue (Million) Forecast, by Application 2019 & 2032
- Table 38: United Kingdom Methyl Ester Ethoxylate Industry Volume (Million) Forecast, by Application 2019 & 2032
- Table 39: France Methyl Ester Ethoxylate Industry Revenue (Million) Forecast, by Application 2019 & 2032
- Table 40: France Methyl Ester Ethoxylate Industry Volume (Million) Forecast, by Application 2019 & 2032
- Table 41: Italy Methyl Ester Ethoxylate Industry Revenue (Million) Forecast, by Application 2019 & 2032
- Table 42: Italy Methyl Ester Ethoxylate Industry Volume (Million) Forecast, by Application 2019 & 2032
- Table 43: Rest of Europe Methyl Ester Ethoxylate Industry Revenue (Million) Forecast, by Application 2019 & 2032
- Table 44: Rest of Europe Methyl Ester Ethoxylate Industry Volume (Million) Forecast, by Application 2019 & 2032
- Table 45: Global Methyl Ester Ethoxylate Industry Revenue Million Forecast, by Application 2019 & 2032
- Table 46: Global Methyl Ester Ethoxylate Industry Volume Million Forecast, by Application 2019 & 2032
- Table 47: Global Methyl Ester Ethoxylate Industry Revenue Million Forecast, by Country 2019 & 2032
- Table 48: Global Methyl Ester Ethoxylate Industry Volume Million Forecast, by Country 2019 & 2032
- Table 49: Brazil Methyl Ester Ethoxylate Industry Revenue (Million) Forecast, by Application 2019 & 2032
- Table 50: Brazil Methyl Ester Ethoxylate Industry Volume (Million) Forecast, by Application 2019 & 2032
- Table 51: Argentina Methyl Ester Ethoxylate Industry Revenue (Million) Forecast, by Application 2019 & 2032
- Table 52: Argentina Methyl Ester Ethoxylate Industry Volume (Million) Forecast, by Application 2019 & 2032
- Table 53: Rest of South America Methyl Ester Ethoxylate Industry Revenue (Million) Forecast, by Application 2019 & 2032
- Table 54: Rest of South America Methyl Ester Ethoxylate Industry Volume (Million) Forecast, by Application 2019 & 2032
- Table 55: Global Methyl Ester Ethoxylate Industry Revenue Million Forecast, by Application 2019 & 2032
- Table 56: Global Methyl Ester Ethoxylate Industry Volume Million Forecast, by Application 2019 & 2032
- Table 57: Global Methyl Ester Ethoxylate Industry Revenue Million Forecast, by Country 2019 & 2032
- Table 58: Global Methyl Ester Ethoxylate Industry Volume Million Forecast, by Country 2019 & 2032
- Table 59: Saudi Arabia Methyl Ester Ethoxylate Industry Revenue (Million) Forecast, by Application 2019 & 2032
- Table 60: Saudi Arabia Methyl Ester Ethoxylate Industry Volume (Million) Forecast, by Application 2019 & 2032
- Table 61: South Africa Methyl Ester Ethoxylate Industry Revenue (Million) Forecast, by Application 2019 & 2032
- Table 62: South Africa Methyl Ester Ethoxylate Industry Volume (Million) Forecast, by Application 2019 & 2032
- Table 63: Rest of Middle East and Africa Methyl Ester Ethoxylate Industry Revenue (Million) Forecast, by Application 2019 & 2032
- Table 64: Rest of Middle East and Africa Methyl Ester Ethoxylate Industry Volume (Million) Forecast, by Application 2019 & 2032
Frequently Asked Questions
1. What is the projected Compound Annual Growth Rate (CAGR) of the Methyl Ester Ethoxylate Industry?
The projected CAGR is approximately 3.78%.
2. Which companies are prominent players in the Methyl Ester Ethoxylate Industry?
Key companies in the market include Sinolight Surfactants Technology Co Ltd, Elevance Renewable Sciences Inc, Indorama Ventures Public Company Limited, INEOS, Jet Technologies, KLK OLEO, Lion Specialty Chemicals Co Ltd, Nanjing Chemical Material Corp, Sino-Japan Chemical Co Ltd, Venus Ethoxyethers Pvt Ltd*List Not Exhaustive.
3. What are the main segments of the Methyl Ester Ethoxylate Industry?
The market segments include Application.
4. Can you provide details about the market size?
The market size is estimated to be USD 141.48 Million as of 2022.
5. What are some drivers contributing to market growth?
Surging Demand from Personal Care and Cosmetics; Growing Awareness Regarding Low Foam. Low Rinse. and Single Wash Detergents.
6. What are the notable trends driving market growth?
Growing Demand from Detergents and Industrial Cleaning Agents.
7. Are there any restraints impacting market growth?
Surging Demand from Personal Care and Cosmetics; Growing Awareness Regarding Low Foam. Low Rinse. and Single Wash Detergents.
8. Can you provide examples of recent developments in the market?
April 2022: Indorama Ventures Public Company Limited (IVL) completed its acquisition of 100% of Brazil-based Oxiteno SA Indústria e Comércio, a leading global supplier of high-value surfactants. Through the acquisition, IVL can extend its growth into highly attractive markets in Latin America and the United States, with additional potential to expand in Europe and Asia, which is expected to augment the growth of the market studied.
9. What pricing options are available for accessing the report?
Pricing options include single-user, multi-user, and enterprise licenses priced at USD 4750, USD 5250, and USD 8750 respectively.
10. Is the market size provided in terms of value or volume?
The market size is provided in terms of value, measured in Million and volume, measured in Million.
11. Are there any specific market keywords associated with the report?
Yes, the market keyword associated with the report is "Methyl Ester Ethoxylate Industry," which aids in identifying and referencing the specific market segment covered.
12. How do I determine which pricing option suits my needs best?
The pricing options vary based on user requirements and access needs. Individual users may opt for single-user licenses, while businesses requiring broader access may choose multi-user or enterprise licenses for cost-effective access to the report.
13. Are there any additional resources or data provided in the Methyl Ester Ethoxylate Industry report?
While the report offers comprehensive insights, it's advisable to review the specific contents or supplementary materials provided to ascertain if additional resources or data are available.
14. How can I stay updated on further developments or reports in the Methyl Ester Ethoxylate Industry?
To stay informed about further developments, trends, and reports in the Methyl Ester Ethoxylate Industry, consider subscribing to industry newsletters, following relevant companies and organizations, or regularly checking reputable industry news sources and publications.
Methodology
Step 1 - Identification of Relevant Samples Size from Population Database


Step 2 - Approaches for Defining Global Market Size (Value, Volume* & Price*)

Note*: In applicable scenarios
Step 3 - Data Sources
Primary Research
- Web Analytics
- Survey Reports
- Research Institute
- Latest Research Reports
- Opinion Leaders
Secondary Research
- Annual Reports
- White Paper
- Latest Press Release
- Industry Association
- Paid Database
- Investor Presentations

Step 4 - Data Triangulation
Involves using different sources of information in order to increase the validity of a study
These sources are likely to be stakeholders in a program - participants, other researchers, program staff, other community members, and so on.
Then we put all data in single framework & apply various statistical tools to find out the dynamic on the market.
During the analysis stage, feedback from the stakeholder groups would be compared to determine areas of agreement as well as areas of divergence


