
Key Insights
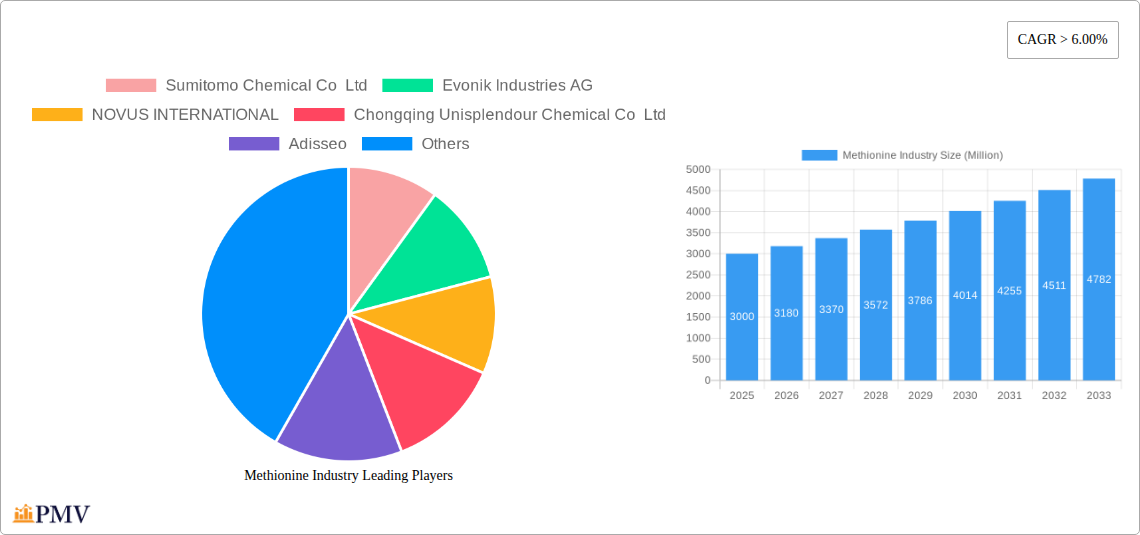
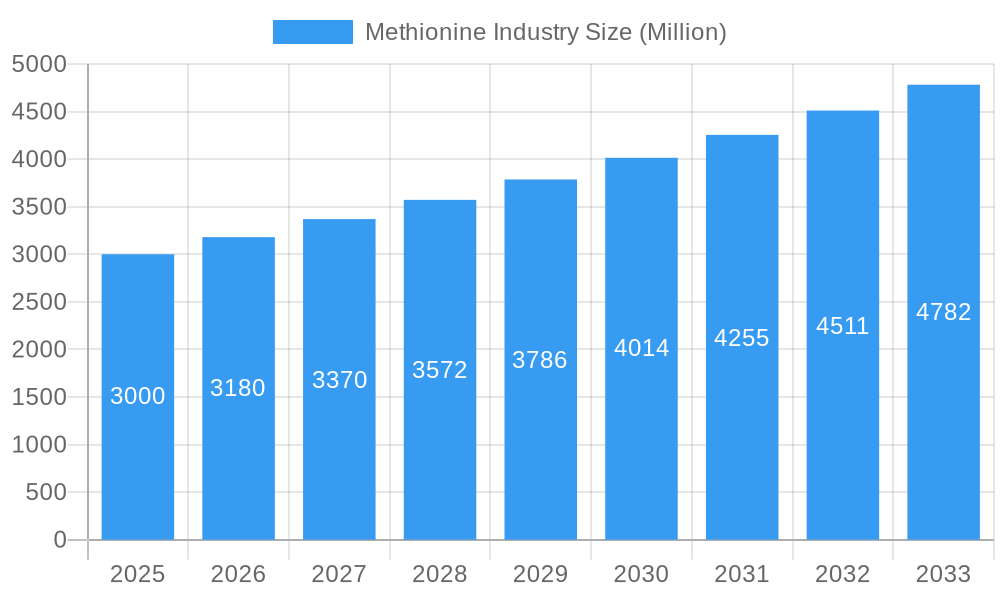
The global methionine market, valued at $6310 million in 2025, is projected to expand at a compound annual growth rate (CAGR) of 4.3% through 2033. This growth is propelled by escalating demand for animal feed, particularly in the Asia-Pacific region, driven by increasing global meat consumption and population expansion. The food and beverage sector also significantly contributes, employing methionine as a vital nutritional supplement and flavor enhancer. Additionally, its application in pharmaceutical formulations further strengthens market demand. While liquid methionine currently leads in market share due to ease of handling, the powder segment is anticipated to grow faster, benefiting from extended shelf life and cost-effectiveness for large-scale use. Key market players like Sumitomo Chemical, Evonik Industries, and Adisseo are actively pursuing market leadership through innovation, strategic alliances, and global expansion. Potential challenges include regulatory complexities and raw material price volatility, yet the market outlook remains favorable due to sustained growth in its core end-user industries.
Methionine Industry Market Size (In Billion)

The Asia-Pacific region, notably China and India, leads the methionine market, supported by extensive livestock industries and growing consumer demand for animal protein. North America and Europe are significant markets, characterized by mature animal feed sectors and rigorous food safety standards. South America and the Middle East & Africa demonstrate strong growth potential, fueled by expanding livestock farming and rising disposable incomes. A key market trend is innovation in methionine production technologies, emphasizing enhanced efficiency and sustainability, including the development of cost-effective manufacturing and environmentally friendly formulations. The industry is also focused on creating value-added products that incorporate methionine to meet evolving market needs and optimize feed efficiency. Companies are increasing their investment in research and development to elevate product quality and broaden their offerings.
Methionine Industry Company Market Share
Methionine Industry Market Report: 2019-2033
This comprehensive report provides a detailed analysis of the global methionine industry, covering market size, growth drivers, competitive landscape, and future outlook. With a study period spanning 2019-2033, a base year of 2025, and a forecast period of 2025-2033, this report offers actionable insights for industry stakeholders. The historical period analyzed is 2019-2024. Key market segments, including liquid and powder methionine, and end-user industries like food and beverage, pharmaceutical, and animal feed, are thoroughly examined. The report also features in-depth profiles of leading players such as Sumitomo Chemical Co Ltd, Evonik Industries AG, NOVUS INTERNATIONAL, Chongqing Unisplendour Chemical Co Ltd, Adisseo, Volzhsky Orgsynthese JSC, Zhejiang NHU Co Ltd, and CJ CheilJedang Corp.
Methionine Industry Market Structure & Competitive Dynamics
The global methionine market exhibits a moderately concentrated structure, with a few major players holding significant market share. Innovation within the industry is driven by ongoing research into production efficiency and the development of novel applications. Stringent regulatory frameworks related to food safety and environmental regulations significantly impact production and distribution. While there are limited direct substitutes for methionine, companies are exploring alternative amino acid sources to cater to specific dietary requirements. End-user trends, particularly in the animal feed sector, are shaping demand, with a focus on sustainable and efficient livestock farming. M&A activities have been relatively limited in recent years, with a few notable exceptions. For example, the xx Million acquisition of X company in 20xx significantly altered market share dynamics. Key metrics to watch include market concentration ratios (e.g., CR4, CR8) and the value of M&A deals, which is expected to reach xx Million by 2033. The average market share of the top five players is estimated to be around xx%.
Methionine Industry Industry Trends & Insights
The global methionine market is projected to witness a CAGR of xx% during the forecast period (2025-2033). Growth is primarily driven by the increasing demand for animal feed, particularly in developing economies with burgeoning livestock populations. Technological advancements in production processes, such as the implementation of more efficient fermentation techniques, are further enhancing market growth. Consumer preferences for healthier and more sustainable food products are also influencing the demand for methionine as a key ingredient in animal feed formulations. Intense competition among leading players is driving innovation, leading to the development of higher-quality and more cost-effective products. However, fluctuating raw material prices and environmental regulations represent key challenges. Market penetration of liquid methionine is expected to grow significantly due to logistical advantages and operational efficiency. This increase is anticipated to reach xx% by 2033.
Dominant Markets & Segments in Methionine Industry
The animal feed segment dominates the methionine market, driven by its critical role in animal nutrition and improved livestock productivity. China and other Asian countries are leading regional markets due to their rapidly expanding livestock industry and growing demand for protein-rich food sources.
- Key Drivers in Animal Feed Segment:
- Increasing demand for meat and poultry products.
- Growing adoption of efficient livestock farming practices.
- Expansion of organized poultry and livestock farming operations.
- Favorable government policies supporting the livestock sector.
The powder form of methionine currently holds a larger market share due to established distribution channels and easier handling compared to liquid. However, the liquid methionine segment is anticipated to witness significant growth in the coming years fueled by advancements in transportation, storage, and handling technology.
Key Drivers in Powder Methionine Segment:
- Established distribution networks and extensive market presence.
- Ease of handling and storage in various production settings.
Key Drivers in Liquid Methionine Segment:
- Improved logistics and transportation of large quantities.
- Superior operational efficiency in large scale operations.
The pharmaceutical sector also contributes significantly due to the use of methionine as a pharmaceutical ingredient and dietary supplement. The Food and Beverage sector's demand is driven by use as a nutritional additive. Growth in these sectors is projected to be xx% and xx% respectively by 2033. Robust economic growth and improved infrastructure in key regions have further supported industry expansion.
Methionine Industry Product Innovations
Recent product developments focus on improving the bioavailability and efficacy of methionine, with companies introducing new formulations and delivery systems. These innovations aim to enhance animal health, optimize feed conversion ratios, and ultimately reduce the overall cost of production. Technological advancements like precision fermentation and advanced analytics are also shaping the development of next-generation methionine products. The market fit for these innovations is strong, given the industry's ongoing focus on cost optimization and improved sustainability.
Report Segmentation & Scope
This report segments the methionine market based on end-user industry (Food and Beverage, Pharmaceutical, Animal Feed, Other End-user Industries) and product type (Liquid, Powder). The Animal Feed segment is projected to experience the highest growth rate, driven by the increasing demand for animal protein. The Powder segment currently holds a larger market share but the Liquid segment is expected to witness faster growth driven by emerging logistical and operational efficiencies. Each segment is analyzed with respect to market size, growth projections, and competitive dynamics.
Key Drivers of Methionine Industry Growth
Key growth drivers include the expanding global population, increasing demand for animal protein, technological advancements in methionine production, and supportive government policies promoting livestock farming. Economic factors such as rising disposable incomes and increased purchasing power are also contributing to market growth. The adoption of new technologies resulting in improved production efficiencies and reduced manufacturing costs are also key drivers in overall growth.
Challenges in the Methionine Industry Sector
Major challenges include fluctuations in raw material prices, stringent environmental regulations, and intense competition among major players. Supply chain disruptions due to geopolitical events can also significantly impact production and distribution. The impact of these challenges is estimated to be a xx% decrease in overall industry profitability if left unaddressed.
Leading Players in the Methionine Industry Market
- Sumitomo Chemical Co Ltd
- Evonik Industries AG
- NOVUS INTERNATIONAL
- Chongqing Unisplendour Chemical Co Ltd
- Adisseo
- Volzhsky Orgsynthese JSC
- Zhejiang NHU Co Ltd
- CJ CheilJedang Corp
Key Developments in Methionine Industry Sector
- September 2022: Adisseo commissioned a new 180,000-ton liquid methionine production plant in Nanjing, China, doubling its global capacity to 350,000 tons. This significantly strengthened Adisseo's market position.
- March 2022: Evonik invested USD 176.5 Million in expanding its methyl mercaptan production facility in Theodore, Alabama, boosting its MetAmino (DL-methionine) production capacity and enhancing its competitiveness in the animal nutrition market.
Strategic Methionine Industry Market Outlook
The methionine market is poised for continued growth, driven by long-term trends in animal protein consumption and ongoing technological advancements. Strategic opportunities lie in expanding into emerging markets, developing innovative product formulations, and focusing on sustainable and environmentally friendly production processes. Companies that can successfully navigate regulatory hurdles and address supply chain challenges will be best positioned for long-term success. The market shows robust potential for growth, particularly in the emerging Asian markets and with increased demand for efficient livestock farming practices.
Methionine Industry Segmentation
-
1. Type
- 1.1. Liquid
- 1.2. Powder
-
2. End-user Industry
- 2.1. Food and Beverage
- 2.2. Pharmaceutical
- 2.3. Animal Feed
- 2.4. Other End-user Industries
Methionine Industry Segmentation By Geography
-
1. Asia Pacific
- 1.1. China
- 1.2. India
- 1.3. Japan
- 1.4. South Korea
- 1.5. Rest of Asia Pacific
-
2. North America
- 2.1. United States
- 2.2. Canada
- 2.3. Mexico
-
3. Europe
- 3.1. Germany
- 3.2. United Kingdom
- 3.3. Italy
- 3.4. France
- 3.5. Rest of Europe
-
4. South America
- 4.1. Brazil
- 4.2. Argentina
- 4.3. Rest of South America
-
5. Middle East and Africa
- 5.1. Saudi Arabia
- 5.2. South Africa
- 5.3. Rest of Middle East and Africa
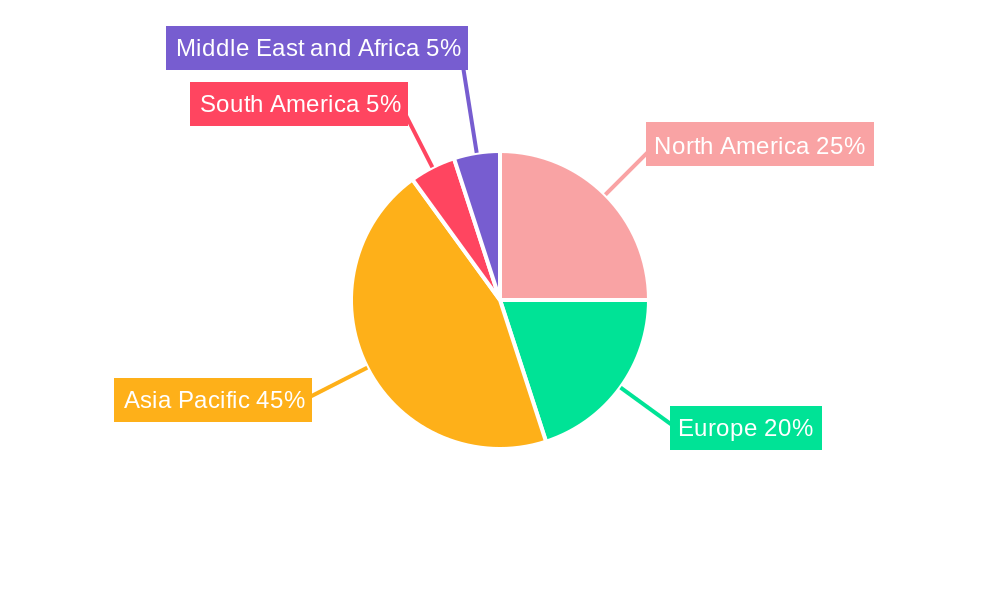
Methionine Industry Regional Market Share
Geographic Coverage of Methionine Industry
Methionine Industry REPORT HIGHLIGHTS
| Aspects | Details |
|---|---|
| Study Period | 2020-2034 |
| Base Year | 2025 |
| Estimated Year | 2026 |
| Forecast Period | 2026-2034 |
| Historical Period | 2020-2025 |
| Growth Rate | CAGR of 4.3% from 2020-2034 |
| Segmentation |
|
Table of Contents
- 1. Introduction
- 1.1. Research Scope
- 1.2. Market Segmentation
- 1.3. Research Methodology
- 1.4. Definitions and Assumptions
- 2. Executive Summary
- 2.1. Introduction
- 3. Market Dynamics
- 3.1. Introduction
- 3.2. Market Drivers
- 3.2.1. Growing Demand from the Poultry Industry; Emerging Demand from the Aquaculture Industry
- 3.3. Market Restrains
- 3.3.1. Complex Process of Manufacturing Methionine
- 3.4. Market Trends
- 3.4.1. Increasing Demand from the Animal Feed Segment
- 4. Market Factor Analysis
- 4.1. Porters Five Forces
- 4.2. Supply/Value Chain
- 4.3. PESTEL analysis
- 4.4. Market Entropy
- 4.5. Patent/Trademark Analysis
- 5. Global Methionine Industry Analysis, Insights and Forecast, 2020-2032
- 5.1. Market Analysis, Insights and Forecast - by Type
- 5.1.1. Liquid
- 5.1.2. Powder
- 5.2. Market Analysis, Insights and Forecast - by End-user Industry
- 5.2.1. Food and Beverage
- 5.2.2. Pharmaceutical
- 5.2.3. Animal Feed
- 5.2.4. Other End-user Industries
- 5.3. Market Analysis, Insights and Forecast - by Region
- 5.3.1. Asia Pacific
- 5.3.2. North America
- 5.3.3. Europe
- 5.3.4. South America
- 5.3.5. Middle East and Africa
- 5.1. Market Analysis, Insights and Forecast - by Type
- 6. Asia Pacific Methionine Industry Analysis, Insights and Forecast, 2020-2032
- 6.1. Market Analysis, Insights and Forecast - by Type
- 6.1.1. Liquid
- 6.1.2. Powder
- 6.2. Market Analysis, Insights and Forecast - by End-user Industry
- 6.2.1. Food and Beverage
- 6.2.2. Pharmaceutical
- 6.2.3. Animal Feed
- 6.2.4. Other End-user Industries
- 6.1. Market Analysis, Insights and Forecast - by Type
- 7. North America Methionine Industry Analysis, Insights and Forecast, 2020-2032
- 7.1. Market Analysis, Insights and Forecast - by Type
- 7.1.1. Liquid
- 7.1.2. Powder
- 7.2. Market Analysis, Insights and Forecast - by End-user Industry
- 7.2.1. Food and Beverage
- 7.2.2. Pharmaceutical
- 7.2.3. Animal Feed
- 7.2.4. Other End-user Industries
- 7.1. Market Analysis, Insights and Forecast - by Type
- 8. Europe Methionine Industry Analysis, Insights and Forecast, 2020-2032
- 8.1. Market Analysis, Insights and Forecast - by Type
- 8.1.1. Liquid
- 8.1.2. Powder
- 8.2. Market Analysis, Insights and Forecast - by End-user Industry
- 8.2.1. Food and Beverage
- 8.2.2. Pharmaceutical
- 8.2.3. Animal Feed
- 8.2.4. Other End-user Industries
- 8.1. Market Analysis, Insights and Forecast - by Type
- 9. South America Methionine Industry Analysis, Insights and Forecast, 2020-2032
- 9.1. Market Analysis, Insights and Forecast - by Type
- 9.1.1. Liquid
- 9.1.2. Powder
- 9.2. Market Analysis, Insights and Forecast - by End-user Industry
- 9.2.1. Food and Beverage
- 9.2.2. Pharmaceutical
- 9.2.3. Animal Feed
- 9.2.4. Other End-user Industries
- 9.1. Market Analysis, Insights and Forecast - by Type
- 10. Middle East and Africa Methionine Industry Analysis, Insights and Forecast, 2020-2032
- 10.1. Market Analysis, Insights and Forecast - by Type
- 10.1.1. Liquid
- 10.1.2. Powder
- 10.2. Market Analysis, Insights and Forecast - by End-user Industry
- 10.2.1. Food and Beverage
- 10.2.2. Pharmaceutical
- 10.2.3. Animal Feed
- 10.2.4. Other End-user Industries
- 10.1. Market Analysis, Insights and Forecast - by Type
- 11. Competitive Analysis
- 11.1. Global Market Share Analysis 2025
- 11.2. Company Profiles
- 11.2.1 Sumitomo Chemical Co Ltd
- 11.2.1.1. Overview
- 11.2.1.2. Products
- 11.2.1.3. SWOT Analysis
- 11.2.1.4. Recent Developments
- 11.2.1.5. Financials (Based on Availability)
- 11.2.2 Evonik Industries AG
- 11.2.2.1. Overview
- 11.2.2.2. Products
- 11.2.2.3. SWOT Analysis
- 11.2.2.4. Recent Developments
- 11.2.2.5. Financials (Based on Availability)
- 11.2.3 NOVUS INTERNATIONAL
- 11.2.3.1. Overview
- 11.2.3.2. Products
- 11.2.3.3. SWOT Analysis
- 11.2.3.4. Recent Developments
- 11.2.3.5. Financials (Based on Availability)
- 11.2.4 Chongqing Unisplendour Chemical Co Ltd
- 11.2.4.1. Overview
- 11.2.4.2. Products
- 11.2.4.3. SWOT Analysis
- 11.2.4.4. Recent Developments
- 11.2.4.5. Financials (Based on Availability)
- 11.2.5 Adisseo
- 11.2.5.1. Overview
- 11.2.5.2. Products
- 11.2.5.3. SWOT Analysis
- 11.2.5.4. Recent Developments
- 11.2.5.5. Financials (Based on Availability)
- 11.2.6 Volzhsky Orgsynthese JSC
- 11.2.6.1. Overview
- 11.2.6.2. Products
- 11.2.6.3. SWOT Analysis
- 11.2.6.4. Recent Developments
- 11.2.6.5. Financials (Based on Availability)
- 11.2.7 Zhejiang NHU Co Ltd*List Not Exhaustive
- 11.2.7.1. Overview
- 11.2.7.2. Products
- 11.2.7.3. SWOT Analysis
- 11.2.7.4. Recent Developments
- 11.2.7.5. Financials (Based on Availability)
- 11.2.8 CJ CheilJedang Corp
- 11.2.8.1. Overview
- 11.2.8.2. Products
- 11.2.8.3. SWOT Analysis
- 11.2.8.4. Recent Developments
- 11.2.8.5. Financials (Based on Availability)
- 11.2.1 Sumitomo Chemical Co Ltd
List of Figures
- Figure 1: Global Methionine Industry Revenue Breakdown (million, %) by Region 2025 & 2033
- Figure 2: Asia Pacific Methionine Industry Revenue (million), by Type 2025 & 2033
- Figure 3: Asia Pacific Methionine Industry Revenue Share (%), by Type 2025 & 2033
- Figure 4: Asia Pacific Methionine Industry Revenue (million), by End-user Industry 2025 & 2033
- Figure 5: Asia Pacific Methionine Industry Revenue Share (%), by End-user Industry 2025 & 2033
- Figure 6: Asia Pacific Methionine Industry Revenue (million), by Country 2025 & 2033
- Figure 7: Asia Pacific Methionine Industry Revenue Share (%), by Country 2025 & 2033
- Figure 8: North America Methionine Industry Revenue (million), by Type 2025 & 2033
- Figure 9: North America Methionine Industry Revenue Share (%), by Type 2025 & 2033
- Figure 10: North America Methionine Industry Revenue (million), by End-user Industry 2025 & 2033
- Figure 11: North America Methionine Industry Revenue Share (%), by End-user Industry 2025 & 2033
- Figure 12: North America Methionine Industry Revenue (million), by Country 2025 & 2033
- Figure 13: North America Methionine Industry Revenue Share (%), by Country 2025 & 2033
- Figure 14: Europe Methionine Industry Revenue (million), by Type 2025 & 2033
- Figure 15: Europe Methionine Industry Revenue Share (%), by Type 2025 & 2033
- Figure 16: Europe Methionine Industry Revenue (million), by End-user Industry 2025 & 2033
- Figure 17: Europe Methionine Industry Revenue Share (%), by End-user Industry 2025 & 2033
- Figure 18: Europe Methionine Industry Revenue (million), by Country 2025 & 2033
- Figure 19: Europe Methionine Industry Revenue Share (%), by Country 2025 & 2033
- Figure 20: South America Methionine Industry Revenue (million), by Type 2025 & 2033
- Figure 21: South America Methionine Industry Revenue Share (%), by Type 2025 & 2033
- Figure 22: South America Methionine Industry Revenue (million), by End-user Industry 2025 & 2033
- Figure 23: South America Methionine Industry Revenue Share (%), by End-user Industry 2025 & 2033
- Figure 24: South America Methionine Industry Revenue (million), by Country 2025 & 2033
- Figure 25: South America Methionine Industry Revenue Share (%), by Country 2025 & 2033
- Figure 26: Middle East and Africa Methionine Industry Revenue (million), by Type 2025 & 2033
- Figure 27: Middle East and Africa Methionine Industry Revenue Share (%), by Type 2025 & 2033
- Figure 28: Middle East and Africa Methionine Industry Revenue (million), by End-user Industry 2025 & 2033
- Figure 29: Middle East and Africa Methionine Industry Revenue Share (%), by End-user Industry 2025 & 2033
- Figure 30: Middle East and Africa Methionine Industry Revenue (million), by Country 2025 & 2033
- Figure 31: Middle East and Africa Methionine Industry Revenue Share (%), by Country 2025 & 2033
List of Tables
- Table 1: Global Methionine Industry Revenue million Forecast, by Type 2020 & 2033
- Table 2: Global Methionine Industry Revenue million Forecast, by End-user Industry 2020 & 2033
- Table 3: Global Methionine Industry Revenue million Forecast, by Region 2020 & 2033
- Table 4: Global Methionine Industry Revenue million Forecast, by Type 2020 & 2033
- Table 5: Global Methionine Industry Revenue million Forecast, by End-user Industry 2020 & 2033
- Table 6: Global Methionine Industry Revenue million Forecast, by Country 2020 & 2033
- Table 7: China Methionine Industry Revenue (million) Forecast, by Application 2020 & 2033
- Table 8: India Methionine Industry Revenue (million) Forecast, by Application 2020 & 2033
- Table 9: Japan Methionine Industry Revenue (million) Forecast, by Application 2020 & 2033
- Table 10: South Korea Methionine Industry Revenue (million) Forecast, by Application 2020 & 2033
- Table 11: Rest of Asia Pacific Methionine Industry Revenue (million) Forecast, by Application 2020 & 2033
- Table 12: Global Methionine Industry Revenue million Forecast, by Type 2020 & 2033
- Table 13: Global Methionine Industry Revenue million Forecast, by End-user Industry 2020 & 2033
- Table 14: Global Methionine Industry Revenue million Forecast, by Country 2020 & 2033
- Table 15: United States Methionine Industry Revenue (million) Forecast, by Application 2020 & 2033
- Table 16: Canada Methionine Industry Revenue (million) Forecast, by Application 2020 & 2033
- Table 17: Mexico Methionine Industry Revenue (million) Forecast, by Application 2020 & 2033
- Table 18: Global Methionine Industry Revenue million Forecast, by Type 2020 & 2033
- Table 19: Global Methionine Industry Revenue million Forecast, by End-user Industry 2020 & 2033
- Table 20: Global Methionine Industry Revenue million Forecast, by Country 2020 & 2033
- Table 21: Germany Methionine Industry Revenue (million) Forecast, by Application 2020 & 2033
- Table 22: United Kingdom Methionine Industry Revenue (million) Forecast, by Application 2020 & 2033
- Table 23: Italy Methionine Industry Revenue (million) Forecast, by Application 2020 & 2033
- Table 24: France Methionine Industry Revenue (million) Forecast, by Application 2020 & 2033
- Table 25: Rest of Europe Methionine Industry Revenue (million) Forecast, by Application 2020 & 2033
- Table 26: Global Methionine Industry Revenue million Forecast, by Type 2020 & 2033
- Table 27: Global Methionine Industry Revenue million Forecast, by End-user Industry 2020 & 2033
- Table 28: Global Methionine Industry Revenue million Forecast, by Country 2020 & 2033
- Table 29: Brazil Methionine Industry Revenue (million) Forecast, by Application 2020 & 2033
- Table 30: Argentina Methionine Industry Revenue (million) Forecast, by Application 2020 & 2033
- Table 31: Rest of South America Methionine Industry Revenue (million) Forecast, by Application 2020 & 2033
- Table 32: Global Methionine Industry Revenue million Forecast, by Type 2020 & 2033
- Table 33: Global Methionine Industry Revenue million Forecast, by End-user Industry 2020 & 2033
- Table 34: Global Methionine Industry Revenue million Forecast, by Country 2020 & 2033
- Table 35: Saudi Arabia Methionine Industry Revenue (million) Forecast, by Application 2020 & 2033
- Table 36: South Africa Methionine Industry Revenue (million) Forecast, by Application 2020 & 2033
- Table 37: Rest of Middle East and Africa Methionine Industry Revenue (million) Forecast, by Application 2020 & 2033
Frequently Asked Questions
1. What is the projected Compound Annual Growth Rate (CAGR) of the Methionine Industry?
The projected CAGR is approximately 4.3%.
2. Which companies are prominent players in the Methionine Industry?
Key companies in the market include Sumitomo Chemical Co Ltd, Evonik Industries AG, NOVUS INTERNATIONAL, Chongqing Unisplendour Chemical Co Ltd, Adisseo, Volzhsky Orgsynthese JSC, Zhejiang NHU Co Ltd*List Not Exhaustive, CJ CheilJedang Corp.
3. What are the main segments of the Methionine Industry?
The market segments include Type, End-user Industry.
4. Can you provide details about the market size?
The market size is estimated to be USD 6310 million as of 2022.
5. What are some drivers contributing to market growth?
Growing Demand from the Poultry Industry; Emerging Demand from the Aquaculture Industry.
6. What are the notable trends driving market growth?
Increasing Demand from the Animal Feed Segment.
7. Are there any restraints impacting market growth?
Complex Process of Manufacturing Methionine.
8. Can you provide examples of recent developments in the market?
September 2022: Adisseo started liquid methionine production through its 180,000-ton new plant in Nanjing, China. The company has doubled its methionine capacity to 350,000 tons through its operational new plant consolidating its leading position in the world.
9. What pricing options are available for accessing the report?
Pricing options include single-user, multi-user, and enterprise licenses priced at USD 4750, USD 5250, and USD 8750 respectively.
10. Is the market size provided in terms of value or volume?
The market size is provided in terms of value, measured in million.
11. Are there any specific market keywords associated with the report?
Yes, the market keyword associated with the report is "Methionine Industry," which aids in identifying and referencing the specific market segment covered.
12. How do I determine which pricing option suits my needs best?
The pricing options vary based on user requirements and access needs. Individual users may opt for single-user licenses, while businesses requiring broader access may choose multi-user or enterprise licenses for cost-effective access to the report.
13. Are there any additional resources or data provided in the Methionine Industry report?
While the report offers comprehensive insights, it's advisable to review the specific contents or supplementary materials provided to ascertain if additional resources or data are available.
14. How can I stay updated on further developments or reports in the Methionine Industry?
To stay informed about further developments, trends, and reports in the Methionine Industry, consider subscribing to industry newsletters, following relevant companies and organizations, or regularly checking reputable industry news sources and publications.
Methodology
Step 1 - Identification of Relevant Samples Size from Population Database


Step 2 - Approaches for Defining Global Market Size (Value, Volume* & Price*)

Note*: In applicable scenarios
Step 3 - Data Sources
Primary Research
- Web Analytics
- Survey Reports
- Research Institute
- Latest Research Reports
- Opinion Leaders
Secondary Research
- Annual Reports
- White Paper
- Latest Press Release
- Industry Association
- Paid Database
- Investor Presentations

Step 4 - Data Triangulation
Involves using different sources of information in order to increase the validity of a study
These sources are likely to be stakeholders in a program - participants, other researchers, program staff, other community members, and so on.
Then we put all data in single framework & apply various statistical tools to find out the dynamic on the market.
During the analysis stage, feedback from the stakeholder groups would be compared to determine areas of agreement as well as areas of divergence

