
Key Insights
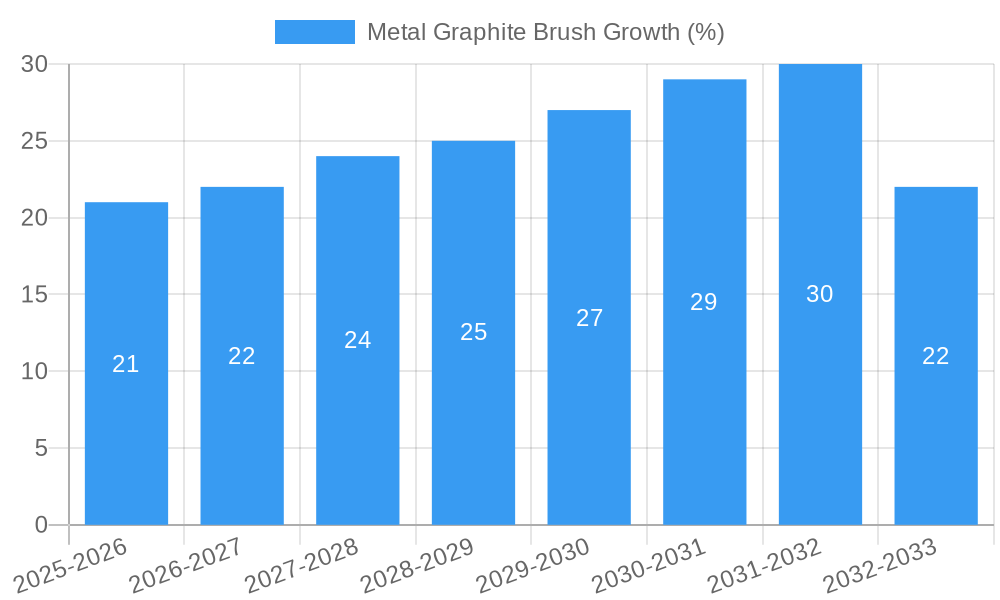
The global metal graphite brush market is experiencing robust growth, driven by the increasing demand for electric vehicles (EVs), industrial automation, and renewable energy technologies. These sectors rely heavily on electric motors and generators, which require high-performance metal graphite brushes for efficient and reliable operation. The market is characterized by a steady Compound Annual Growth Rate (CAGR), estimated at approximately 6% from 2025 to 2033, leading to significant market expansion over this forecast period. Key drivers include advancements in brush material technology resulting in increased durability and performance, along with the growing adoption of energy-efficient solutions across diverse industries. While rising raw material costs and potential supply chain disruptions present challenges, ongoing innovation and the sustained growth of key end-use sectors are expected to mitigate these constraints. The market is segmented by brush type (e.g., rectangular, circular), application (e.g., automotive, industrial motors), and geographical region. Leading companies like Sinotech, Mersen, Carbex, TOYO TANSO, Aupac, Ohio Carbon Industries (OCI), St. Marys Carbon, and Helwig Carbon Products are actively engaged in research and development, focusing on enhancing brush performance and expanding their market reach through strategic partnerships and acquisitions.
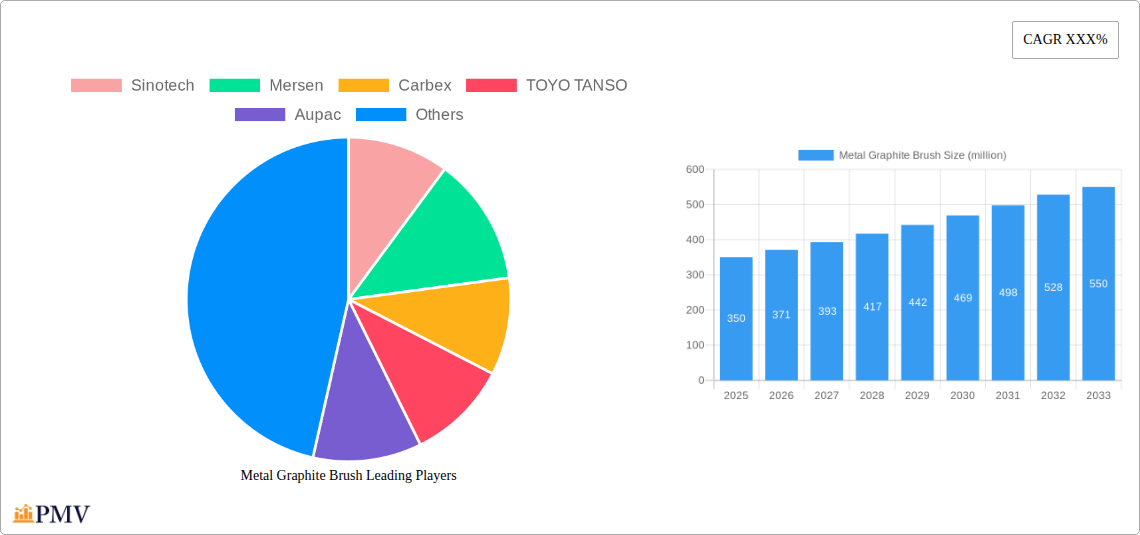
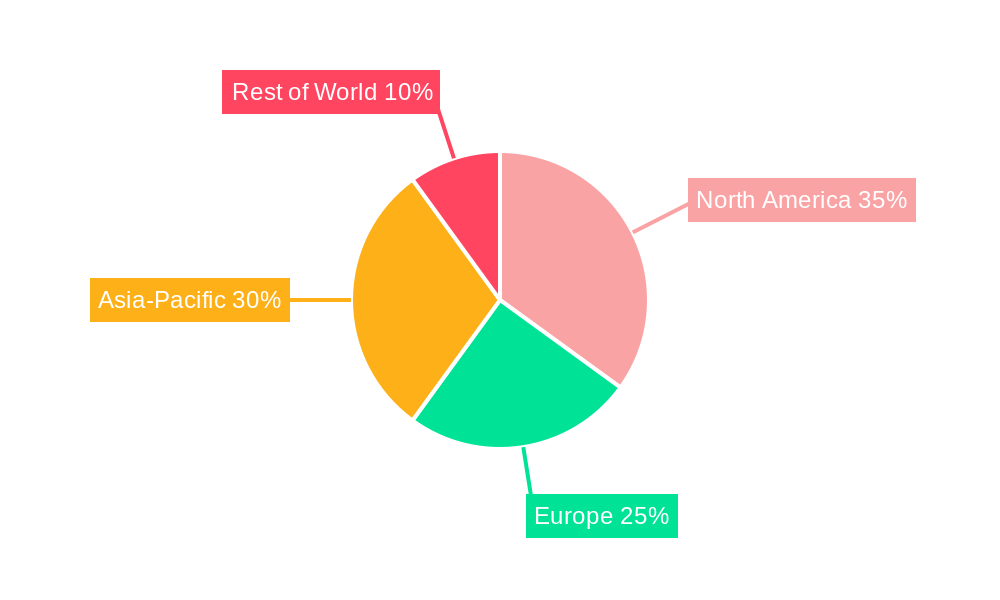
The competitive landscape is moderately consolidated, with several established players and emerging smaller companies vying for market share. The forecast period indicates a substantial increase in market value, reaching an estimated $550 million by 2033. Regional variations in market growth are expected, with North America and Asia-Pacific anticipated to dominate, driven by strong demand in the automotive and industrial sectors within those regions. Strategic investments in research and development, alongside collaborations within the supply chain, are likely to become increasingly significant for companies seeking to sustain growth and maintain a competitive edge within this expanding market. Market segmentation by application and geography will continue to evolve, influenced by government regulations related to environmental sustainability and shifts in industrial priorities globally.
Metal Graphite Brush Market Report: A Comprehensive Analysis (2019-2033)
This detailed report provides a comprehensive analysis of the global Metal Graphite Brush market, offering invaluable insights for industry stakeholders. The study period spans from 2019 to 2033, with 2025 serving as both the base and estimated year. The forecast period covers 2025-2033, while the historical period encompasses 2019-2024. This report projects a market size exceeding $XX million by 2033, presenting significant growth opportunities.
Metal Graphite Brush Market Structure & Competitive Dynamics
The global Metal Graphite Brush market exhibits a moderately consolidated structure, with several key players holding significant market share. Sinotech, Mersen, Carbex, TOYO TANSO, Aupac, Ohio Carbon Industries (OCI), St. Marys Carbon, and Helwig Carbon Products are major players, collectively accounting for approximately 60% of the global market share in 2025. Market concentration is influenced by factors such as economies of scale, technological advancements, and access to raw materials. The market is characterized by ongoing innovation, particularly in materials science and manufacturing processes, to improve brush performance and durability. Regulatory frameworks, including environmental regulations related to material sourcing and manufacturing waste, significantly impact the industry. Product substitutes, such as carbon brushes and other conductive materials, pose a competitive challenge, particularly in specific applications. End-user trends, driven by the increasing demand for electric vehicles and industrial automation, are shaping market demand. M&A activities within the sector have been moderate, with a total deal value estimated at $XX million in the past five years. Key deals have focused on expanding geographical reach and acquiring specialized technologies.
- Market Share (2025): Sinotech (15%), Mersen (12%), Carbex (10%), TOYO TANSO (8%), Aupac (7%), OCI (5%), St. Marys Carbon (4%), Helwig Carbon Products (3%), Others (40%).
- M&A Deal Value (2020-2024): $XX million
Metal Graphite Brush Industry Trends & Insights
The Metal Graphite Brush market is experiencing robust growth, driven by several key factors. The rising adoption of electric vehicles (EVs) is a primary driver, fueled by increasing environmental concerns and government regulations promoting sustainable transportation. The growth of the industrial automation sector, particularly in robotics and electric motors, further contributes to market expansion. Technological advancements in material science, leading to the development of high-performance brushes with enhanced durability and conductivity, are fueling market innovation. Consumer preferences are shifting towards eco-friendly and high-performance products, impacting product development and marketing strategies. Competitive dynamics are shaped by pricing pressures, technological innovation, and the entry of new players. The market is estimated to exhibit a CAGR of XX% from 2025 to 2033, with significant market penetration in key industries. The market penetration is estimated to increase from XX% in 2025 to XX% by 2033.
Dominant Markets & Segments in Metal Graphite Brush
The Asia-Pacific region is currently the dominant market for Metal Graphite Brushes, driven by strong economic growth, rapid industrialization, and a burgeoning automotive sector, particularly in China and India. High infrastructure development and government policies supporting renewable energy and electric vehicle manufacturing contribute to this dominance.
- Key Drivers in Asia-Pacific:
- Rapid industrialization and infrastructure development.
- Strong growth in the automotive sector, particularly electric vehicles.
- Supportive government policies promoting renewable energy and technological advancements.
- Increasing demand from diverse industrial applications.
Europe and North America also hold significant market share, though at a comparatively slower growth rate than Asia-Pacific. The automotive and industrial sectors are key end-use industries in these regions.
Metal Graphite Brush Product Innovations
Recent innovations in Metal Graphite Brushes focus on enhancing conductivity, improving wear resistance, and reducing friction. The development of advanced materials, such as nano-structured graphite and metal-matrix composites, has led to the creation of high-performance brushes with extended lifespans and improved efficiency. These innovations cater to the increasing demand for reliable and durable brushes in demanding applications, such as high-speed motors and heavy-duty equipment. The integration of smart sensors and monitoring systems in some brushes allows for predictive maintenance, improving operational efficiency and reducing downtime.
Report Segmentation & Scope
This report segments the Metal Graphite Brush market based on several key parameters:
By Type: This segment analyzes different types of Metal Graphite Brushes based on their composition, size, and specific applications. The market size and growth projections for each type are presented.
By Application: This segment classifies Metal Graphite Brushes based on their usage in different industries and applications such as electric motors, generators, and various industrial equipment.
By Region: This segment analyzes the regional distribution of Metal Graphite Brush demand and growth prospects across key regions worldwide. The competitive dynamics and market size for each region are examined. The regional segments include North America, Europe, Asia Pacific, Middle East & Africa, and South America.
Key Drivers of Metal Graphite Brush Growth
The primary drivers of Metal Graphite Brush market growth are the rising demand from the electric vehicle industry, the increasing adoption of industrial automation, and advancements in materials science resulting in improved brush performance. Government regulations promoting electric mobility and sustainable energy solutions are also significant contributing factors. Finally, the increasing demand for high-performance and durable brushes in diverse applications across various industries fuels market expansion.
Challenges in the Metal Graphite Brush Sector
Challenges facing the Metal Graphite Brush market include price fluctuations of raw materials, the potential for supply chain disruptions, and increasing competition from alternative technologies. Stringent environmental regulations related to the manufacturing process and disposal of spent brushes pose further challenges. These factors can impact the cost of production and limit the profitability of Metal Graphite Brush manufacturers.
Leading Players in the Metal Graphite Brush Market
- Sinotech
- Mersen
- Carbex
- TOYO TANSO
- Aupac
- Ohio Carbon Industries (OCI)
- St. Marys Carbon
- Helwig Carbon Products
Key Developments in Metal Graphite Brush Sector
- 2022 Q3: Mersen launched a new line of high-performance Metal Graphite Brushes designed for electric vehicle motors.
- 2023 Q1: Sinotech announced a strategic partnership with a leading automotive manufacturer to supply Metal Graphite Brushes for electric vehicle production.
- 2024 Q2: Carbex completed the acquisition of a smaller competitor, expanding its market share in North America. (Further details on acquisitions are needed for accuracy).
Strategic Metal Graphite Brush Market Outlook
The Metal Graphite Brush market is poised for significant growth over the forecast period, driven by technological advancements and increasing demand across diverse sectors. Strategic opportunities lie in investing in research and development, focusing on sustainability, and expanding into emerging markets. The focus on enhancing product performance, expanding applications, and developing sustainable manufacturing processes will be key to future success in this dynamic market.
Metal Graphite Brush Segmentation
-
1. Application
- 1.1. DC Machines
- 1.2. Asynchronous Motors
- 1.3. Synchronous Motors
- 1.4. Other
-
2. Type
- 2.1. Pure Molten Copper
- 2.2. Mixture of Molten Copper, Silver or Salts
- 2.3. Other
Metal Graphite Brush Segmentation By Geography
-
1. North America
- 1.1. United States
- 1.2. Canada
- 1.3. Mexico
-
2. South America
- 2.1. Brazil
- 2.2. Argentina
- 2.3. Rest of South America
-
3. Europe
- 3.1. United Kingdom
- 3.2. Germany
- 3.3. France
- 3.4. Italy
- 3.5. Spain
- 3.6. Russia
- 3.7. Benelux
- 3.8. Nordics
- 3.9. Rest of Europe
-
4. Middle East & Africa
- 4.1. Turkey
- 4.2. Israel
- 4.3. GCC
- 4.4. North Africa
- 4.5. South Africa
- 4.6. Rest of Middle East & Africa
-
5. Asia Pacific
- 5.1. China
- 5.2. India
- 5.3. Japan
- 5.4. South Korea
- 5.5. ASEAN
- 5.6. Oceania
- 5.7. Rest of Asia Pacific
Metal Graphite Brush REPORT HIGHLIGHTS
| Aspects | Details |
|---|---|
| Study Period | 2019-2033 |
| Base Year | 2024 |
| Estimated Year | 2025 |
| Forecast Period | 2025-2033 |
| Historical Period | 2019-2024 |
| Growth Rate | CAGR of XXX% from 2019-2033 |
| Segmentation |
|
Table of Contents
- 1. Introduction
- 1.1. Research Scope
- 1.2. Market Segmentation
- 1.3. Research Methodology
- 1.4. Definitions and Assumptions
- 2. Executive Summary
- 2.1. Introduction
- 3. Market Dynamics
- 3.1. Introduction
- 3.2. Market Drivers
- 3.3. Market Restrains
- 3.4. Market Trends
- 4. Market Factor Analysis
- 4.1. Porters Five Forces
- 4.2. Supply/Value Chain
- 4.3. PESTEL analysis
- 4.4. Market Entropy
- 4.5. Patent/Trademark Analysis
- 5. Global Metal Graphite Brush Analysis, Insights and Forecast, 2019-2031
- 5.1. Market Analysis, Insights and Forecast - by Application
- 5.1.1. DC Machines
- 5.1.2. Asynchronous Motors
- 5.1.3. Synchronous Motors
- 5.1.4. Other
- 5.2. Market Analysis, Insights and Forecast - by Type
- 5.2.1. Pure Molten Copper
- 5.2.2. Mixture of Molten Copper, Silver or Salts
- 5.2.3. Other
- 5.3. Market Analysis, Insights and Forecast - by Region
- 5.3.1. North America
- 5.3.2. South America
- 5.3.3. Europe
- 5.3.4. Middle East & Africa
- 5.3.5. Asia Pacific
- 5.1. Market Analysis, Insights and Forecast - by Application
- 6. North America Metal Graphite Brush Analysis, Insights and Forecast, 2019-2031
- 6.1. Market Analysis, Insights and Forecast - by Application
- 6.1.1. DC Machines
- 6.1.2. Asynchronous Motors
- 6.1.3. Synchronous Motors
- 6.1.4. Other
- 6.2. Market Analysis, Insights and Forecast - by Type
- 6.2.1. Pure Molten Copper
- 6.2.2. Mixture of Molten Copper, Silver or Salts
- 6.2.3. Other
- 6.1. Market Analysis, Insights and Forecast - by Application
- 7. South America Metal Graphite Brush Analysis, Insights and Forecast, 2019-2031
- 7.1. Market Analysis, Insights and Forecast - by Application
- 7.1.1. DC Machines
- 7.1.2. Asynchronous Motors
- 7.1.3. Synchronous Motors
- 7.1.4. Other
- 7.2. Market Analysis, Insights and Forecast - by Type
- 7.2.1. Pure Molten Copper
- 7.2.2. Mixture of Molten Copper, Silver or Salts
- 7.2.3. Other
- 7.1. Market Analysis, Insights and Forecast - by Application
- 8. Europe Metal Graphite Brush Analysis, Insights and Forecast, 2019-2031
- 8.1. Market Analysis, Insights and Forecast - by Application
- 8.1.1. DC Machines
- 8.1.2. Asynchronous Motors
- 8.1.3. Synchronous Motors
- 8.1.4. Other
- 8.2. Market Analysis, Insights and Forecast - by Type
- 8.2.1. Pure Molten Copper
- 8.2.2. Mixture of Molten Copper, Silver or Salts
- 8.2.3. Other
- 8.1. Market Analysis, Insights and Forecast - by Application
- 9. Middle East & Africa Metal Graphite Brush Analysis, Insights and Forecast, 2019-2031
- 9.1. Market Analysis, Insights and Forecast - by Application
- 9.1.1. DC Machines
- 9.1.2. Asynchronous Motors
- 9.1.3. Synchronous Motors
- 9.1.4. Other
- 9.2. Market Analysis, Insights and Forecast - by Type
- 9.2.1. Pure Molten Copper
- 9.2.2. Mixture of Molten Copper, Silver or Salts
- 9.2.3. Other
- 9.1. Market Analysis, Insights and Forecast - by Application
- 10. Asia Pacific Metal Graphite Brush Analysis, Insights and Forecast, 2019-2031
- 10.1. Market Analysis, Insights and Forecast - by Application
- 10.1.1. DC Machines
- 10.1.2. Asynchronous Motors
- 10.1.3. Synchronous Motors
- 10.1.4. Other
- 10.2. Market Analysis, Insights and Forecast - by Type
- 10.2.1. Pure Molten Copper
- 10.2.2. Mixture of Molten Copper, Silver or Salts
- 10.2.3. Other
- 10.1. Market Analysis, Insights and Forecast - by Application
- 11. Competitive Analysis
- 11.1. Global Market Share Analysis 2024
- 11.2. Company Profiles
- 11.2.1 Sinotech
- 11.2.1.1. Overview
- 11.2.1.2. Products
- 11.2.1.3. SWOT Analysis
- 11.2.1.4. Recent Developments
- 11.2.1.5. Financials (Based on Availability)
- 11.2.2 Mersen
- 11.2.2.1. Overview
- 11.2.2.2. Products
- 11.2.2.3. SWOT Analysis
- 11.2.2.4. Recent Developments
- 11.2.2.5. Financials (Based on Availability)
- 11.2.3 Carbex
- 11.2.3.1. Overview
- 11.2.3.2. Products
- 11.2.3.3. SWOT Analysis
- 11.2.3.4. Recent Developments
- 11.2.3.5. Financials (Based on Availability)
- 11.2.4 TOYO TANSO
- 11.2.4.1. Overview
- 11.2.4.2. Products
- 11.2.4.3. SWOT Analysis
- 11.2.4.4. Recent Developments
- 11.2.4.5. Financials (Based on Availability)
- 11.2.5 Aupac
- 11.2.5.1. Overview
- 11.2.5.2. Products
- 11.2.5.3. SWOT Analysis
- 11.2.5.4. Recent Developments
- 11.2.5.5. Financials (Based on Availability)
- 11.2.6 Ohio Carbon Industries (OCI)
- 11.2.6.1. Overview
- 11.2.6.2. Products
- 11.2.6.3. SWOT Analysis
- 11.2.6.4. Recent Developments
- 11.2.6.5. Financials (Based on Availability)
- 11.2.7 St. Marys Carbon
- 11.2.7.1. Overview
- 11.2.7.2. Products
- 11.2.7.3. SWOT Analysis
- 11.2.7.4. Recent Developments
- 11.2.7.5. Financials (Based on Availability)
- 11.2.8 Helwig Carbon Products
- 11.2.8.1. Overview
- 11.2.8.2. Products
- 11.2.8.3. SWOT Analysis
- 11.2.8.4. Recent Developments
- 11.2.8.5. Financials (Based on Availability)
- 11.2.1 Sinotech
List of Figures
- Figure 1: Global Metal Graphite Brush Revenue Breakdown (million, %) by Region 2024 & 2032
- Figure 2: Global Metal Graphite Brush Volume Breakdown (K, %) by Region 2024 & 2032
- Figure 3: North America Metal Graphite Brush Revenue (million), by Application 2024 & 2032
- Figure 4: North America Metal Graphite Brush Volume (K), by Application 2024 & 2032
- Figure 5: North America Metal Graphite Brush Revenue Share (%), by Application 2024 & 2032
- Figure 6: North America Metal Graphite Brush Volume Share (%), by Application 2024 & 2032
- Figure 7: North America Metal Graphite Brush Revenue (million), by Type 2024 & 2032
- Figure 8: North America Metal Graphite Brush Volume (K), by Type 2024 & 2032
- Figure 9: North America Metal Graphite Brush Revenue Share (%), by Type 2024 & 2032
- Figure 10: North America Metal Graphite Brush Volume Share (%), by Type 2024 & 2032
- Figure 11: North America Metal Graphite Brush Revenue (million), by Country 2024 & 2032
- Figure 12: North America Metal Graphite Brush Volume (K), by Country 2024 & 2032
- Figure 13: North America Metal Graphite Brush Revenue Share (%), by Country 2024 & 2032
- Figure 14: North America Metal Graphite Brush Volume Share (%), by Country 2024 & 2032
- Figure 15: South America Metal Graphite Brush Revenue (million), by Application 2024 & 2032
- Figure 16: South America Metal Graphite Brush Volume (K), by Application 2024 & 2032
- Figure 17: South America Metal Graphite Brush Revenue Share (%), by Application 2024 & 2032
- Figure 18: South America Metal Graphite Brush Volume Share (%), by Application 2024 & 2032
- Figure 19: South America Metal Graphite Brush Revenue (million), by Type 2024 & 2032
- Figure 20: South America Metal Graphite Brush Volume (K), by Type 2024 & 2032
- Figure 21: South America Metal Graphite Brush Revenue Share (%), by Type 2024 & 2032
- Figure 22: South America Metal Graphite Brush Volume Share (%), by Type 2024 & 2032
- Figure 23: South America Metal Graphite Brush Revenue (million), by Country 2024 & 2032
- Figure 24: South America Metal Graphite Brush Volume (K), by Country 2024 & 2032
- Figure 25: South America Metal Graphite Brush Revenue Share (%), by Country 2024 & 2032
- Figure 26: South America Metal Graphite Brush Volume Share (%), by Country 2024 & 2032
- Figure 27: Europe Metal Graphite Brush Revenue (million), by Application 2024 & 2032
- Figure 28: Europe Metal Graphite Brush Volume (K), by Application 2024 & 2032
- Figure 29: Europe Metal Graphite Brush Revenue Share (%), by Application 2024 & 2032
- Figure 30: Europe Metal Graphite Brush Volume Share (%), by Application 2024 & 2032
- Figure 31: Europe Metal Graphite Brush Revenue (million), by Type 2024 & 2032
- Figure 32: Europe Metal Graphite Brush Volume (K), by Type 2024 & 2032
- Figure 33: Europe Metal Graphite Brush Revenue Share (%), by Type 2024 & 2032
- Figure 34: Europe Metal Graphite Brush Volume Share (%), by Type 2024 & 2032
- Figure 35: Europe Metal Graphite Brush Revenue (million), by Country 2024 & 2032
- Figure 36: Europe Metal Graphite Brush Volume (K), by Country 2024 & 2032
- Figure 37: Europe Metal Graphite Brush Revenue Share (%), by Country 2024 & 2032
- Figure 38: Europe Metal Graphite Brush Volume Share (%), by Country 2024 & 2032
- Figure 39: Middle East & Africa Metal Graphite Brush Revenue (million), by Application 2024 & 2032
- Figure 40: Middle East & Africa Metal Graphite Brush Volume (K), by Application 2024 & 2032
- Figure 41: Middle East & Africa Metal Graphite Brush Revenue Share (%), by Application 2024 & 2032
- Figure 42: Middle East & Africa Metal Graphite Brush Volume Share (%), by Application 2024 & 2032
- Figure 43: Middle East & Africa Metal Graphite Brush Revenue (million), by Type 2024 & 2032
- Figure 44: Middle East & Africa Metal Graphite Brush Volume (K), by Type 2024 & 2032
- Figure 45: Middle East & Africa Metal Graphite Brush Revenue Share (%), by Type 2024 & 2032
- Figure 46: Middle East & Africa Metal Graphite Brush Volume Share (%), by Type 2024 & 2032
- Figure 47: Middle East & Africa Metal Graphite Brush Revenue (million), by Country 2024 & 2032
- Figure 48: Middle East & Africa Metal Graphite Brush Volume (K), by Country 2024 & 2032
- Figure 49: Middle East & Africa Metal Graphite Brush Revenue Share (%), by Country 2024 & 2032
- Figure 50: Middle East & Africa Metal Graphite Brush Volume Share (%), by Country 2024 & 2032
- Figure 51: Asia Pacific Metal Graphite Brush Revenue (million), by Application 2024 & 2032
- Figure 52: Asia Pacific Metal Graphite Brush Volume (K), by Application 2024 & 2032
- Figure 53: Asia Pacific Metal Graphite Brush Revenue Share (%), by Application 2024 & 2032
- Figure 54: Asia Pacific Metal Graphite Brush Volume Share (%), by Application 2024 & 2032
- Figure 55: Asia Pacific Metal Graphite Brush Revenue (million), by Type 2024 & 2032
- Figure 56: Asia Pacific Metal Graphite Brush Volume (K), by Type 2024 & 2032
- Figure 57: Asia Pacific Metal Graphite Brush Revenue Share (%), by Type 2024 & 2032
- Figure 58: Asia Pacific Metal Graphite Brush Volume Share (%), by Type 2024 & 2032
- Figure 59: Asia Pacific Metal Graphite Brush Revenue (million), by Country 2024 & 2032
- Figure 60: Asia Pacific Metal Graphite Brush Volume (K), by Country 2024 & 2032
- Figure 61: Asia Pacific Metal Graphite Brush Revenue Share (%), by Country 2024 & 2032
- Figure 62: Asia Pacific Metal Graphite Brush Volume Share (%), by Country 2024 & 2032
List of Tables
- Table 1: Global Metal Graphite Brush Revenue million Forecast, by Region 2019 & 2032
- Table 2: Global Metal Graphite Brush Volume K Forecast, by Region 2019 & 2032
- Table 3: Global Metal Graphite Brush Revenue million Forecast, by Application 2019 & 2032
- Table 4: Global Metal Graphite Brush Volume K Forecast, by Application 2019 & 2032
- Table 5: Global Metal Graphite Brush Revenue million Forecast, by Type 2019 & 2032
- Table 6: Global Metal Graphite Brush Volume K Forecast, by Type 2019 & 2032
- Table 7: Global Metal Graphite Brush Revenue million Forecast, by Region 2019 & 2032
- Table 8: Global Metal Graphite Brush Volume K Forecast, by Region 2019 & 2032
- Table 9: Global Metal Graphite Brush Revenue million Forecast, by Application 2019 & 2032
- Table 10: Global Metal Graphite Brush Volume K Forecast, by Application 2019 & 2032
- Table 11: Global Metal Graphite Brush Revenue million Forecast, by Type 2019 & 2032
- Table 12: Global Metal Graphite Brush Volume K Forecast, by Type 2019 & 2032
- Table 13: Global Metal Graphite Brush Revenue million Forecast, by Country 2019 & 2032
- Table 14: Global Metal Graphite Brush Volume K Forecast, by Country 2019 & 2032
- Table 15: United States Metal Graphite Brush Revenue (million) Forecast, by Application 2019 & 2032
- Table 16: United States Metal Graphite Brush Volume (K) Forecast, by Application 2019 & 2032
- Table 17: Canada Metal Graphite Brush Revenue (million) Forecast, by Application 2019 & 2032
- Table 18: Canada Metal Graphite Brush Volume (K) Forecast, by Application 2019 & 2032
- Table 19: Mexico Metal Graphite Brush Revenue (million) Forecast, by Application 2019 & 2032
- Table 20: Mexico Metal Graphite Brush Volume (K) Forecast, by Application 2019 & 2032
- Table 21: Global Metal Graphite Brush Revenue million Forecast, by Application 2019 & 2032
- Table 22: Global Metal Graphite Brush Volume K Forecast, by Application 2019 & 2032
- Table 23: Global Metal Graphite Brush Revenue million Forecast, by Type 2019 & 2032
- Table 24: Global Metal Graphite Brush Volume K Forecast, by Type 2019 & 2032
- Table 25: Global Metal Graphite Brush Revenue million Forecast, by Country 2019 & 2032
- Table 26: Global Metal Graphite Brush Volume K Forecast, by Country 2019 & 2032
- Table 27: Brazil Metal Graphite Brush Revenue (million) Forecast, by Application 2019 & 2032
- Table 28: Brazil Metal Graphite Brush Volume (K) Forecast, by Application 2019 & 2032
- Table 29: Argentina Metal Graphite Brush Revenue (million) Forecast, by Application 2019 & 2032
- Table 30: Argentina Metal Graphite Brush Volume (K) Forecast, by Application 2019 & 2032
- Table 31: Rest of South America Metal Graphite Brush Revenue (million) Forecast, by Application 2019 & 2032
- Table 32: Rest of South America Metal Graphite Brush Volume (K) Forecast, by Application 2019 & 2032
- Table 33: Global Metal Graphite Brush Revenue million Forecast, by Application 2019 & 2032
- Table 34: Global Metal Graphite Brush Volume K Forecast, by Application 2019 & 2032
- Table 35: Global Metal Graphite Brush Revenue million Forecast, by Type 2019 & 2032
- Table 36: Global Metal Graphite Brush Volume K Forecast, by Type 2019 & 2032
- Table 37: Global Metal Graphite Brush Revenue million Forecast, by Country 2019 & 2032
- Table 38: Global Metal Graphite Brush Volume K Forecast, by Country 2019 & 2032
- Table 39: United Kingdom Metal Graphite Brush Revenue (million) Forecast, by Application 2019 & 2032
- Table 40: United Kingdom Metal Graphite Brush Volume (K) Forecast, by Application 2019 & 2032
- Table 41: Germany Metal Graphite Brush Revenue (million) Forecast, by Application 2019 & 2032
- Table 42: Germany Metal Graphite Brush Volume (K) Forecast, by Application 2019 & 2032
- Table 43: France Metal Graphite Brush Revenue (million) Forecast, by Application 2019 & 2032
- Table 44: France Metal Graphite Brush Volume (K) Forecast, by Application 2019 & 2032
- Table 45: Italy Metal Graphite Brush Revenue (million) Forecast, by Application 2019 & 2032
- Table 46: Italy Metal Graphite Brush Volume (K) Forecast, by Application 2019 & 2032
- Table 47: Spain Metal Graphite Brush Revenue (million) Forecast, by Application 2019 & 2032
- Table 48: Spain Metal Graphite Brush Volume (K) Forecast, by Application 2019 & 2032
- Table 49: Russia Metal Graphite Brush Revenue (million) Forecast, by Application 2019 & 2032
- Table 50: Russia Metal Graphite Brush Volume (K) Forecast, by Application 2019 & 2032
- Table 51: Benelux Metal Graphite Brush Revenue (million) Forecast, by Application 2019 & 2032
- Table 52: Benelux Metal Graphite Brush Volume (K) Forecast, by Application 2019 & 2032
- Table 53: Nordics Metal Graphite Brush Revenue (million) Forecast, by Application 2019 & 2032
- Table 54: Nordics Metal Graphite Brush Volume (K) Forecast, by Application 2019 & 2032
- Table 55: Rest of Europe Metal Graphite Brush Revenue (million) Forecast, by Application 2019 & 2032
- Table 56: Rest of Europe Metal Graphite Brush Volume (K) Forecast, by Application 2019 & 2032
- Table 57: Global Metal Graphite Brush Revenue million Forecast, by Application 2019 & 2032
- Table 58: Global Metal Graphite Brush Volume K Forecast, by Application 2019 & 2032
- Table 59: Global Metal Graphite Brush Revenue million Forecast, by Type 2019 & 2032
- Table 60: Global Metal Graphite Brush Volume K Forecast, by Type 2019 & 2032
- Table 61: Global Metal Graphite Brush Revenue million Forecast, by Country 2019 & 2032
- Table 62: Global Metal Graphite Brush Volume K Forecast, by Country 2019 & 2032
- Table 63: Turkey Metal Graphite Brush Revenue (million) Forecast, by Application 2019 & 2032
- Table 64: Turkey Metal Graphite Brush Volume (K) Forecast, by Application 2019 & 2032
- Table 65: Israel Metal Graphite Brush Revenue (million) Forecast, by Application 2019 & 2032
- Table 66: Israel Metal Graphite Brush Volume (K) Forecast, by Application 2019 & 2032
- Table 67: GCC Metal Graphite Brush Revenue (million) Forecast, by Application 2019 & 2032
- Table 68: GCC Metal Graphite Brush Volume (K) Forecast, by Application 2019 & 2032
- Table 69: North Africa Metal Graphite Brush Revenue (million) Forecast, by Application 2019 & 2032
- Table 70: North Africa Metal Graphite Brush Volume (K) Forecast, by Application 2019 & 2032
- Table 71: South Africa Metal Graphite Brush Revenue (million) Forecast, by Application 2019 & 2032
- Table 72: South Africa Metal Graphite Brush Volume (K) Forecast, by Application 2019 & 2032
- Table 73: Rest of Middle East & Africa Metal Graphite Brush Revenue (million) Forecast, by Application 2019 & 2032
- Table 74: Rest of Middle East & Africa Metal Graphite Brush Volume (K) Forecast, by Application 2019 & 2032
- Table 75: Global Metal Graphite Brush Revenue million Forecast, by Application 2019 & 2032
- Table 76: Global Metal Graphite Brush Volume K Forecast, by Application 2019 & 2032
- Table 77: Global Metal Graphite Brush Revenue million Forecast, by Type 2019 & 2032
- Table 78: Global Metal Graphite Brush Volume K Forecast, by Type 2019 & 2032
- Table 79: Global Metal Graphite Brush Revenue million Forecast, by Country 2019 & 2032
- Table 80: Global Metal Graphite Brush Volume K Forecast, by Country 2019 & 2032
- Table 81: China Metal Graphite Brush Revenue (million) Forecast, by Application 2019 & 2032
- Table 82: China Metal Graphite Brush Volume (K) Forecast, by Application 2019 & 2032
- Table 83: India Metal Graphite Brush Revenue (million) Forecast, by Application 2019 & 2032
- Table 84: India Metal Graphite Brush Volume (K) Forecast, by Application 2019 & 2032
- Table 85: Japan Metal Graphite Brush Revenue (million) Forecast, by Application 2019 & 2032
- Table 86: Japan Metal Graphite Brush Volume (K) Forecast, by Application 2019 & 2032
- Table 87: South Korea Metal Graphite Brush Revenue (million) Forecast, by Application 2019 & 2032
- Table 88: South Korea Metal Graphite Brush Volume (K) Forecast, by Application 2019 & 2032
- Table 89: ASEAN Metal Graphite Brush Revenue (million) Forecast, by Application 2019 & 2032
- Table 90: ASEAN Metal Graphite Brush Volume (K) Forecast, by Application 2019 & 2032
- Table 91: Oceania Metal Graphite Brush Revenue (million) Forecast, by Application 2019 & 2032
- Table 92: Oceania Metal Graphite Brush Volume (K) Forecast, by Application 2019 & 2032
- Table 93: Rest of Asia Pacific Metal Graphite Brush Revenue (million) Forecast, by Application 2019 & 2032
- Table 94: Rest of Asia Pacific Metal Graphite Brush Volume (K) Forecast, by Application 2019 & 2032
Frequently Asked Questions
1. What is the projected Compound Annual Growth Rate (CAGR) of the Metal Graphite Brush?
The projected CAGR is approximately XXX%.
2. Which companies are prominent players in the Metal Graphite Brush?
Key companies in the market include Sinotech, Mersen, Carbex, TOYO TANSO, Aupac, Ohio Carbon Industries (OCI), St. Marys Carbon, Helwig Carbon Products.
3. What are the main segments of the Metal Graphite Brush?
The market segments include Application, Type.
4. Can you provide details about the market size?
The market size is estimated to be USD XXX million as of 2022.
5. What are some drivers contributing to market growth?
N/A
6. What are the notable trends driving market growth?
N/A
7. Are there any restraints impacting market growth?
N/A
8. Can you provide examples of recent developments in the market?
N/A
9. What pricing options are available for accessing the report?
Pricing options include single-user, multi-user, and enterprise licenses priced at USD 3950.00, USD 5925.00, and USD 7900.00 respectively.
10. Is the market size provided in terms of value or volume?
The market size is provided in terms of value, measured in million and volume, measured in K.
11. Are there any specific market keywords associated with the report?
Yes, the market keyword associated with the report is "Metal Graphite Brush," which aids in identifying and referencing the specific market segment covered.
12. How do I determine which pricing option suits my needs best?
The pricing options vary based on user requirements and access needs. Individual users may opt for single-user licenses, while businesses requiring broader access may choose multi-user or enterprise licenses for cost-effective access to the report.
13. Are there any additional resources or data provided in the Metal Graphite Brush report?
While the report offers comprehensive insights, it's advisable to review the specific contents or supplementary materials provided to ascertain if additional resources or data are available.
14. How can I stay updated on further developments or reports in the Metal Graphite Brush?
To stay informed about further developments, trends, and reports in the Metal Graphite Brush, consider subscribing to industry newsletters, following relevant companies and organizations, or regularly checking reputable industry news sources and publications.
Methodology
Step 1 - Identification of Relevant Samples Size from Population Database


Step 2 - Approaches for Defining Global Market Size (Value, Volume* & Price*)

Note*: In applicable scenarios
Step 3 - Data Sources
Primary Research
- Web Analytics
- Survey Reports
- Research Institute
- Latest Research Reports
- Opinion Leaders
Secondary Research
- Annual Reports
- White Paper
- Latest Press Release
- Industry Association
- Paid Database
- Investor Presentations

Step 4 - Data Triangulation
Involves using different sources of information in order to increase the validity of a study
These sources are likely to be stakeholders in a program - participants, other researchers, program staff, other community members, and so on.
Then we put all data in single framework & apply various statistical tools to find out the dynamic on the market.
During the analysis stage, feedback from the stakeholder groups would be compared to determine areas of agreement as well as areas of divergence


